| Param | Original file | Final file |
|---|---|---|
| Filename | modeM0/AS1A05_013T01_9000005822_42679cztM0_level2.fits | modeM0/AS1A05_013T01_9000005822_42679cztM0_level2_quad_clean.evt |
| Size (bytes) | 381,614,400 | 81,973,440 |
| Size | 363.9 MB | 78.2 MB |
| Events in quadrant A | 2,775,267 | 586,506 |
| Events in quadrant B | 5,367,199 | 458,560 |
| Events in quadrant C | 2,505,493 | 572,213 |
| Events in quadrant D | 3,090,717 | 516,648 |
| Mode M0 | |||
|---|---|---|---|
| Quadrant | BADHDUFLAG | Total packets | Discarded packets |
| A | 0 | 10952 | 2 |
| B | 0 | 19186 | 2 |
| C | 0 | 10277 | 2 |
| D | 0 | 12529 | 2 |
| Mode M9 | |||
|---|---|---|---|
| Quadrant | BADHDUFLAG | Total packets | Discarded packets |
| A | 0 | 38 | 0 |
| B | 0 | 39 | 0 |
| C | 0 | 39 | 0 |
| D | 0 | 39 | 0 |
| Mode SS | |||
|---|---|---|---|
| Quadrant | BADHDUFLAG | Total packets | Discarded packets |
| A | 0 | 100 | 0 |
| B | 0 | 100 | 0 |
| C | 0 | 100 | 0 |
| D | 0 | 100 | 0 |
| Quadrant | Total seconds | Saturated seconds | Saturation percentage |
|---|---|---|---|
| A | 4971 | 10 | 0.201167% |
| B | 4971 | 1283 | 25.809696% |
| C | 4971 | 5 | 0.100583% |
| D | 4971 | 135 | 2.715751% |
Noise dominated data is calculated using 1-second bins in cleaned event files. If a bin has >2000 counts, and if more than 50% of those come from <1% of pixels, then it is considered to be noise-dominated and hence unusable.
| Quadrant | # 1 sec bins | Bins with >0 counts | Bins with >2000 counts | High rate bins dominated by noise | Noise dominated (total time) | Noise dominated (detector-on time) | Marked lightcurve |
|---|---|---|---|---|---|---|---|
| A | 7062 | 4972 | 2 | 2 | 0.03% | 0.04% | 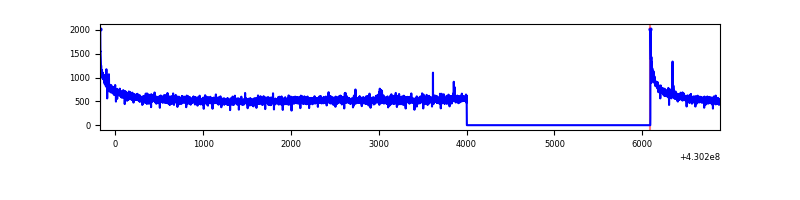 |
| B | 7062 | 4971 | 1234 | 1234 | 17.47% | 24.82% | 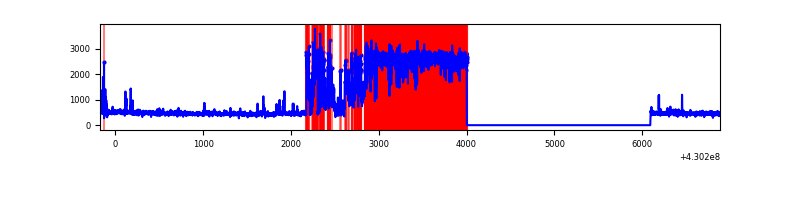 |
| C | 7062 | 4972 | 4 | 4 | 0.06% | 0.08% | 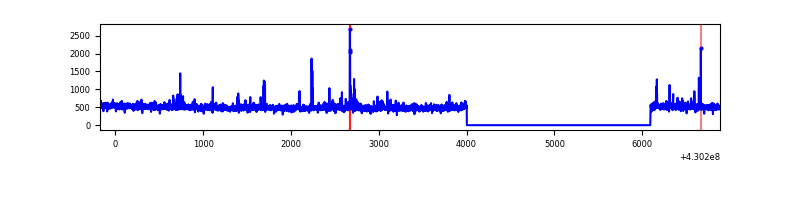 |
| D | 7062 | 4972 | 133 | 133 | 1.88% | 2.67% | 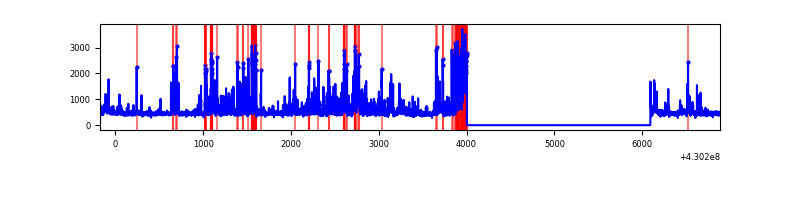 |
Top three noisy pixels from each quadrant. If the there are fewer than three noisy pixels in the level2.evt file, extra rows are filled as -1
| Pixel properties | Quadrant properties | ||||||
|---|---|---|---|---|---|---|---|
| Quadrant | DetID | PixID | Counts | Sigma | Mean | Median | Sigma |
| A | 10 | 83 | 560616 | 4793.14 | 568 | 556 | 116.8 |
| A | 13 | 6 | 7877 | 62.66 | 568 | 556 | 116.8 |
| A | 2 | 79 | 6470 | 50.61 | 568 | 556 | 116.8 |
| B | 10 | 246 | 3252276 | 34741.55 | 484 | 471 | 93.6 |
| B | 0 | 245 | 84655 | 899.4 | 484 | 471 | 93.6 |
| B | 3 | 112 | 29772 | 313.05 | 484 | 471 | 93.6 |
| C | 15 | 214 | 211208 | 1636.63 | 554 | 557 | 128.7 |
| C | 3 | 233 | 42083 | 322.63 | 554 | 557 | 128.7 |
| C | 14 | 254 | 34708 | 265.33 | 554 | 557 | 128.7 |
| D | 2 | 249 | 706032 | 5216.48 | 550 | 534 | 135.2 |
| D | 1 | 52 | 69105 | 507.01 | 550 | 534 | 135.2 |
| D | 12 | 6 | 50848 | 372.02 | 550 | 534 | 135.2 |
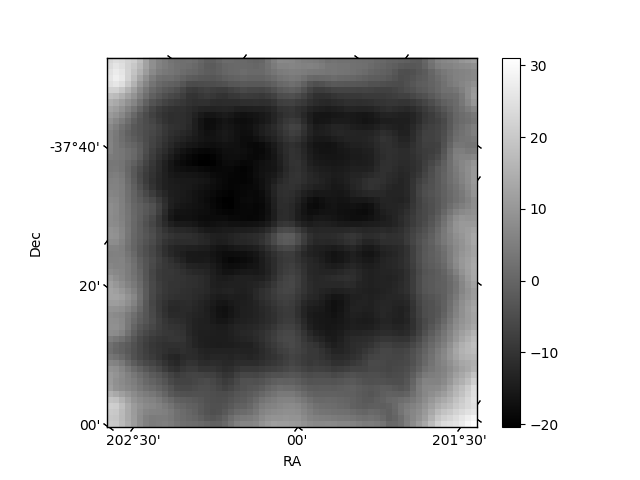
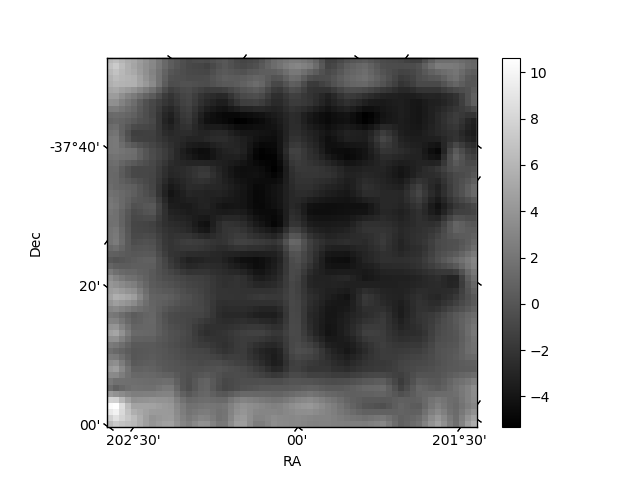
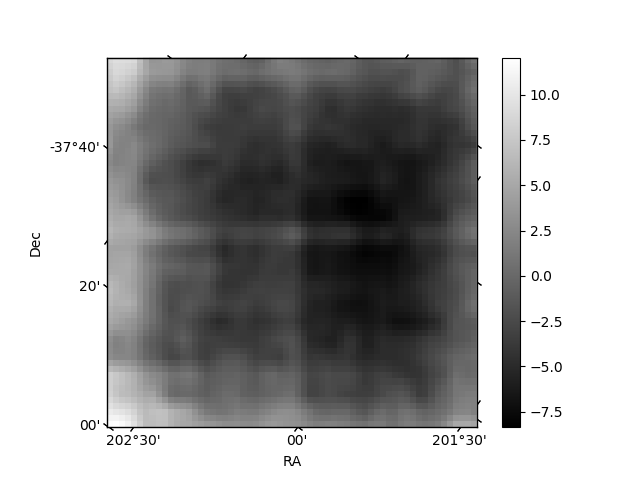
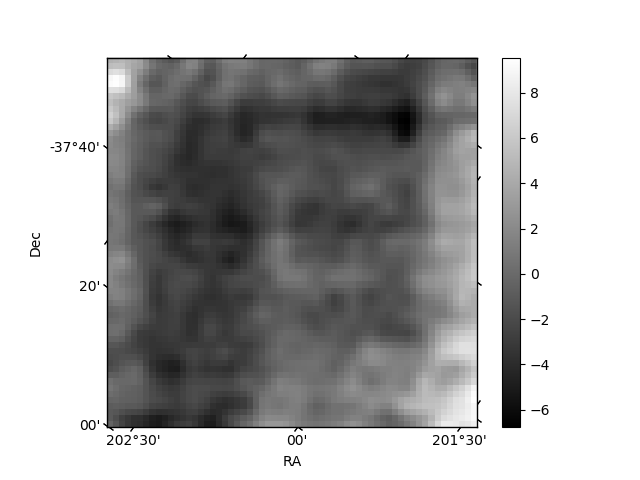
Histogram calculated using DETX and DETY for each event in the final _common_clean file
| Quadrant A | 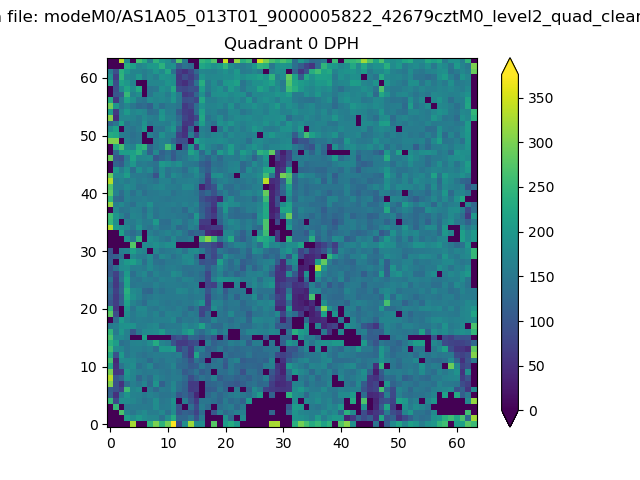 |
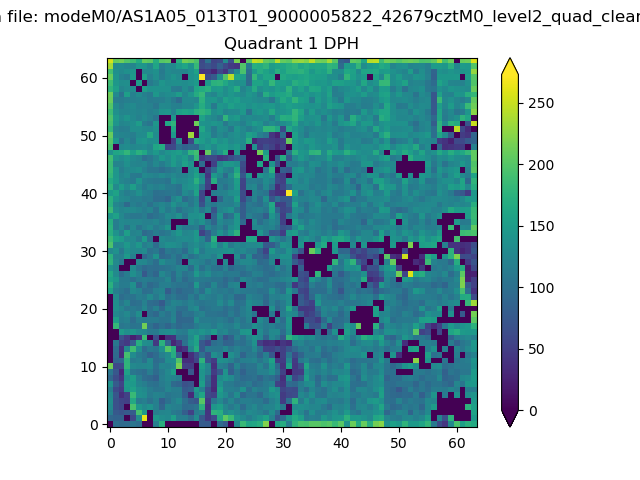 |
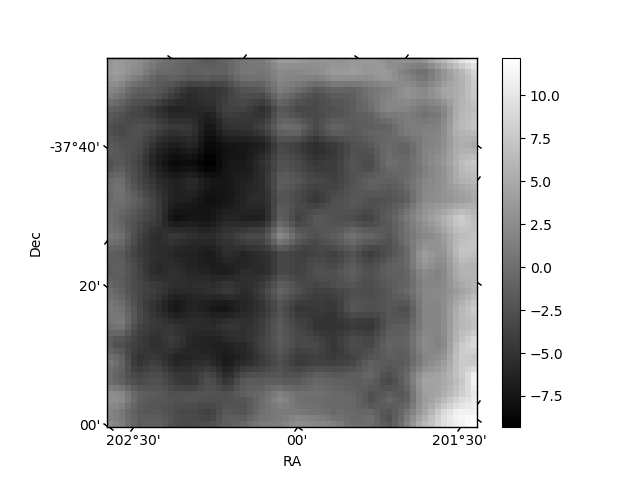
Quadrant B |
|---|---|---|---|
| Quadrant D | 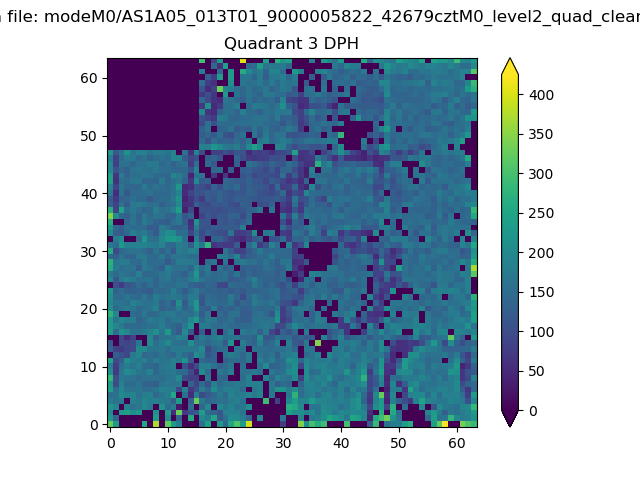 |
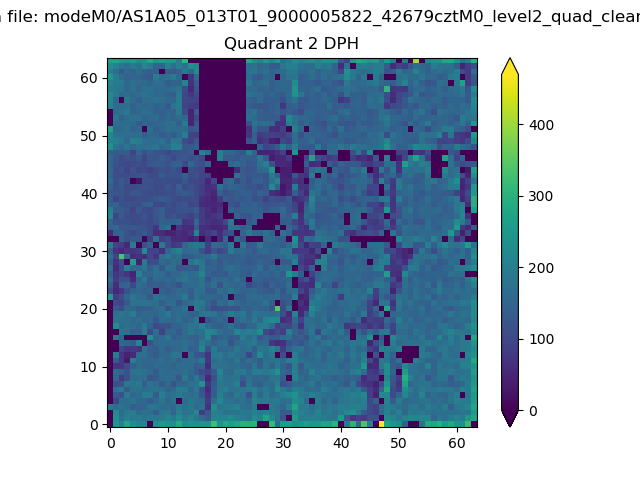 |
Quadrant C |
| Plot type | Count rate plots | Images |
|---|---|---|
| Comparison with Poisson distribution Blue bars denote a histogram of data divided into 1 sec bins. Red curve is a Poisson curve with rate = median count rate of data. |
 |
 |
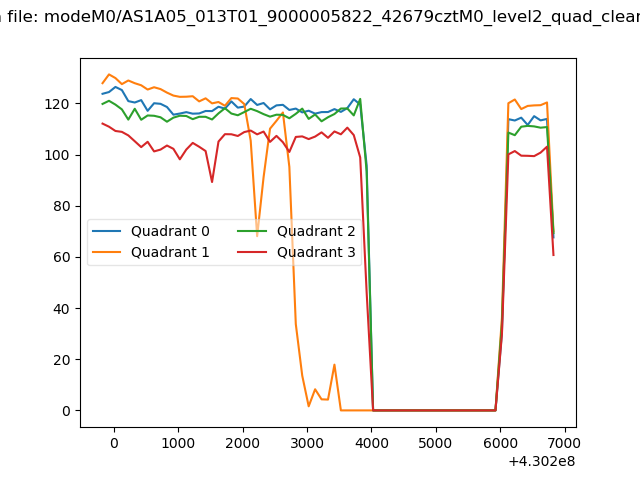
| Quadrant-wise count rates Data is divided into 100 sec bins |
 |
|
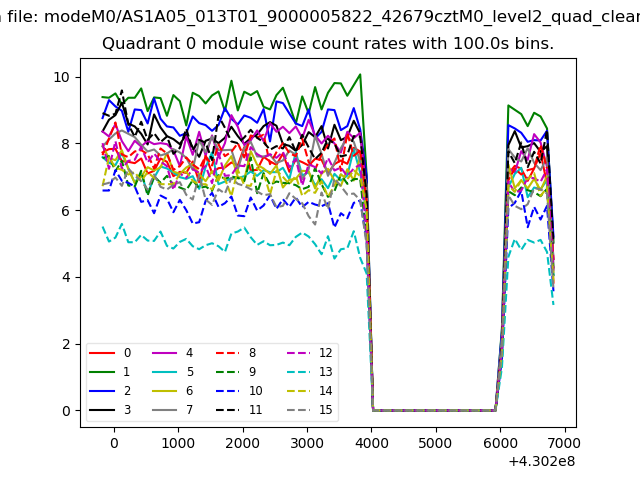
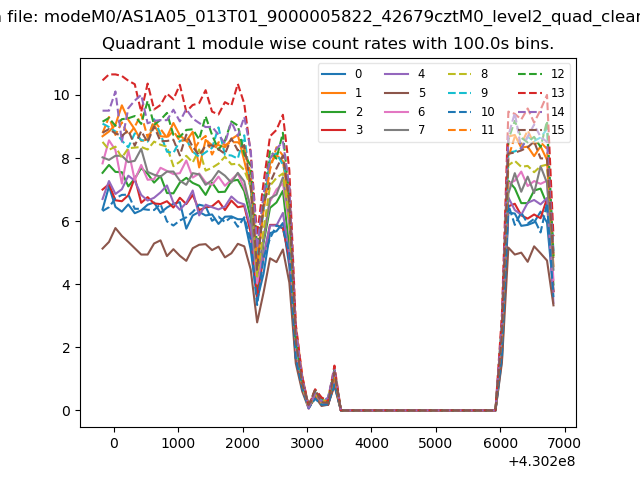
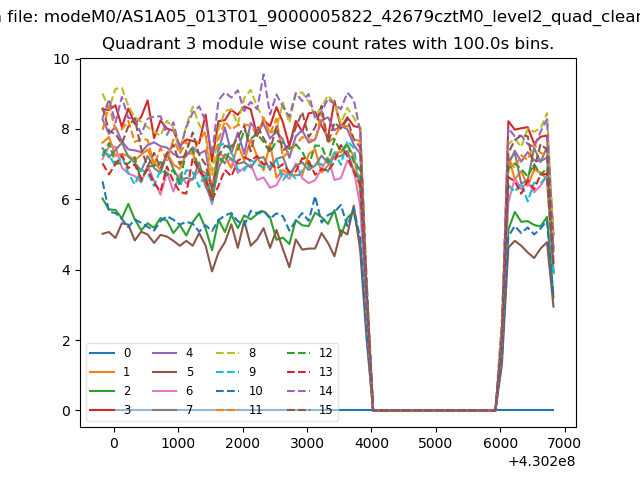
| Module-wise count rates for Quadrant A Data is divided into 100 sec bins |
 |
 |
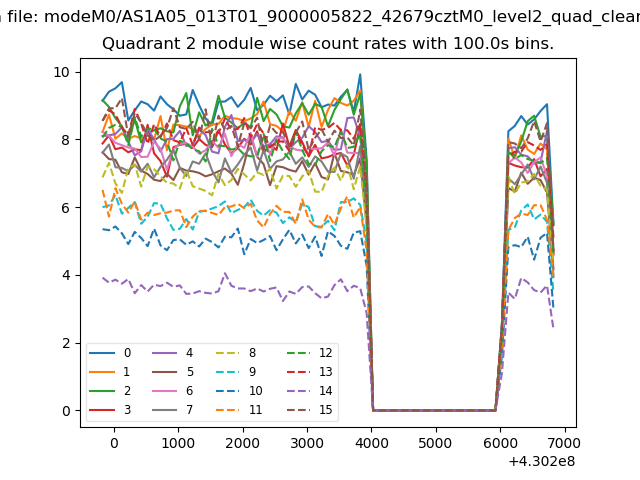
| Module-wise count rates for Quadrant B Data is divided into 100 sec bins |
 |
 |
| Module-wise count rates for Quadrant C Data is divided into 100 sec bins |
 |
 |
| Module-wise count rates for Quadrant D Data is divided into 100 sec bins |
 |
 |
| Parameter | Plot |
|---|---|
| CZT HV Monitor | 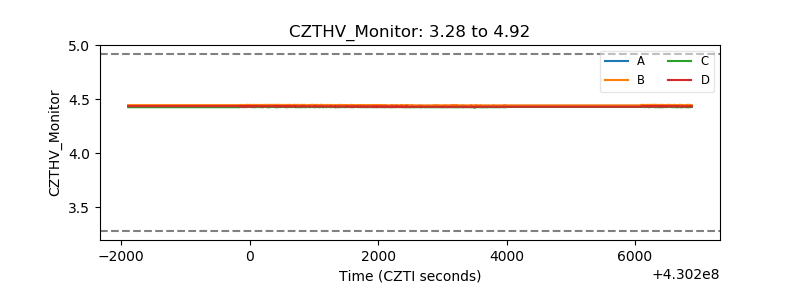 |
| D_VDD | 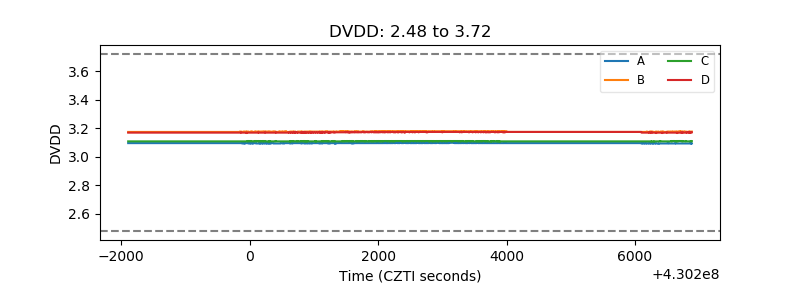 |
| Temperature 1 | 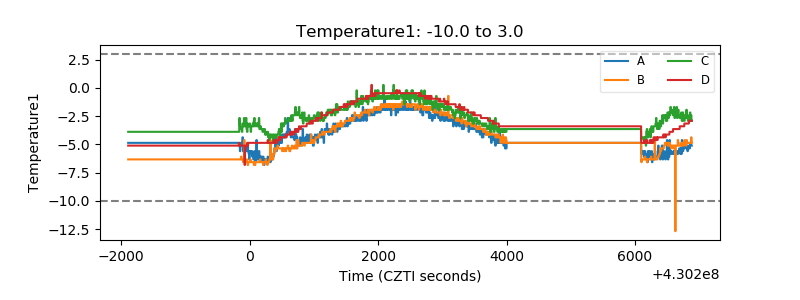 |
| Veto HV Monitor | 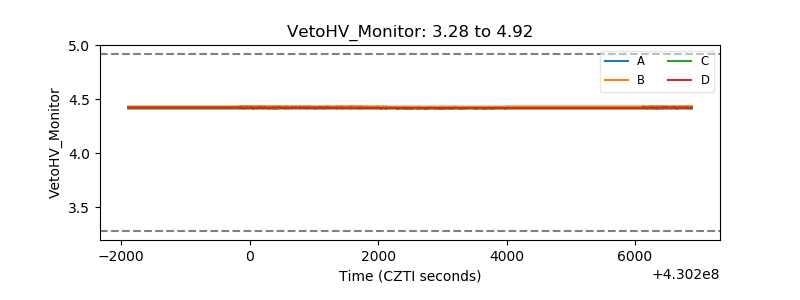 |
| Veto LLD | 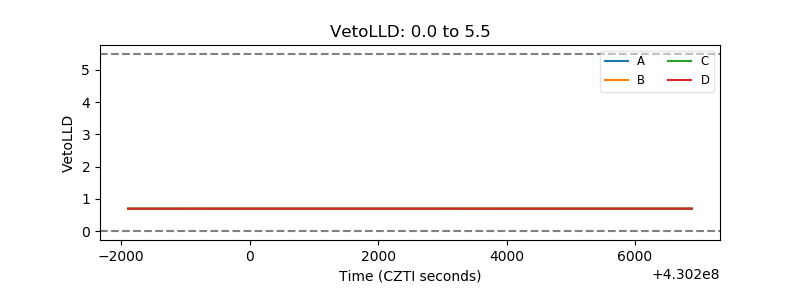 |
| Alpha Counter | 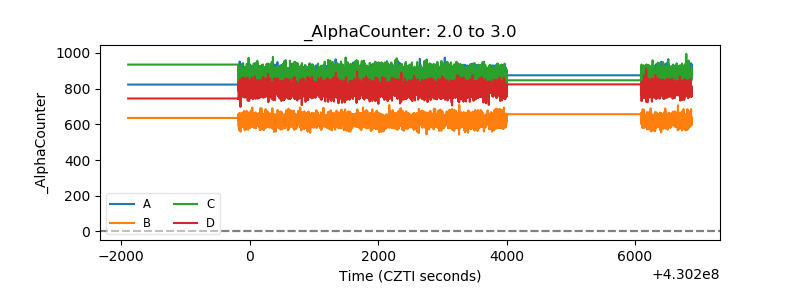 |
| _CPM_Rate | 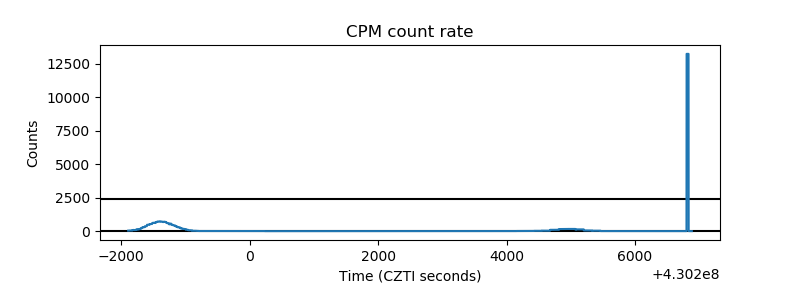 |
| CZT Counter | 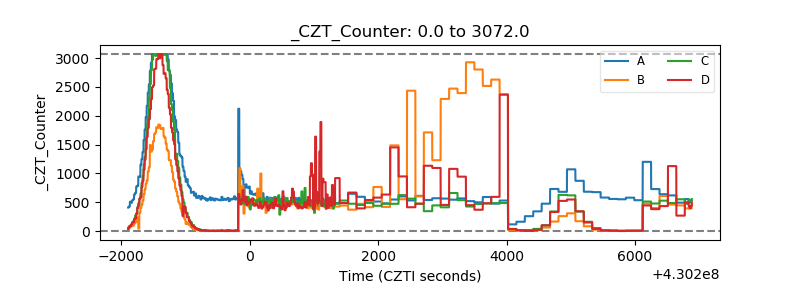 |
| +2.5 Volts monitor | 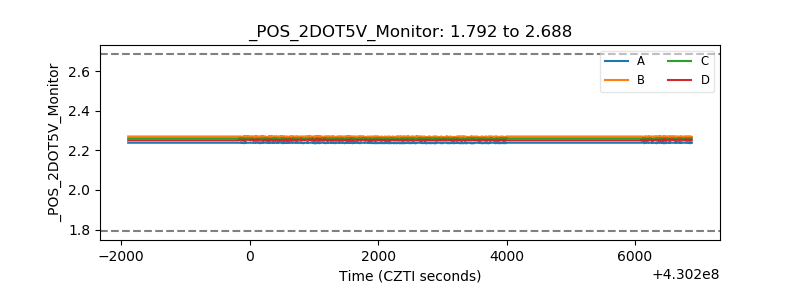 |
| +5 Volts monitor |  |
| _ROLL_ROT | 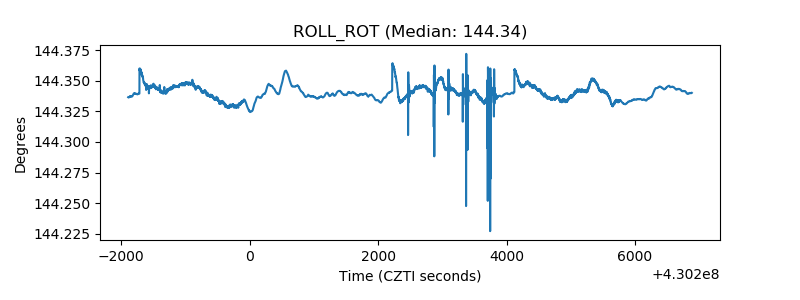 |
| _Roll_DEC | 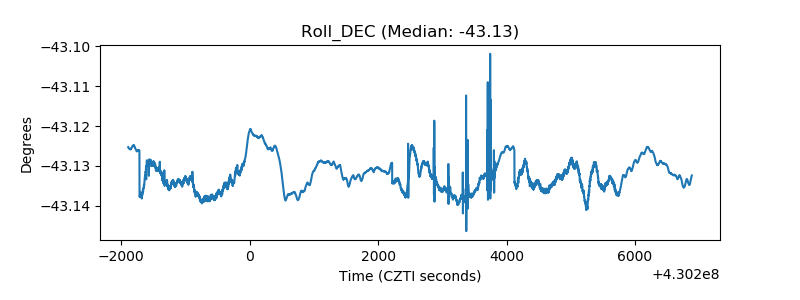 |
| _Roll_RA | 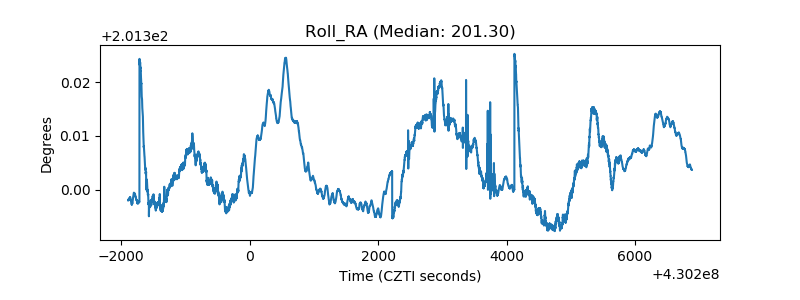 |
| Veto Counter |  |