| Param | Original file | Final file |
|---|---|---|
| Filename | modeM0/AS1A05_013T01_9000005822_42680cztM0_level2.fits | modeM0/AS1A05_013T01_9000005822_42680cztM0_level2_quad_clean.evt |
| Size (bytes) | 327,409,920 | 87,240,960 |
| Size | 312.2 MB | 83.2 MB |
| Events in quadrant A | 2,920,102 | 589,585 |
| Events in quadrant B | 2,696,239 | 599,108 |
| Events in quadrant C | 2,851,292 | 566,370 |
| Events in quadrant D | 3,244,708 | 520,739 |
| Mode M0 | |||
|---|---|---|---|
| Quadrant | BADHDUFLAG | Total packets | Discarded packets |
| A | 0 | 11639 | 2 |
| B | 0 | 11554 | 2 |
| C | 0 | 11621 | 2 |
| D | 0 | 13349 | 2 |
| Mode M9 | |||
|---|---|---|---|
| Quadrant | BADHDUFLAG | Total packets | Discarded packets |
| A | 0 | 40 | 0 |
| B | 0 | 40 | 0 |
| C | 0 | 40 | 0 |
| D | 0 | 40 | 0 |
| Mode SS | |||
|---|---|---|---|
| Quadrant | BADHDUFLAG | Total packets | Discarded packets |
| A | 0 | 108 | 0 |
| B | 0 | 108 | 0 |
| C | 0 | 108 | 0 |
| D | 0 | 108 | 0 |
| Quadrant | Total seconds | Saturated seconds | Saturation percentage |
|---|---|---|---|
| A | 5227 | 24 | 0.459154% |
| B | 5227 | 46 | 0.880046% |
| C | 5227 | 122 | 2.334035% |
| D | 5228 | 194 | 3.710788% |
Noise dominated data is calculated using 1-second bins in cleaned event files. If a bin has >2000 counts, and if more than 50% of those come from <1% of pixels, then it is considered to be noise-dominated and hence unusable.
| Quadrant | # 1 sec bins | Bins with >0 counts | Bins with >2000 counts | High rate bins dominated by noise | Noise dominated (total time) | Noise dominated (detector-on time) | Marked lightcurve |
|---|---|---|---|---|---|---|---|
| A | 9200 | 5229 | 15 | 15 | 0.16% | 0.29% | 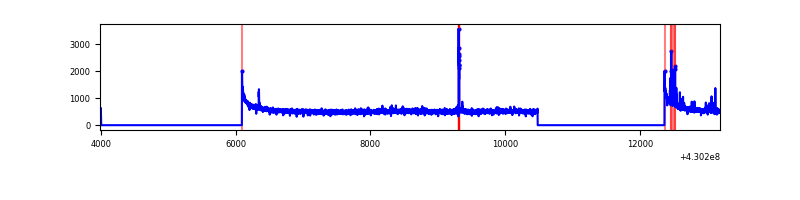 |
| B | 9200 | 5228 | 31 | 31 | 0.34% | 0.59% | 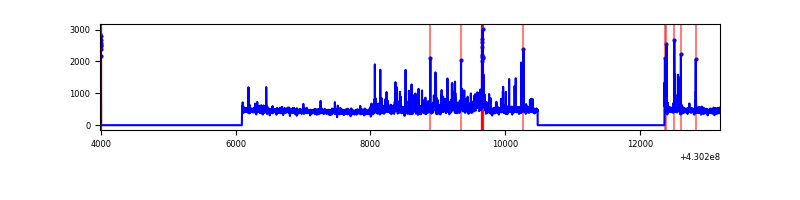 |
| C | 9200 | 5229 | 120 | 120 | 1.30% | 2.29% | 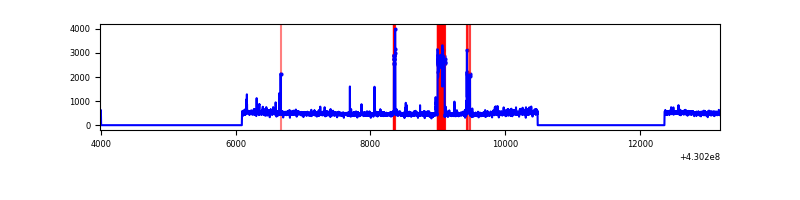 |
| D | 9201 | 5230 | 178 | 178 | 1.93% | 3.40% | 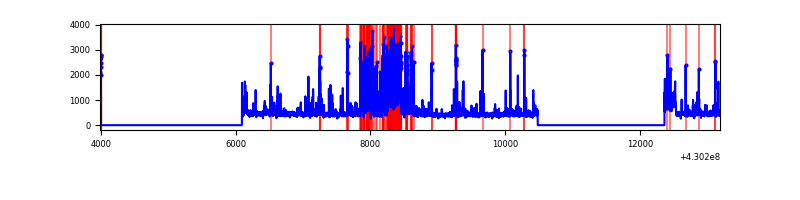 |
Top three noisy pixels from each quadrant. If the there are fewer than three noisy pixels in the level2.evt file, extra rows are filled as -1
| Pixel properties | Quadrant properties | ||||||
|---|---|---|---|---|---|---|---|
| Quadrant | DetID | PixID | Counts | Sigma | Mean | Median | Sigma |
| A | 10 | 83 | 571357 | 4751.17 | 579 | 568 | 120.1 |
| A | 13 | 248 | 55448 | 456.81 | 579 | 568 | 120.1 |
| A | 0 | 230 | 24712 | 200.97 | 579 | 568 | 120.1 |
| B | 0 | 245 | 227716 | 2058.35 | 571 | 557 | 110.4 |
| B | 5 | 255 | 65627 | 589.62 | 571 | 557 | 110.4 |
| B | 10 | 246 | 54070 | 484.9 | 571 | 557 | 110.4 |
| C | 9 | 54 | 303149 | 2344.52 | 557 | 562 | 129.1 |
| C | 15 | 214 | 221690 | 1713.35 | 557 | 562 | 129.1 |
| C | 3 | 233 | 43257 | 330.81 | 557 | 562 | 129.1 |
| D | 2 | 249 | 717273 | 5222.14 | 560 | 544 | 137.2 |
| D | 12 | 233 | 134455 | 975.69 | 560 | 544 | 137.2 |
| D | 13 | 249 | 95791 | 693.98 | 560 | 544 | 137.2 |
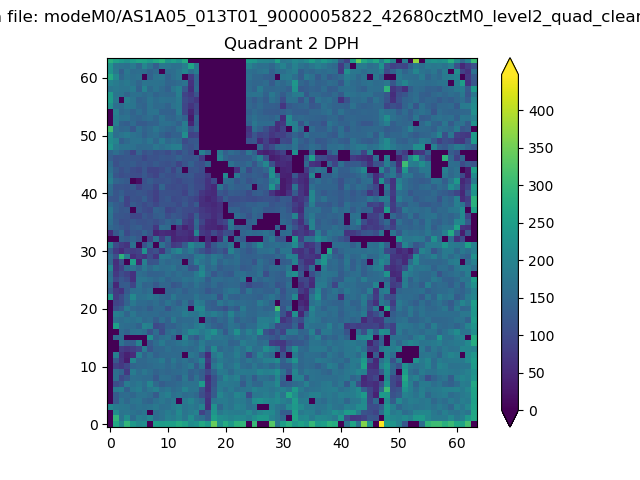
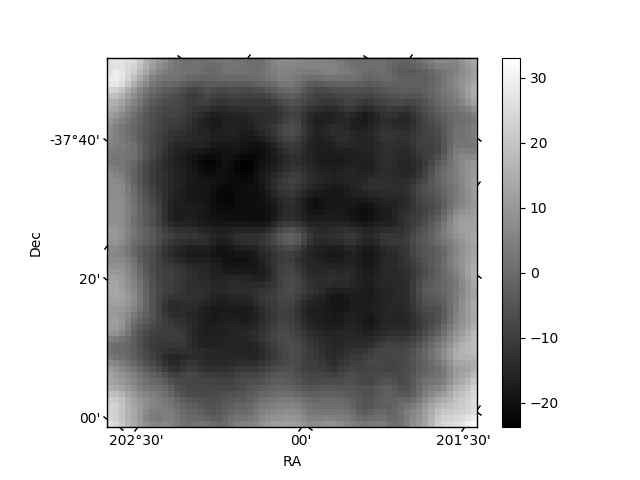
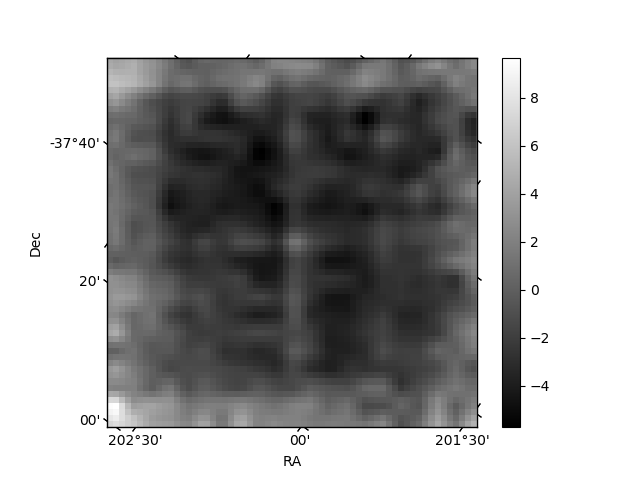
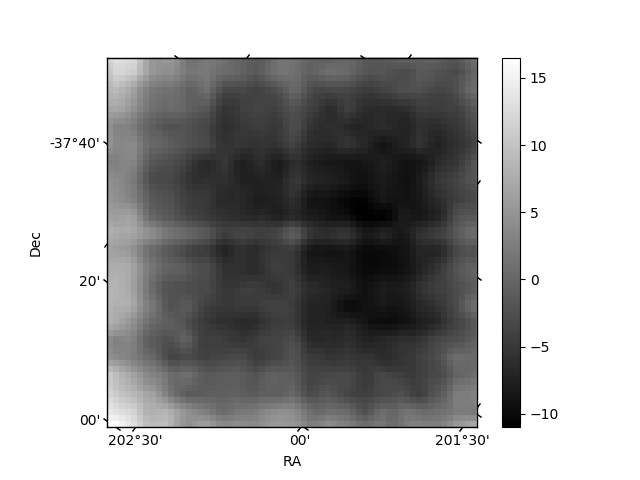
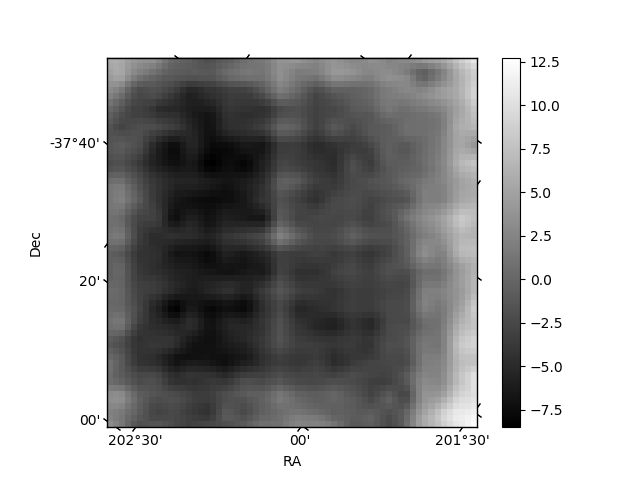
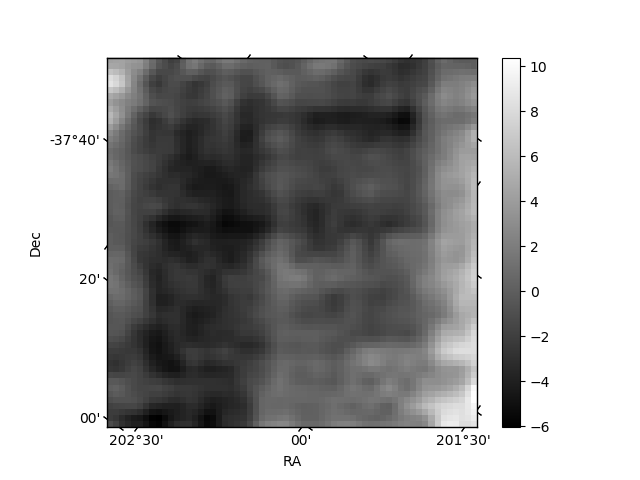
Histogram calculated using DETX and DETY for each event in the final _common_clean file
| Quadrant A | 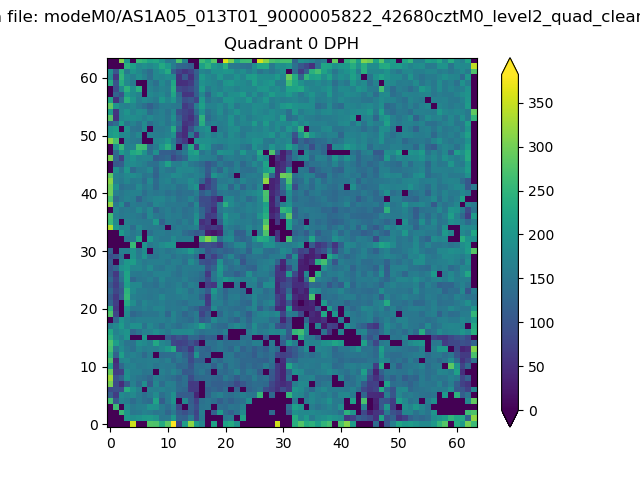 |
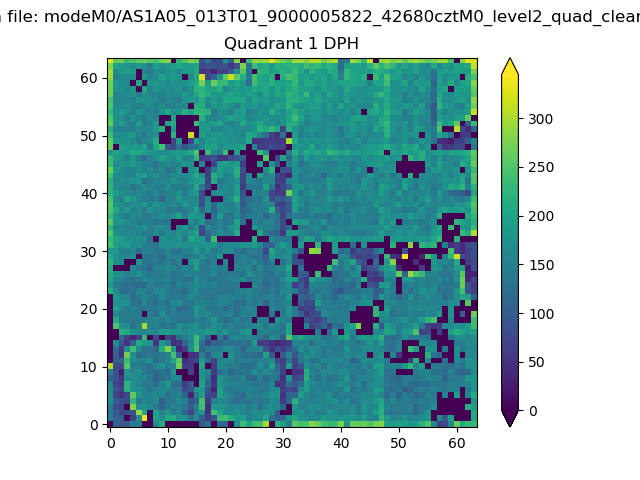 |
Quadrant B |
|---|---|---|---|
| Quadrant D | 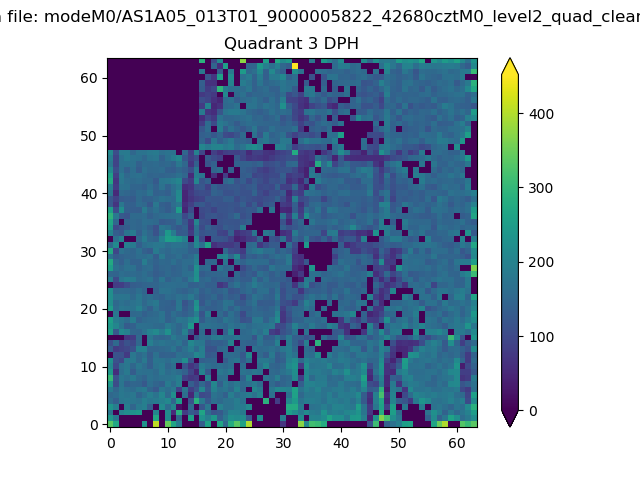 |
 |
Quadrant C |
| Plot type | Count rate plots | Images |
|---|---|---|
| Comparison with Poisson distribution Blue bars denote a histogram of data divided into 1 sec bins. Red curve is a Poisson curve with rate = median count rate of data. |
 |
 |
| Quadrant-wise count rates Data is divided into 100 sec bins |
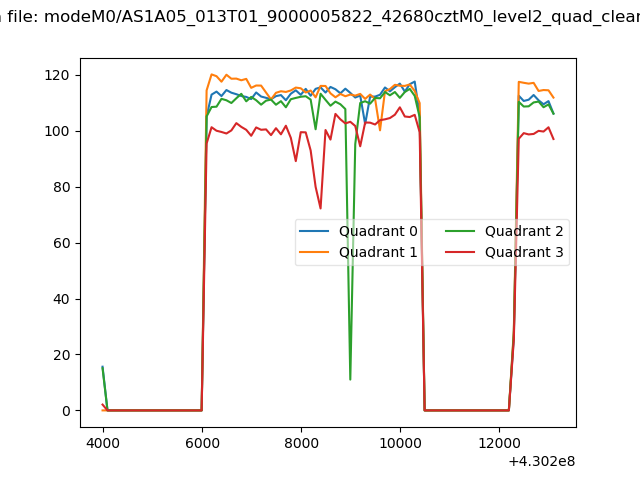 |
|
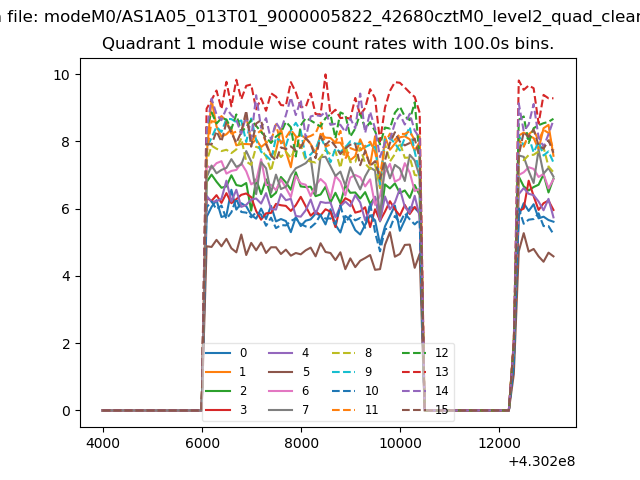
| Module-wise count rates for Quadrant A Data is divided into 100 sec bins |
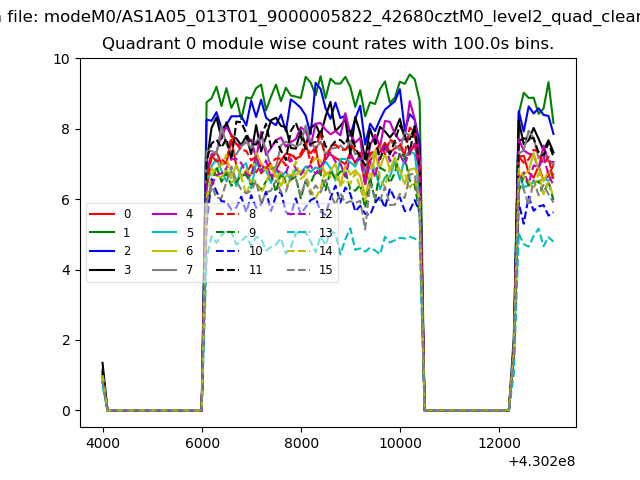 |
 |
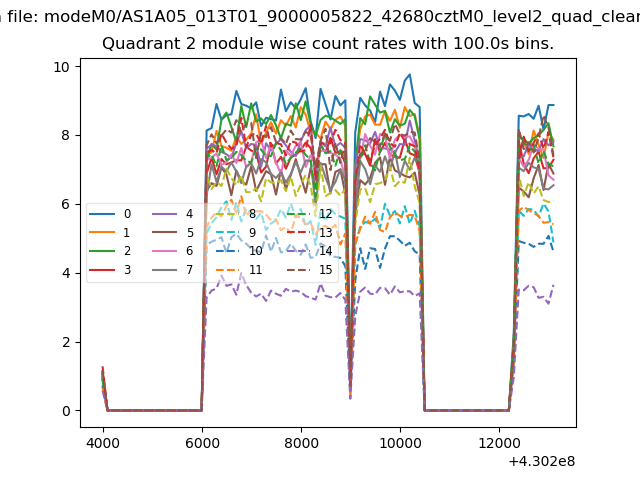
| Module-wise count rates for Quadrant B Data is divided into 100 sec bins |
 |
 |
| Module-wise count rates for Quadrant C Data is divided into 100 sec bins |
 |
 |
| Module-wise count rates for Quadrant D Data is divided into 100 sec bins |
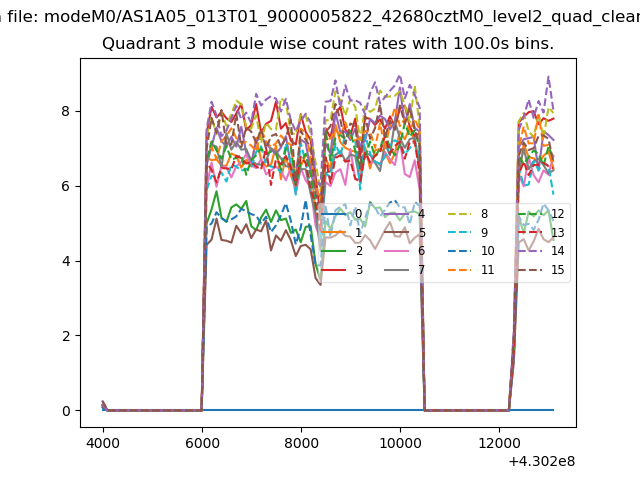 |
 |
| Parameter | Plot |
|---|---|
| CZT HV Monitor | 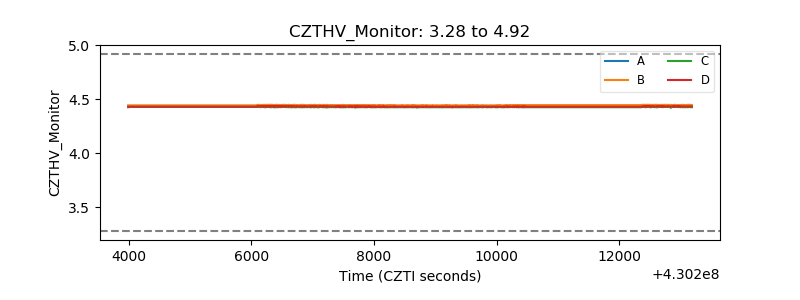 |
| D_VDD | 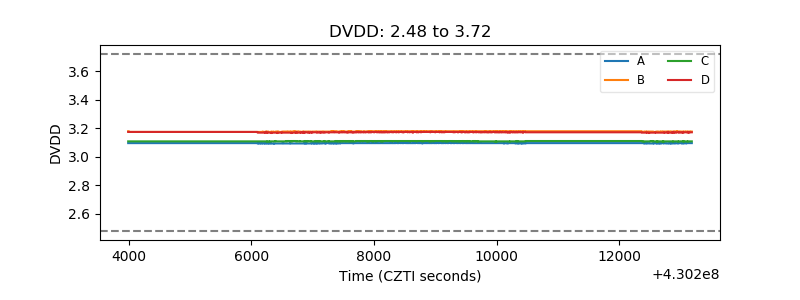 |
| Temperature 1 | 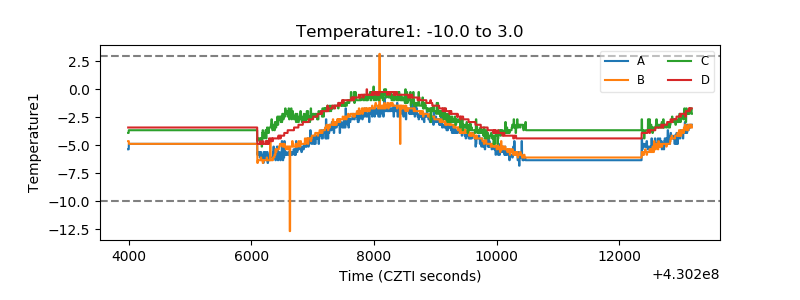 |
| Veto HV Monitor | 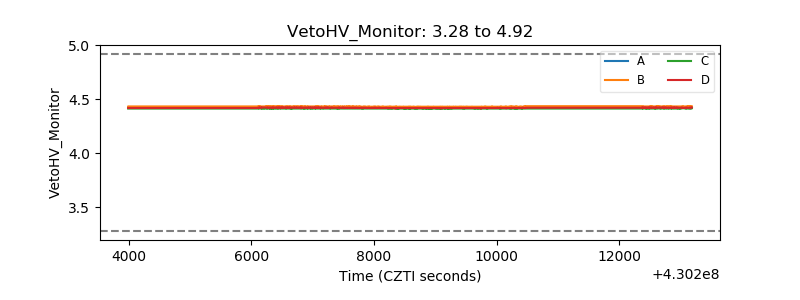 |
| Veto LLD | 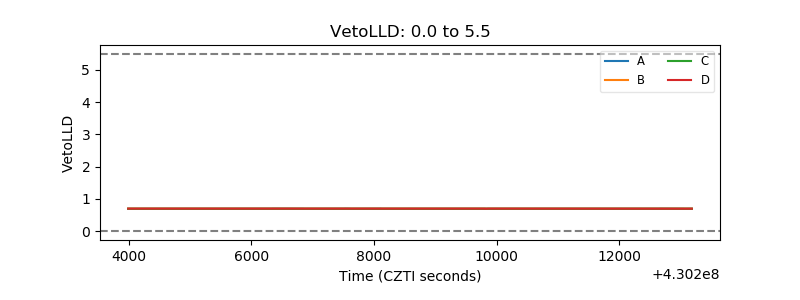 |
| Alpha Counter | 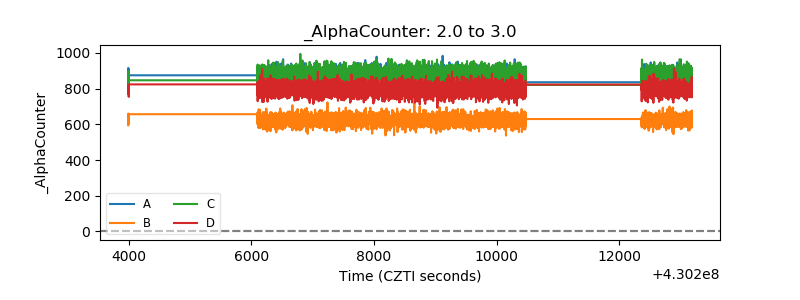 |
| _CPM_Rate | 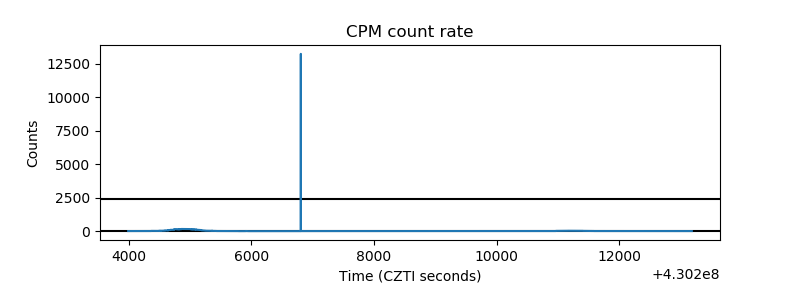 |
| CZT Counter | 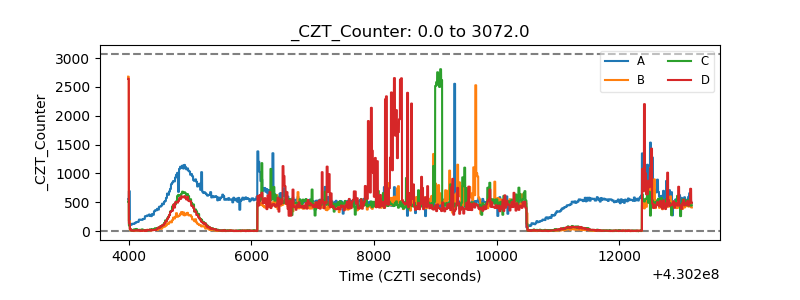 |
| +2.5 Volts monitor | 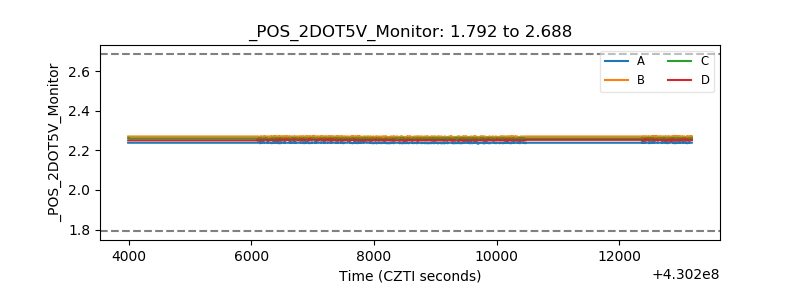 |
| +5 Volts monitor | 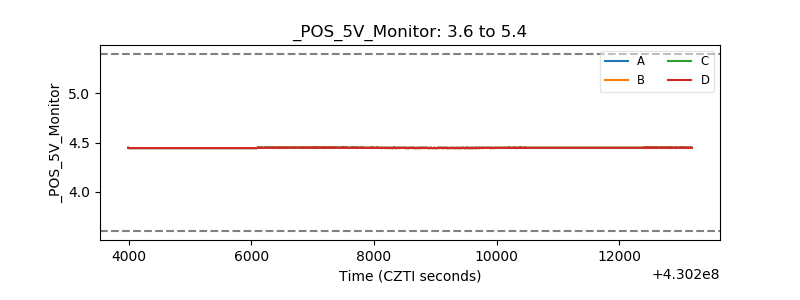 |
| _ROLL_ROT | 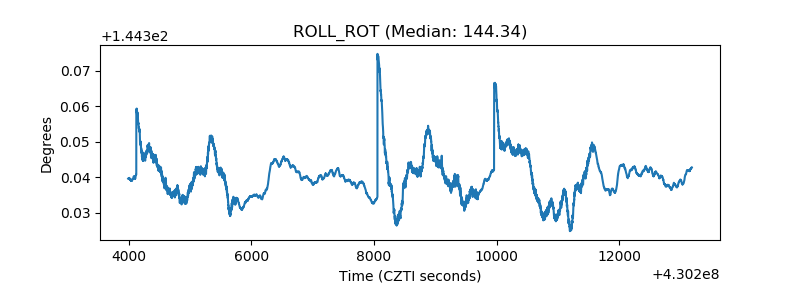 |
| _Roll_DEC | 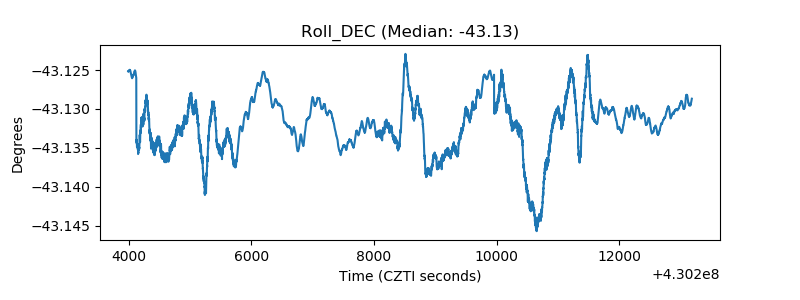 |
| _Roll_RA | 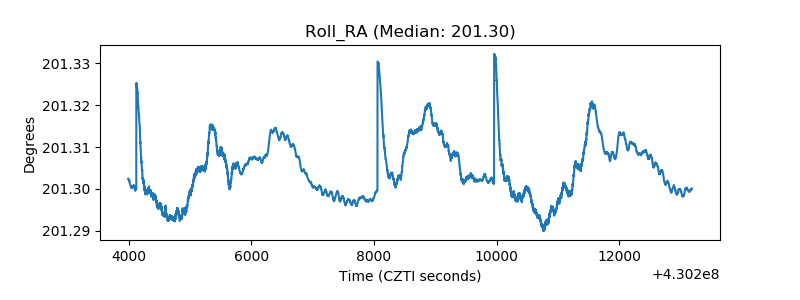 |
| Veto Counter | 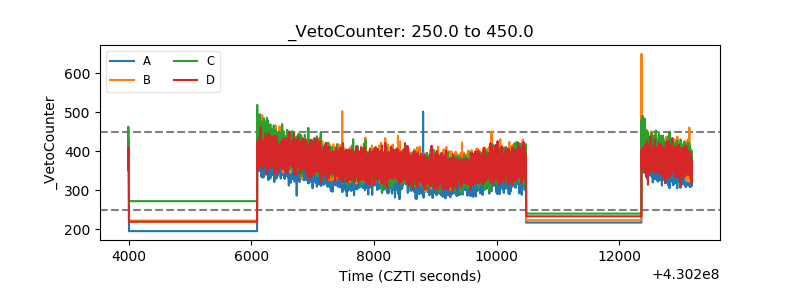 |