| Param | Original file | Final file |
|---|---|---|
| Filename | modeM0/AS1A05_013T01_9000005822_42681cztM0_level2.fits | modeM0/AS1A05_013T01_9000005822_42681cztM0_level2_quad_clean.evt |
| Size (bytes) | 360,417,600 | 95,676,480 |
| Size | 343.7 MB | 91.2 MB |
| Events in quadrant A | 3,301,134 | 640,321 |
| Events in quadrant B | 2,946,809 | 647,936 |
| Events in quadrant C | 2,825,809 | 630,883 |
| Events in quadrant D | 3,817,959 | 574,308 |
| Mode M0 | |||
|---|---|---|---|
| Quadrant | BADHDUFLAG | Total packets | Discarded packets |
| A | 0 | 13126 | 2 |
| B | 0 | 12651 | 2 |
| C | 0 | 11805 | 2 |
| D | 0 | 15281 | 2 |
| Mode M9 | |||
|---|---|---|---|
| Quadrant | BADHDUFLAG | Total packets | Discarded packets |
| A | 0 | 29 | 0 |
| B | 0 | 30 | 0 |
| C | 0 | 30 | 0 |
| D | 0 | 30 | 0 |
| Mode SS | |||
|---|---|---|---|
| Quadrant | BADHDUFLAG | Total packets | Discarded packets |
| A | 0 | 116 | 0 |
| B | 0 | 116 | 0 |
| C | 0 | 116 | 0 |
| D | 0 | 116 | 0 |
| Quadrant | Total seconds | Saturated seconds | Saturation percentage |
|---|---|---|---|
| A | 5778 | 55 | 0.951886% |
| B | 5778 | 50 | 0.865351% |
| C | 5778 | 3 | 0.051921% |
| D | 5778 | 160 | 2.769124% |
Noise dominated data is calculated using 1-second bins in cleaned event files. If a bin has >2000 counts, and if more than 50% of those come from <1% of pixels, then it is considered to be noise-dominated and hence unusable.
| Quadrant | # 1 sec bins | Bins with >0 counts | Bins with >2000 counts | High rate bins dominated by noise | Noise dominated (total time) | Noise dominated (detector-on time) | Marked lightcurve |
|---|---|---|---|---|---|---|---|
| A | 7331 | 5779 | 36 | 36 | 0.49% | 0.62% | 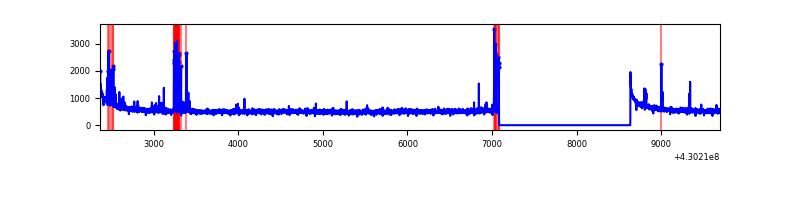 |
| B | 7331 | 5779 | 45 | 45 | 0.61% | 0.78% | 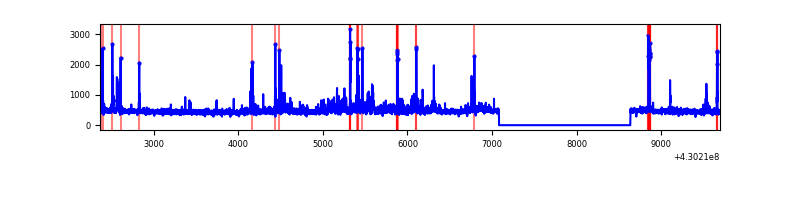 |
| C | 7331 | 5779 | 1 | 1 | 0.01% | 0.02% | 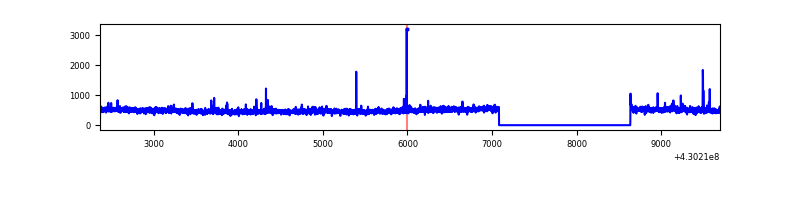 |
| D | 7331 | 5779 | 143 | 143 | 1.95% | 2.47% | 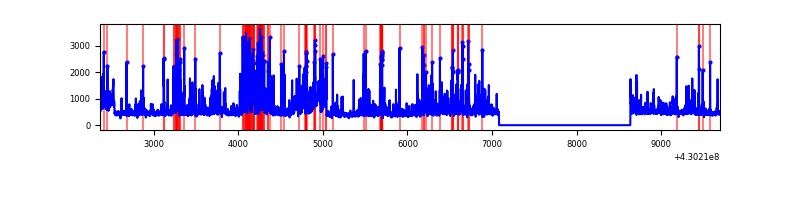 |
Top three noisy pixels from each quadrant. If the there are fewer than three noisy pixels in the level2.evt file, extra rows are filled as -1
| Pixel properties | Quadrant properties | ||||||
|---|---|---|---|---|---|---|---|
| Quadrant | DetID | PixID | Counts | Sigma | Mean | Median | Sigma |
| A | 10 | 83 | 617082 | 4755.51 | 634 | 621 | 129.6 |
| A | 13 | 248 | 192995 | 1484.01 | 634 | 621 | 129.6 |
| A | 7 | 3 | 15655 | 115.98 | 634 | 621 | 129.6 |
| B | 0 | 245 | 241943 | 1971.78 | 624 | 607 | 122.4 |
| B | 5 | 255 | 90109 | 731.26 | 624 | 607 | 122.4 |
| B | 4 | 141 | 55813 | 451.05 | 624 | 607 | 122.4 |
| C | 15 | 214 | 243968 | 1687.88 | 616 | 619 | 144.2 |
| C | 3 | 233 | 76972 | 529.59 | 616 | 619 | 144.2 |
| C | 8 | 79 | 76264 | 524.68 | 616 | 619 | 144.2 |
| D | 2 | 249 | 775081 | 5113.5 | 617 | 599 | 151.5 |
| D | 13 | 249 | 230651 | 1518.91 | 617 | 599 | 151.5 |
| D | 1 | 52 | 227325 | 1496.95 | 617 | 599 | 151.5 |
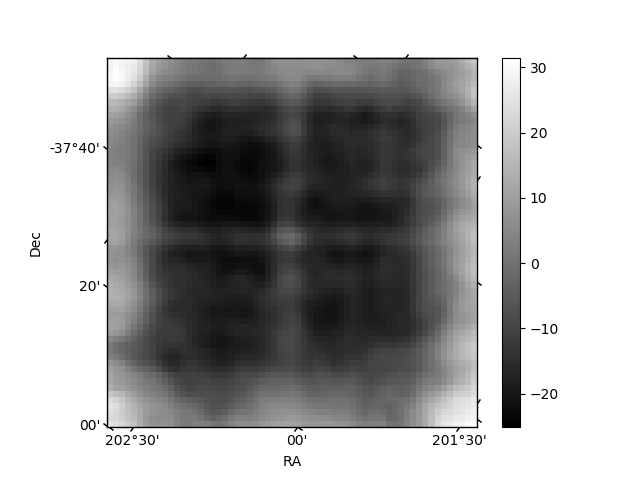
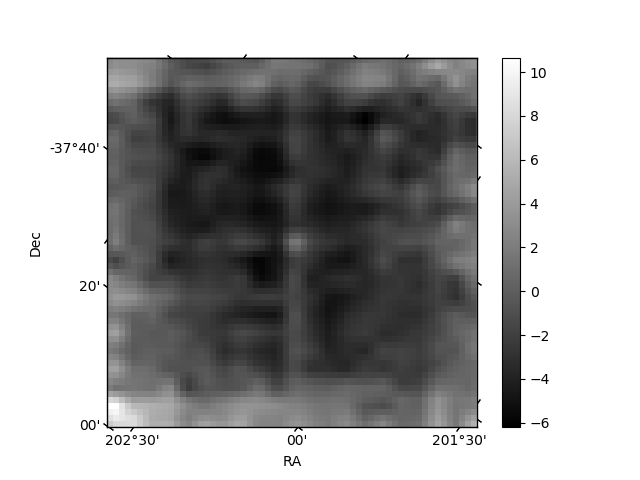
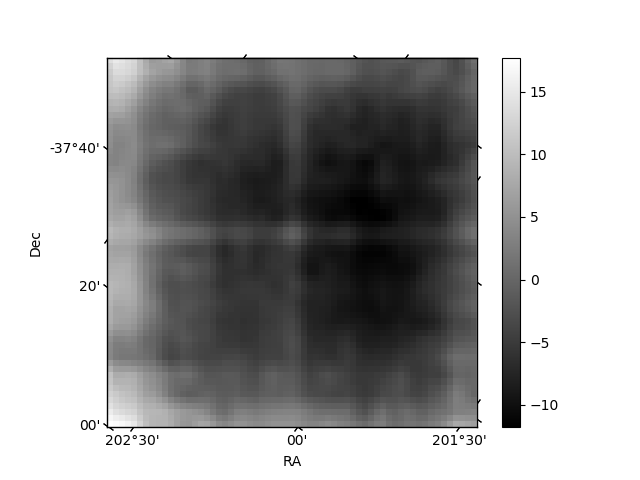
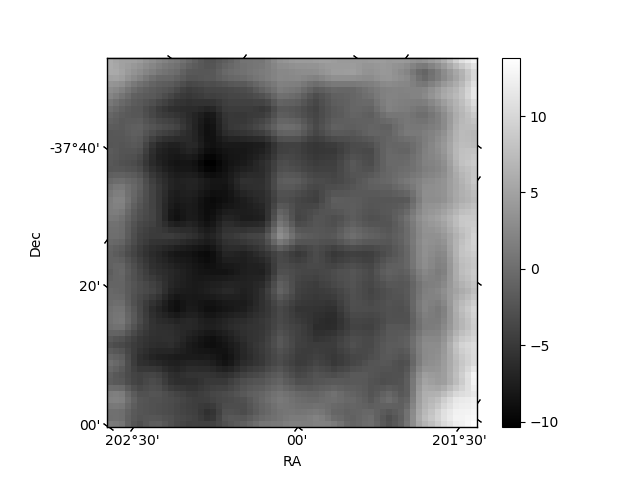
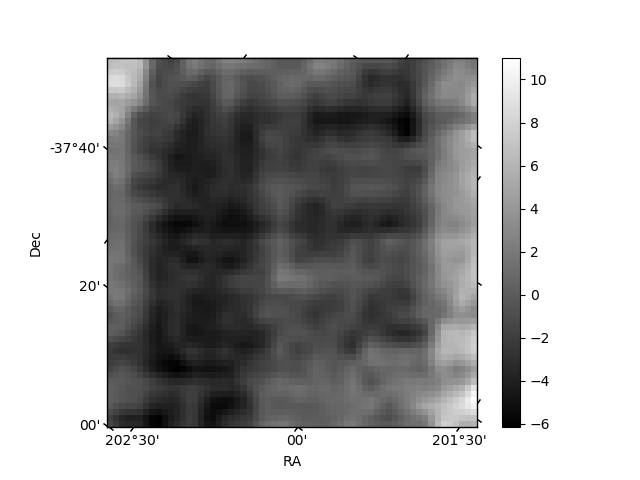
Histogram calculated using DETX and DETY for each event in the final _common_clean file
| Quadrant A | 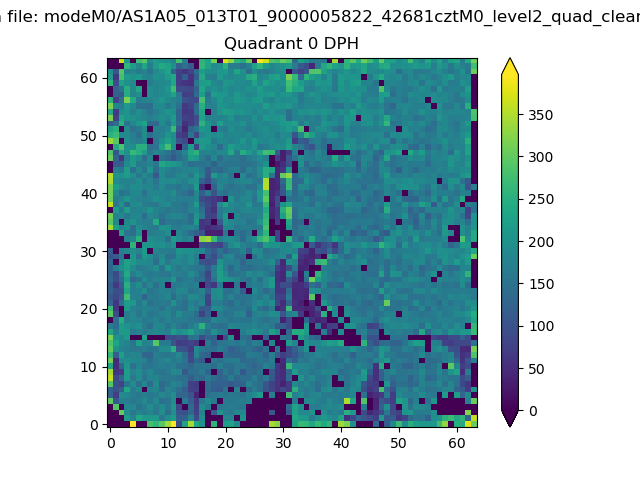 |
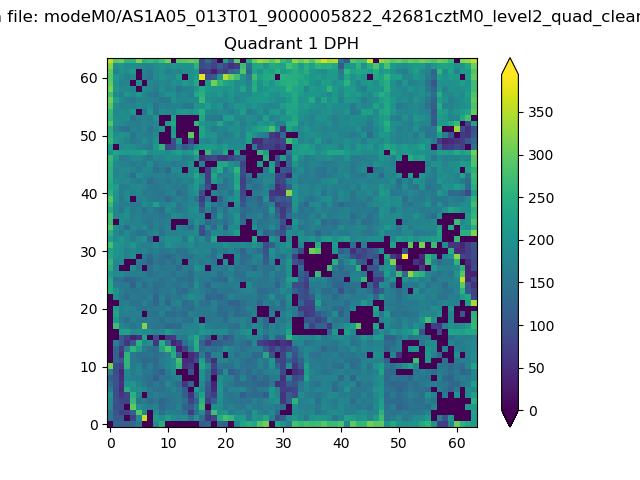 |
Quadrant B |
|---|---|---|---|
| Quadrant D | 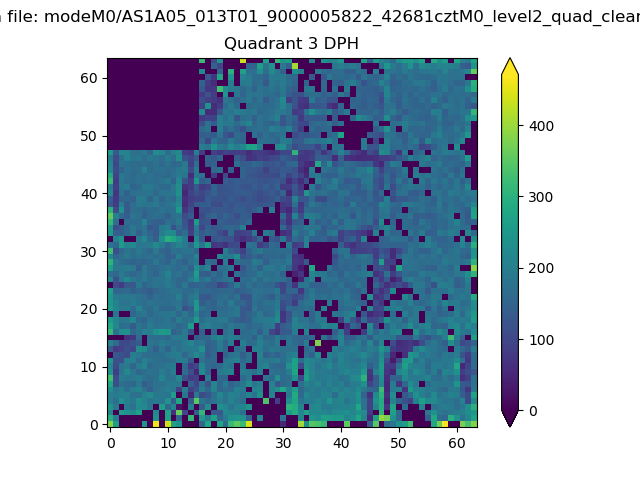 |
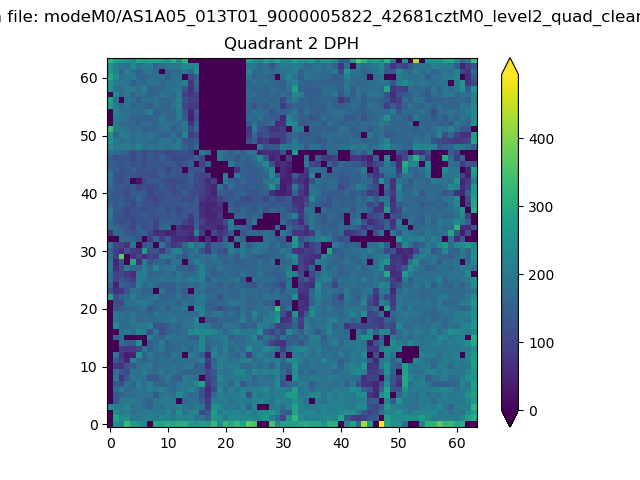 |
Quadrant C |
| Plot type | Count rate plots | Images |
|---|---|---|
| Comparison with Poisson distribution Blue bars denote a histogram of data divided into 1 sec bins. Red curve is a Poisson curve with rate = median count rate of data. |
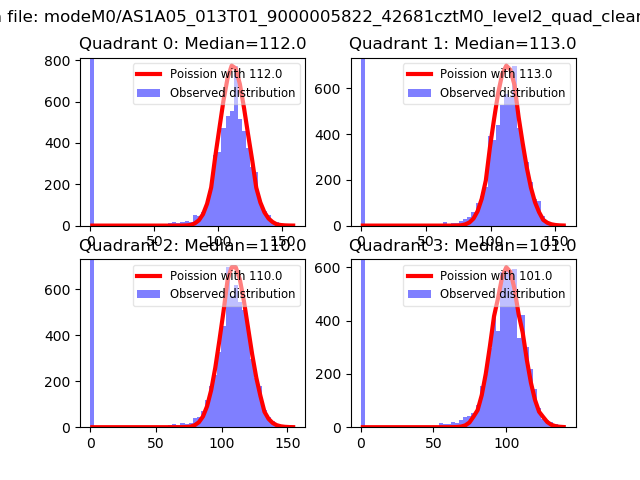 |
 |
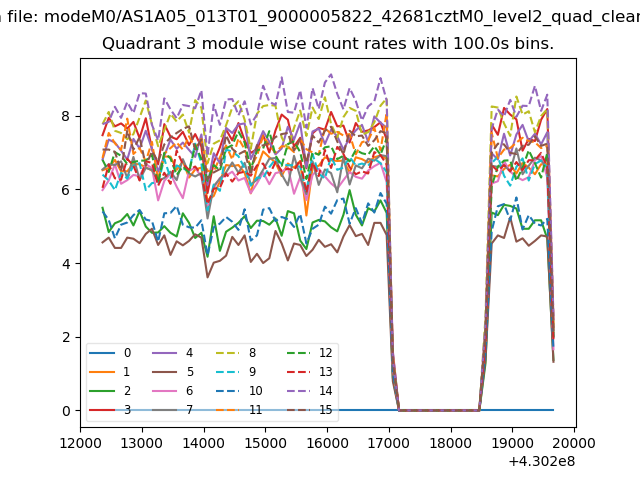
| Quadrant-wise count rates Data is divided into 100 sec bins |
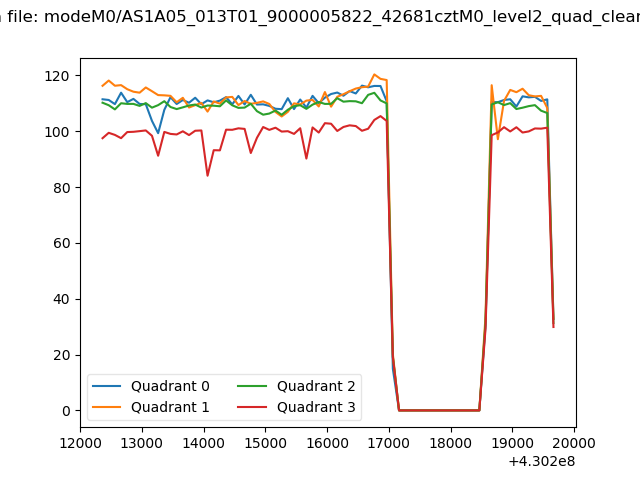 |
|
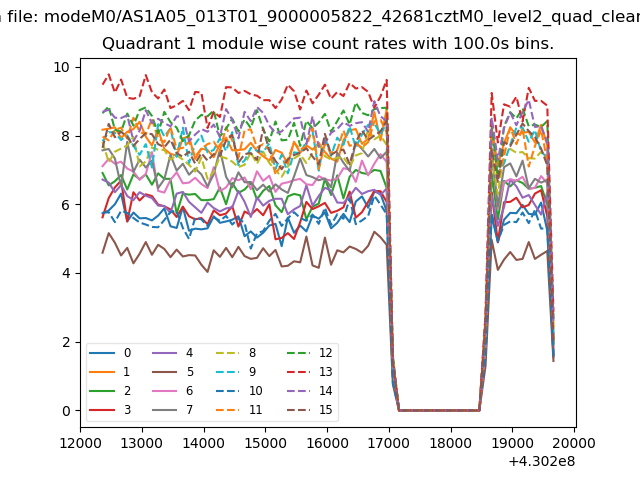
| Module-wise count rates for Quadrant A Data is divided into 100 sec bins |
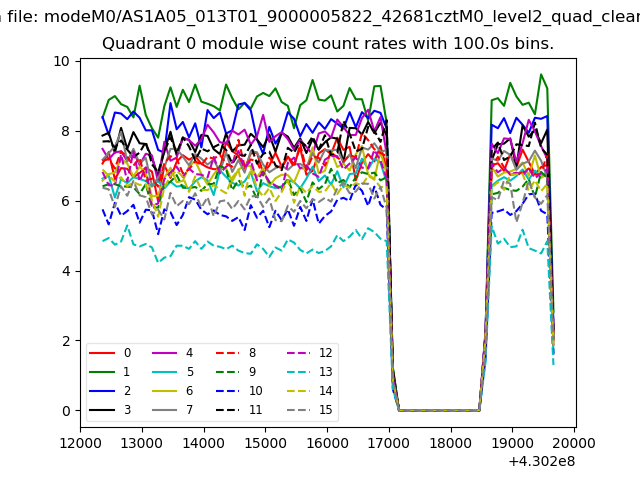 |
 |
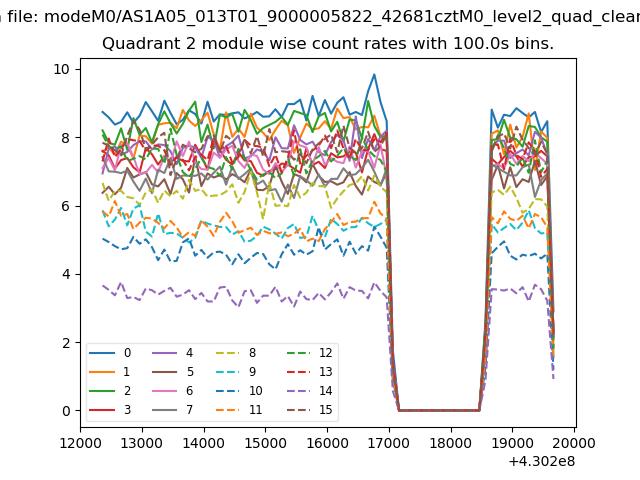
| Module-wise count rates for Quadrant B Data is divided into 100 sec bins |
 |
 |
| Module-wise count rates for Quadrant C Data is divided into 100 sec bins |
 |
 |
| Module-wise count rates for Quadrant D Data is divided into 100 sec bins |
 |
 |
| Parameter | Plot |
|---|---|
| CZT HV Monitor | 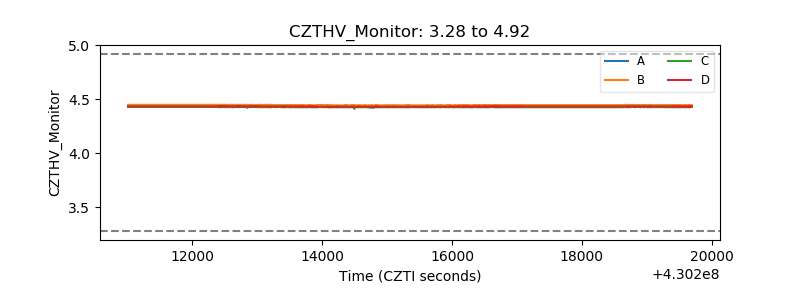 |
| D_VDD | 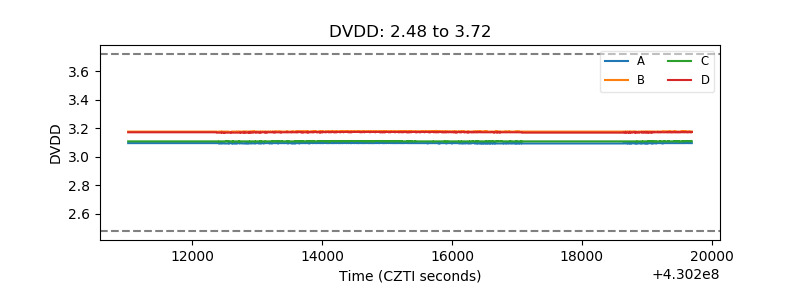 |
| Temperature 1 | 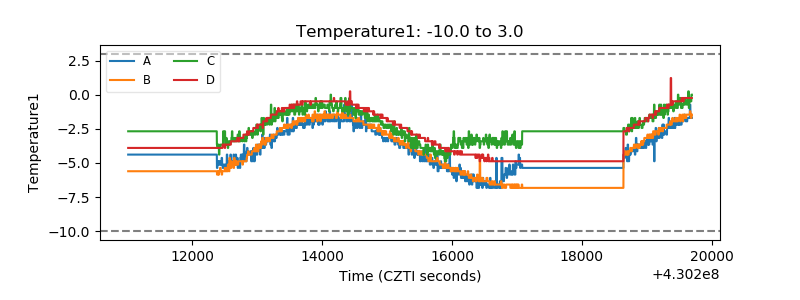 |
| Veto HV Monitor | 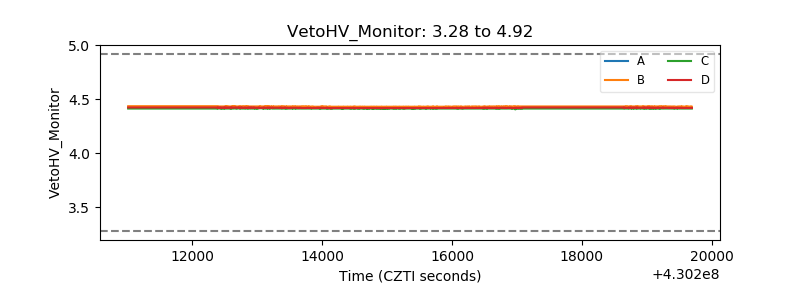 |
| Veto LLD | 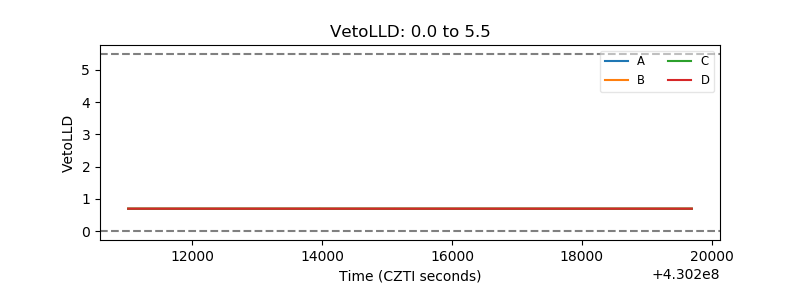 |
| Alpha Counter | 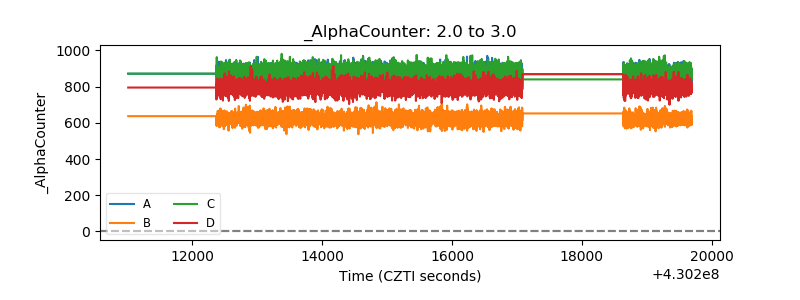 |
| _CPM_Rate | 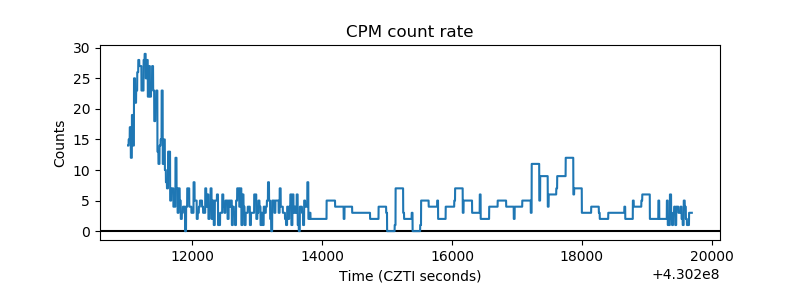 |
| CZT Counter | 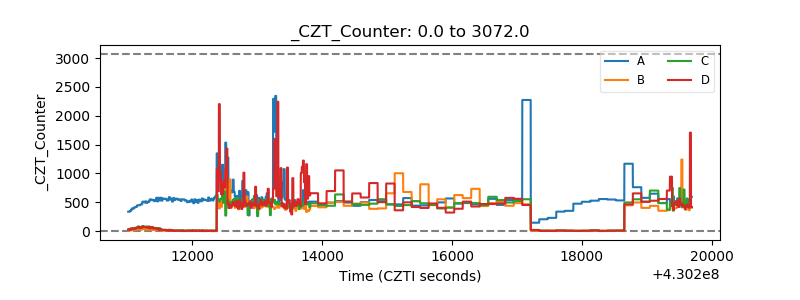 |
| +2.5 Volts monitor | 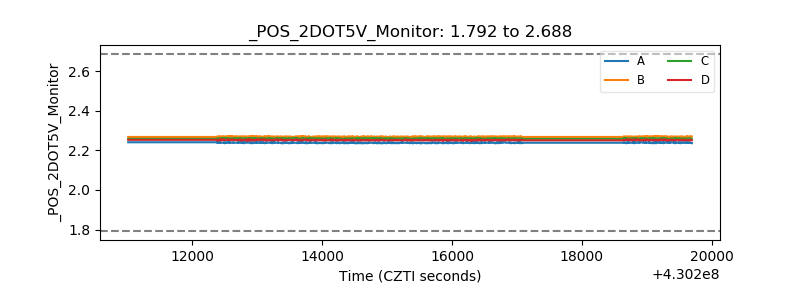 |
| +5 Volts monitor |  |
| _ROLL_ROT | 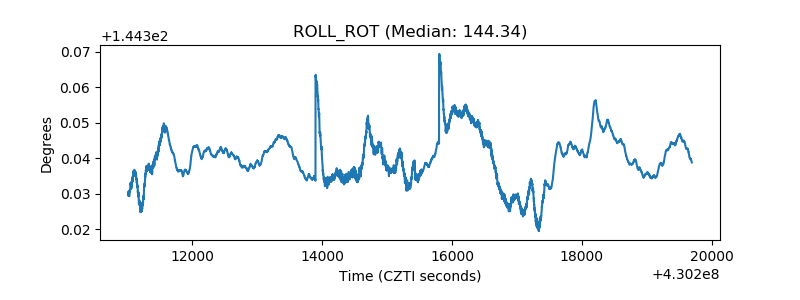 |
| _Roll_DEC | 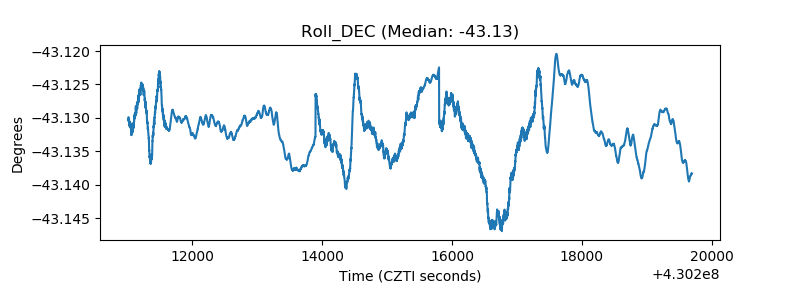 |
| _Roll_RA | 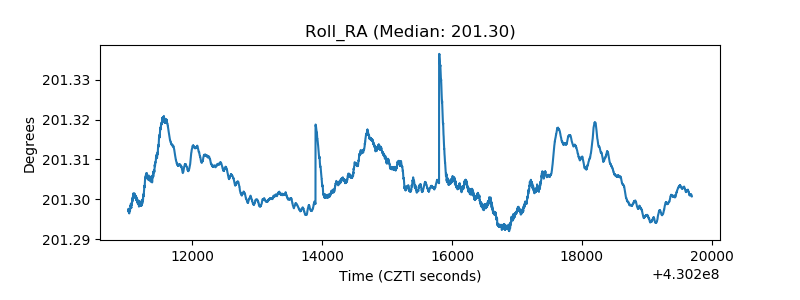 |
| Veto Counter |  |