| Param | Original file | Final file |
|---|---|---|
| Filename | modeM0/AS1A05_013T01_9000005822_42682cztM0_level2.fits | modeM0/AS1A05_013T01_9000005822_42682cztM0_level2_quad_clean.evt |
| Size (bytes) | 394,067,520 | 93,686,400 |
| Size | 375.8 MB | 89.3 MB |
| Events in quadrant A | 3,303,382 | 634,500 |
| Events in quadrant B | 2,740,327 | 644,659 |
| Events in quadrant C | 3,468,031 | 615,562 |
| Events in quadrant D | 4,622,641 | 535,497 |
| Mode M0 | |||
|---|---|---|---|
| Quadrant | BADHDUFLAG | Total packets | Discarded packets |
| A | 0 | 13150 | 1 |
| B | 0 | 12164 | 1 |
| C | 0 | 13968 | 1 |
| D | 0 | 17685 | 1 |
| Mode M9 | |||
|---|---|---|---|
| Quadrant | BADHDUFLAG | Total packets | Discarded packets |
| A | 0 | 13 | 0 |
| B | 0 | 13 | 0 |
| C | 0 | 13 | 0 |
| D | 0 | 13 | 0 |
| Mode SS | |||
|---|---|---|---|
| Quadrant | BADHDUFLAG | Total packets | Discarded packets |
| A | 0 | 118 | 0 |
| B | 0 | 118 | 0 |
| C | 0 | 118 | 0 |
| D | 0 | 118 | 0 |
| Quadrant | Total seconds | Saturated seconds | Saturation percentage |
|---|---|---|---|
| A | 5817 | 91 | 1.564380% |
| B | 5818 | 33 | 0.567205% |
| C | 5818 | 120 | 2.062564% |
| D | 5818 | 538 | 9.247164% |
Noise dominated data is calculated using 1-second bins in cleaned event files. If a bin has >2000 counts, and if more than 50% of those come from <1% of pixels, then it is considered to be noise-dominated and hence unusable.
| Quadrant | # 1 sec bins | Bins with >0 counts | Bins with >2000 counts | High rate bins dominated by noise | Noise dominated (total time) | Noise dominated (detector-on time) | Marked lightcurve |
|---|---|---|---|---|---|---|---|
| A | 7130 | 5818 | 66 | 66 | 0.93% | 1.13% | 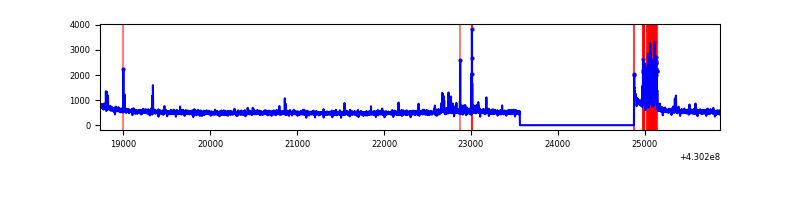 |
| B | 7131 | 5819 | 27 | 27 | 0.38% | 0.46% | 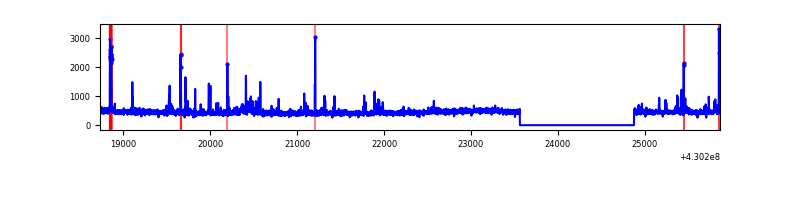 |
| C | 7131 | 5819 | 98 | 98 | 1.37% | 1.68% | 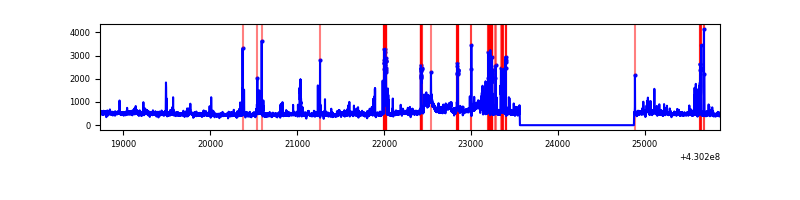 |
| D | 7131 | 5819 | 530 | 530 | 7.43% | 9.11% | 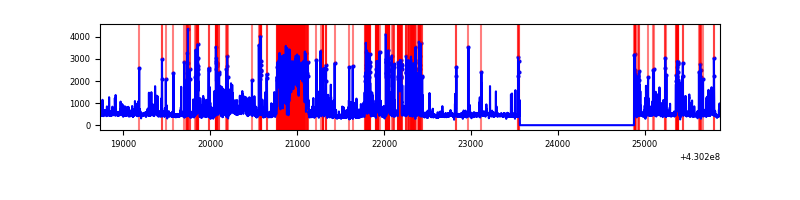 |
Top three noisy pixels from each quadrant. If the there are fewer than three noisy pixels in the level2.evt file, extra rows are filled as -1
| Pixel properties | Quadrant properties | ||||||
|---|---|---|---|---|---|---|---|
| Quadrant | DetID | PixID | Counts | Sigma | Mean | Median | Sigma |
| A | 10 | 83 | 577194 | 4406.83 | 635 | 622 | 130.8 |
| A | 13 | 248 | 230314 | 1755.57 | 635 | 622 | 130.8 |
| A | 15 | 237 | 16474 | 121.16 | 635 | 622 | 130.8 |
| B | 0 | 245 | 75235 | 610.92 | 628 | 610 | 122.2 |
| B | 5 | 172 | 46909 | 379.03 | 628 | 610 | 122.2 |
| B | 5 | 255 | 41902 | 338.04 | 628 | 610 | 122.2 |
| C | 8 | 79 | 497752 | 3449.53 | 614 | 617 | 144.1 |
| C | 15 | 214 | 244279 | 1690.73 | 614 | 617 | 144.1 |
| C | 14 | 254 | 183474 | 1268.81 | 614 | 617 | 144.1 |
| D | 1 | 52 | 869217 | 5918.59 | 599 | 580 | 146.8 |
| D | 12 | 233 | 801675 | 5458.38 | 599 | 580 | 146.8 |
| D | 2 | 249 | 393112 | 2674.57 | 599 | 580 | 146.8 |
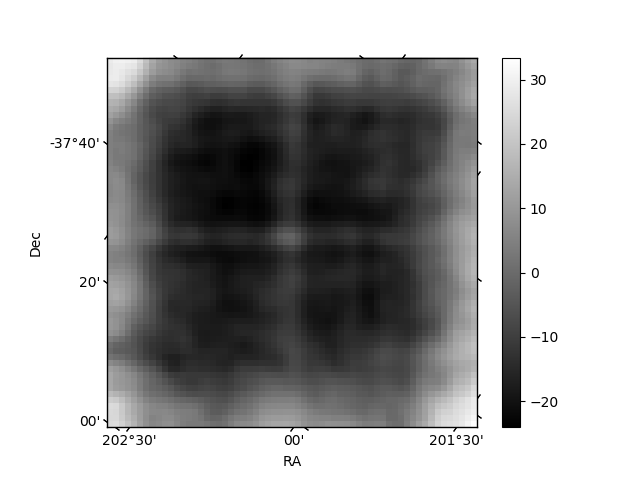
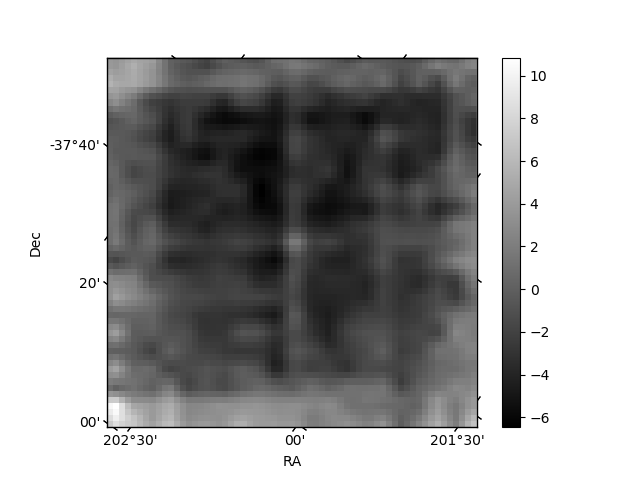
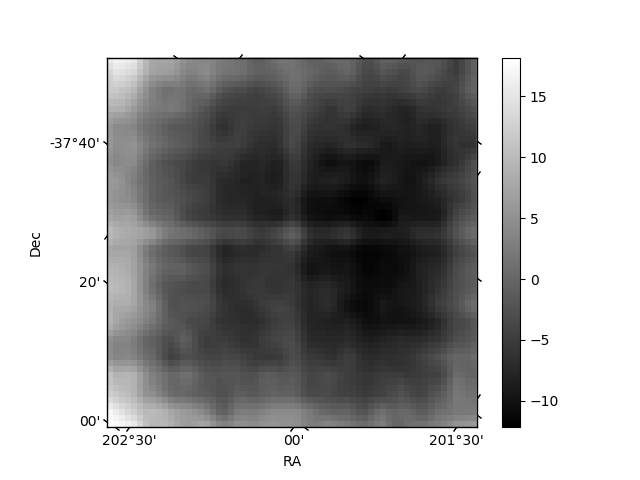
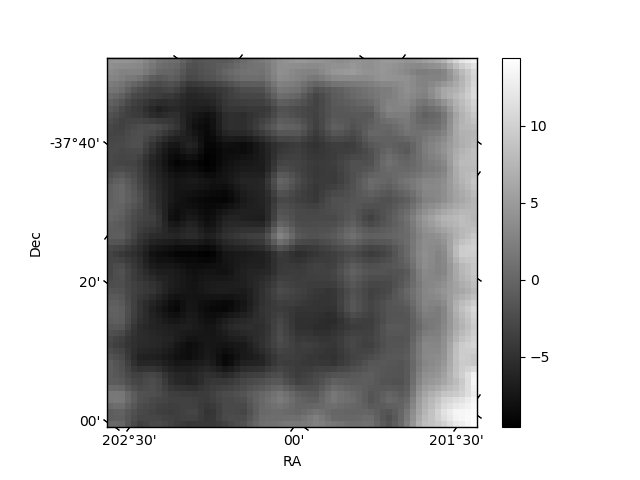
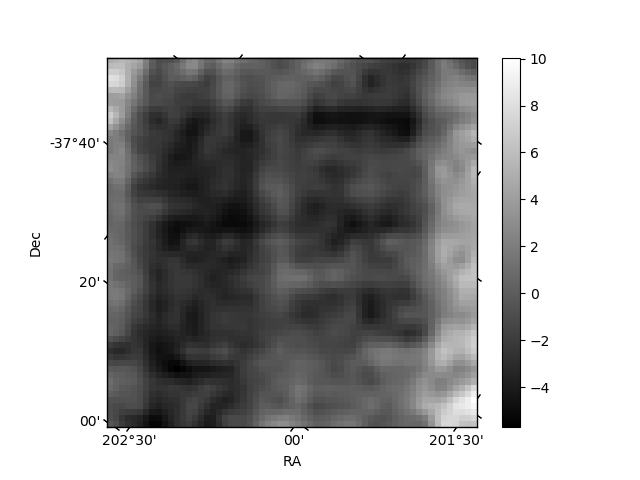
Histogram calculated using DETX and DETY for each event in the final _common_clean file
| Quadrant A | 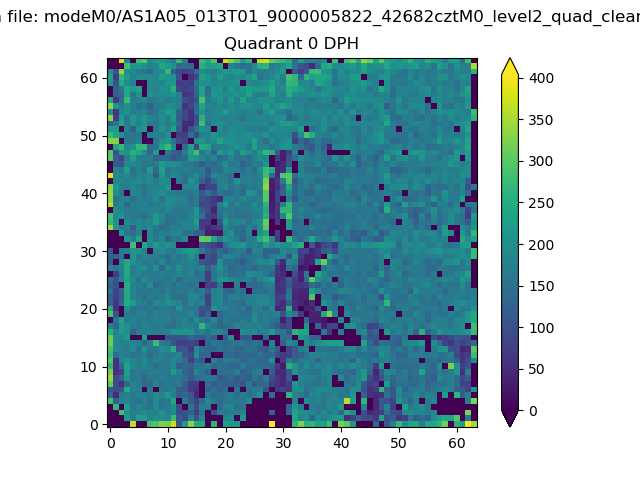 |
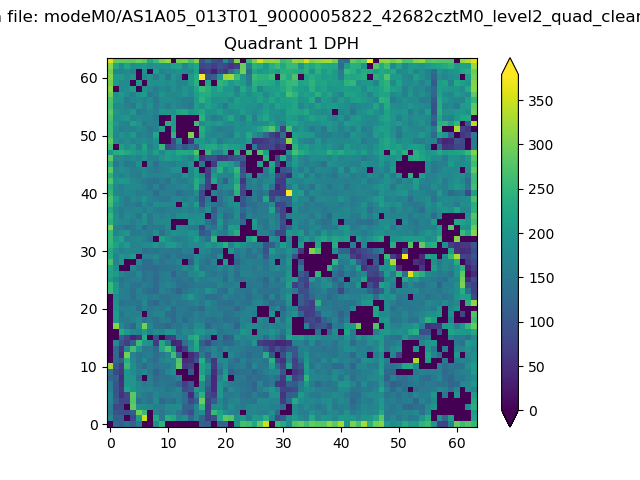 |
Quadrant B |
|---|---|---|---|
| Quadrant D | 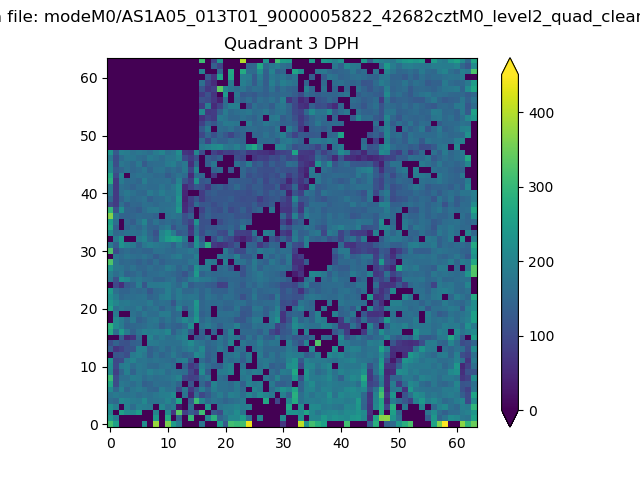 |
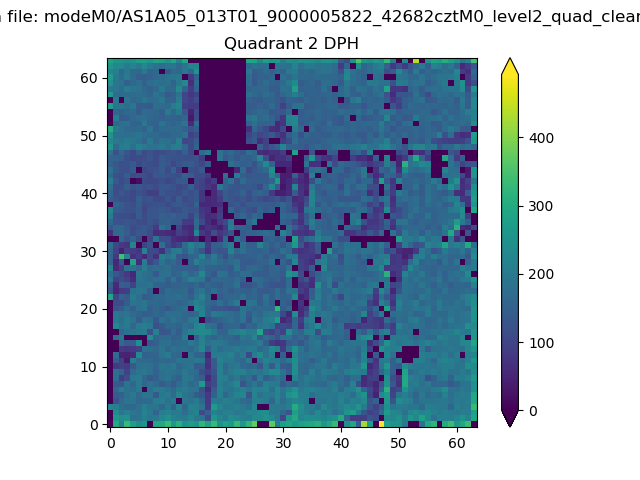 |
Quadrant C |
| Plot type | Count rate plots | Images |
|---|---|---|
| Comparison with Poisson distribution Blue bars denote a histogram of data divided into 1 sec bins. Red curve is a Poisson curve with rate = median count rate of data. |
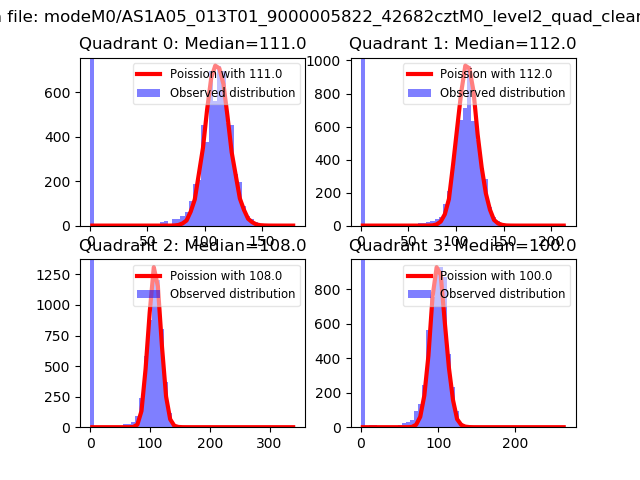 |
 |
| Quadrant-wise count rates Data is divided into 100 sec bins |
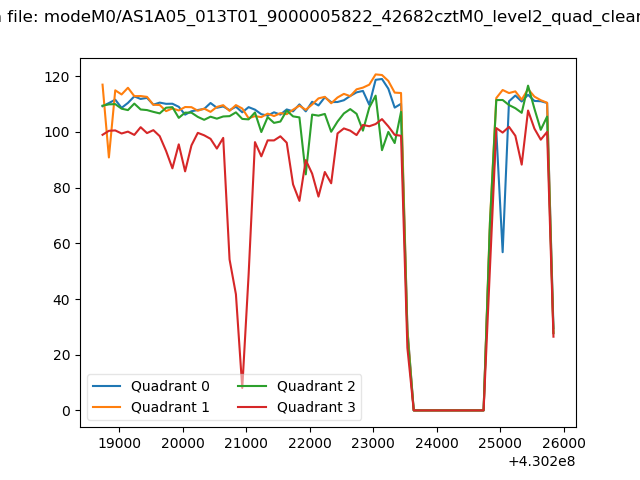 |
|
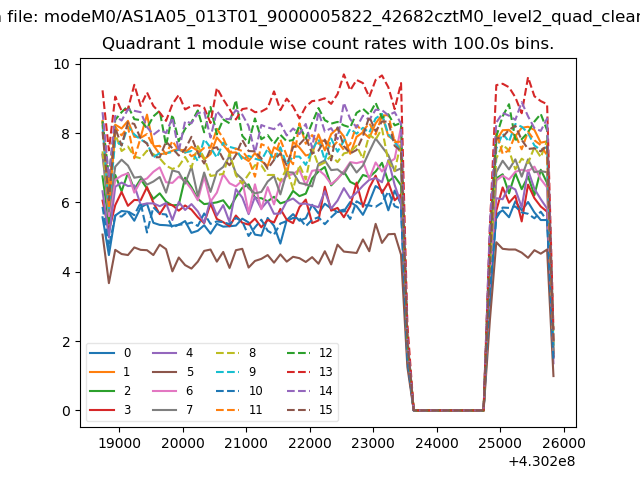
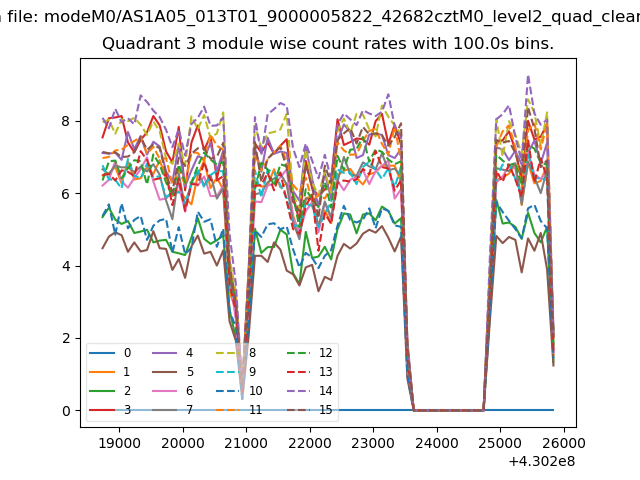
| Module-wise count rates for Quadrant A Data is divided into 100 sec bins |
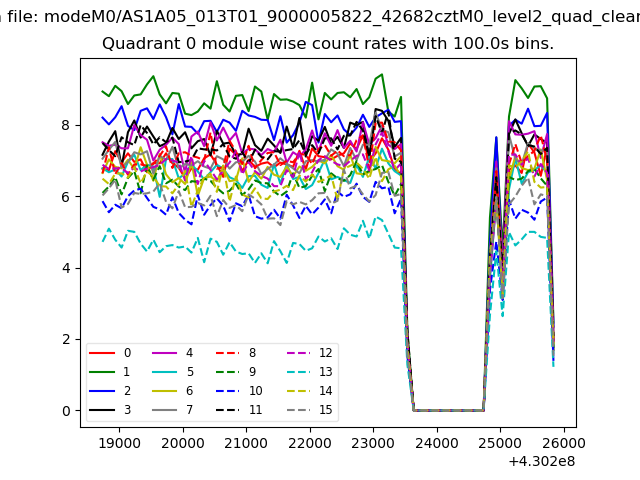 |
 |
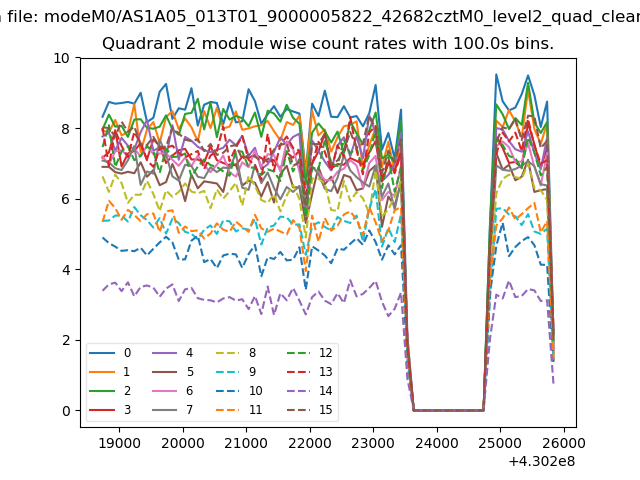
| Module-wise count rates for Quadrant B Data is divided into 100 sec bins |
 |
 |
| Module-wise count rates for Quadrant C Data is divided into 100 sec bins |
 |
 |
| Module-wise count rates for Quadrant D Data is divided into 100 sec bins |
 |
 |
| Parameter | Plot |
|---|---|
| CZT HV Monitor |  |
| D_VDD | 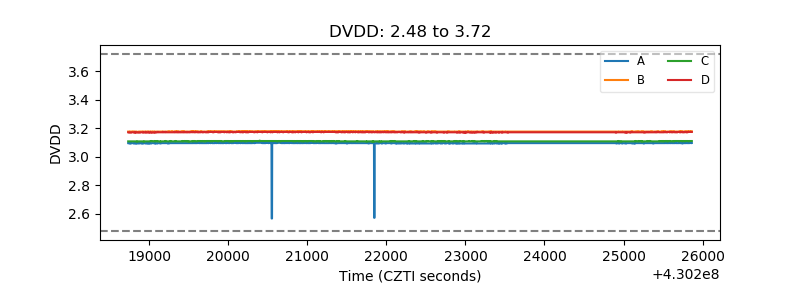 |
| Temperature 1 | 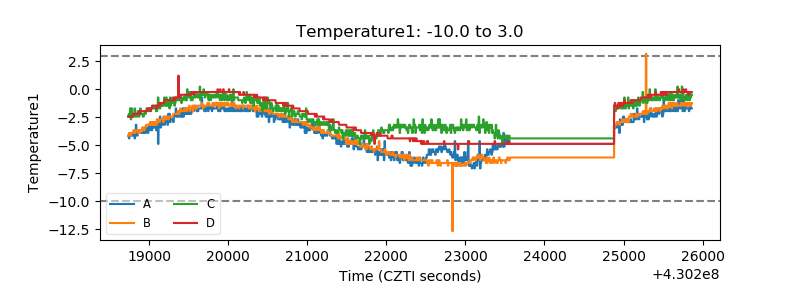 |
| Veto HV Monitor | 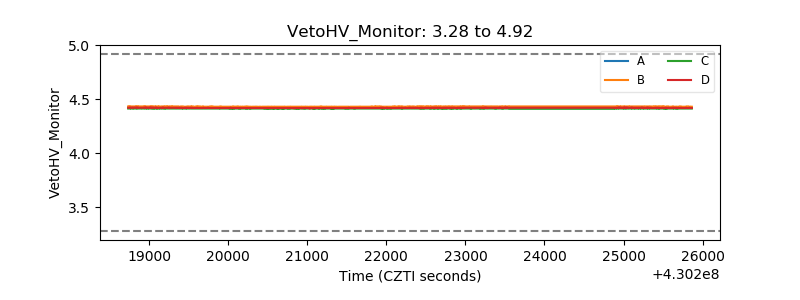 |
| Veto LLD | 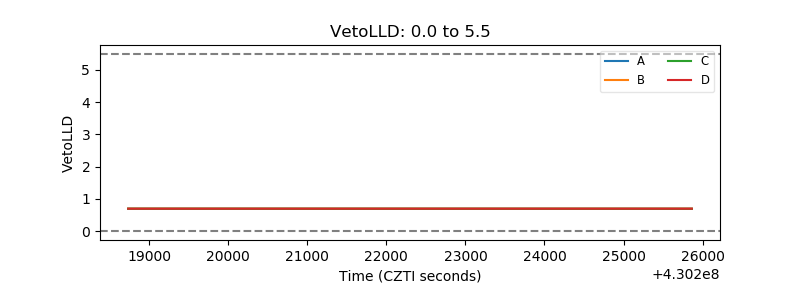 |
| Alpha Counter | 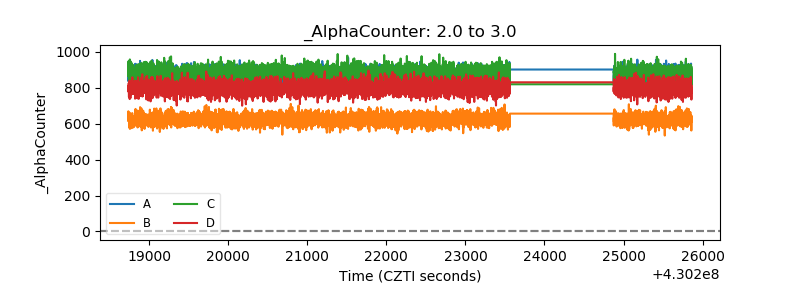 |
| _CPM_Rate | 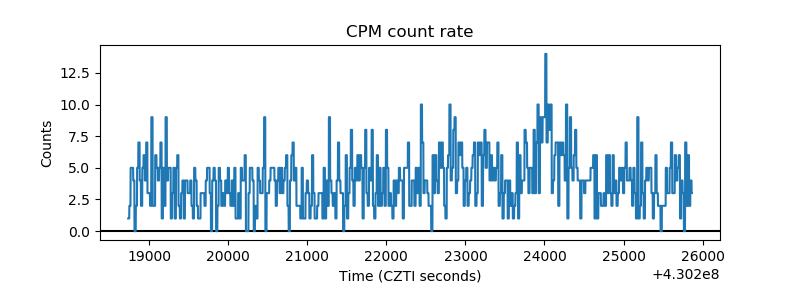 |
| CZT Counter | 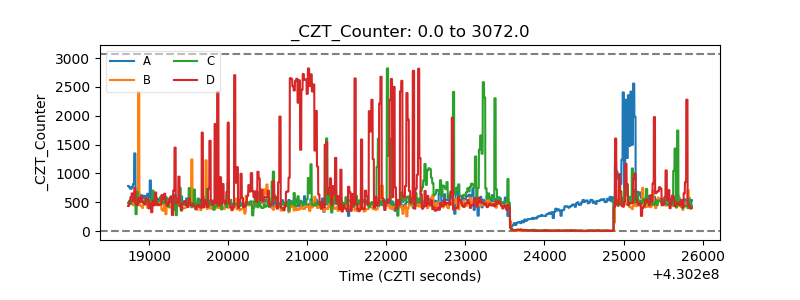 |
| +2.5 Volts monitor | 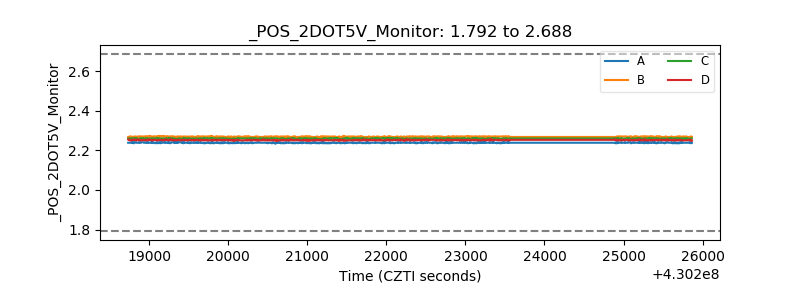 |
| +5 Volts monitor |  |
| _ROLL_ROT | 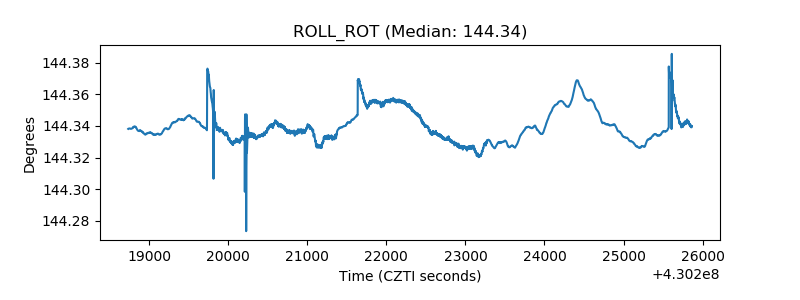 |
| _Roll_DEC | 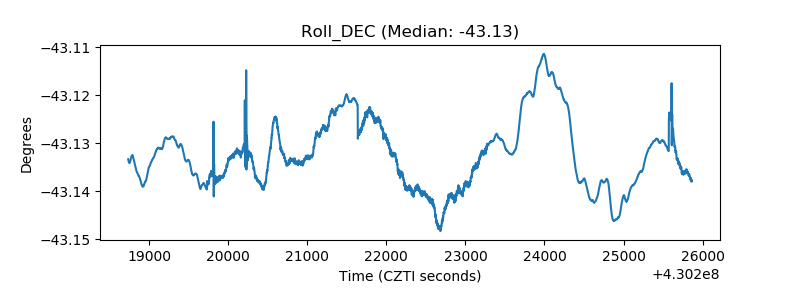 |
| _Roll_RA | 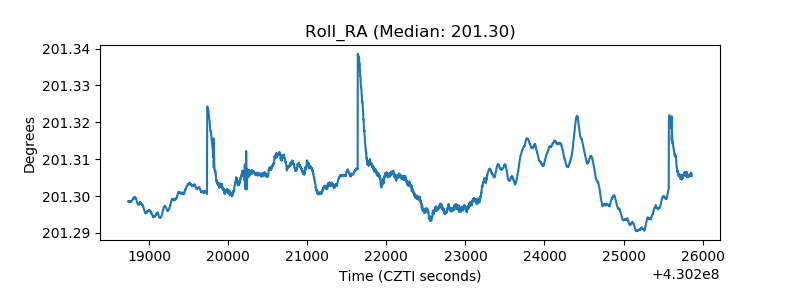 |
| Veto Counter |  |