| Param | Original file | Final file |
|---|---|---|
| Filename | modeM0/AS1A05_013T01_9000005822_42683cztM0_level2.fits | modeM0/AS1A05_013T01_9000005822_42683cztM0_level2_quad_clean.evt |
| Size (bytes) | 386,778,240 | 97,842,240 |
| Size | 368.9 MB | 93.3 MB |
| Events in quadrant A | 3,427,744 | 658,325 |
| Events in quadrant B | 2,979,015 | 668,083 |
| Events in quadrant C | 3,095,401 | 643,722 |
| Events in quadrant D | 4,344,748 | 570,456 |
| Mode M0 | |||
|---|---|---|---|
| Quadrant | BADHDUFLAG | Total packets | Discarded packets |
| A | 0 | 13647 | 2 |
| B | 0 | 12907 | 2 |
| C | 0 | 13071 | 2 |
| D | 0 | 17124 | 2 |
| Mode M9 | |||
|---|---|---|---|
| Quadrant | BADHDUFLAG | Total packets | Discarded packets |
| A | 0 | 13 | 0 |
| B | 0 | 13 | 0 |
| C | 0 | 13 | 0 |
| D | 0 | 13 | 0 |
| Mode SS | |||
|---|---|---|---|
| Quadrant | BADHDUFLAG | Total packets | Discarded packets |
| A | 0 | 122 | 0 |
| B | 0 | 122 | 0 |
| C | 0 | 122 | 0 |
| D | 0 | 122 | 0 |
| Quadrant | Total seconds | Saturated seconds | Saturation percentage |
|---|---|---|---|
| A | 6042 | 88 | 1.456471% |
| B | 6043 | 40 | 0.661923% |
| C | 6043 | 37 | 0.612279% |
| D | 6043 | 402 | 6.652325% |
Noise dominated data is calculated using 1-second bins in cleaned event files. If a bin has >2000 counts, and if more than 50% of those come from <1% of pixels, then it is considered to be noise-dominated and hence unusable.
| Quadrant | # 1 sec bins | Bins with >0 counts | Bins with >2000 counts | High rate bins dominated by noise | Noise dominated (total time) | Noise dominated (detector-on time) | Marked lightcurve |
|---|---|---|---|---|---|---|---|
| A | 7326 | 6043 | 67 | 67 | 0.91% | 1.11% | 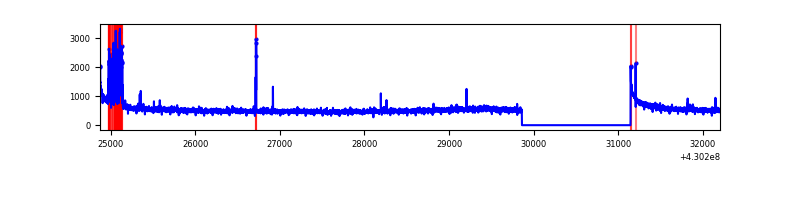 |
| B | 7327 | 6044 | 29 | 29 | 0.40% | 0.48% | 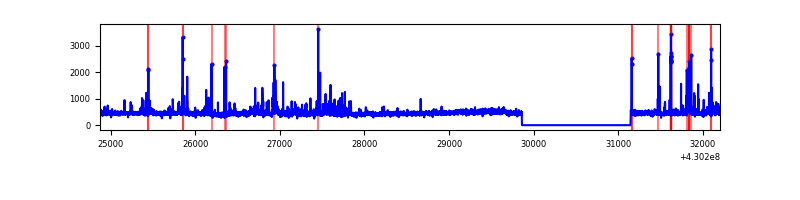 |
| C | 7327 | 6044 | 33 | 33 | 0.45% | 0.55% | 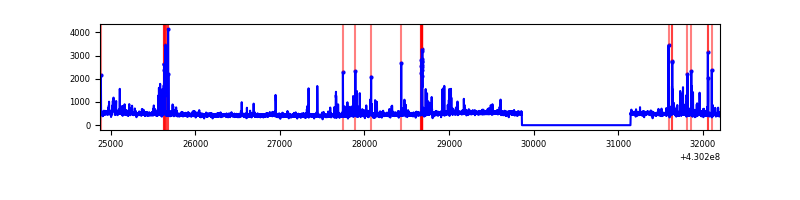 |
| D | 7327 | 6044 | 327 | 327 | 4.46% | 5.41% | 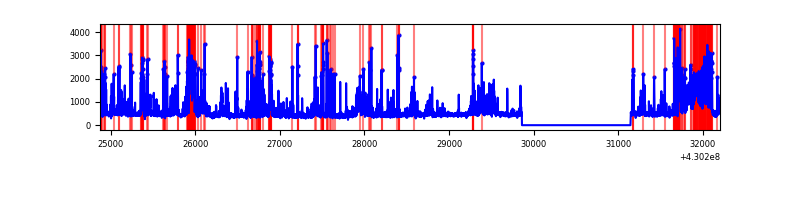 |
Top three noisy pixels from each quadrant. If the there are fewer than three noisy pixels in the level2.evt file, extra rows are filled as -1
| Pixel properties | Quadrant properties | ||||||
|---|---|---|---|---|---|---|---|
| Quadrant | DetID | PixID | Counts | Sigma | Mean | Median | Sigma |
| A | 10 | 83 | 651670 | 4786.69 | 660 | 646 | 136.0 |
| A | 13 | 248 | 192421 | 1410.04 | 660 | 646 | 136.0 |
| A | 15 | 223 | 13287 | 92.94 | 660 | 646 | 136.0 |
| B | 0 | 245 | 161921 | 1279.4 | 651 | 633 | 126.1 |
| B | 4 | 141 | 89292 | 703.28 | 651 | 633 | 126.1 |
| B | 10 | 246 | 42509 | 332.18 | 651 | 633 | 126.1 |
| C | 14 | 254 | 252728 | 1682.68 | 639 | 644 | 149.8 |
| C | 15 | 214 | 252224 | 1679.32 | 639 | 644 | 149.8 |
| C | 3 | 233 | 47209 | 310.83 | 639 | 644 | 149.8 |
| D | 2 | 249 | 653187 | 4235.72 | 625 | 605 | 154.1 |
| D | 1 | 52 | 557134 | 3612.27 | 625 | 605 | 154.1 |
| D | 1 | 47 | 496074 | 3215.94 | 625 | 605 | 154.1 |
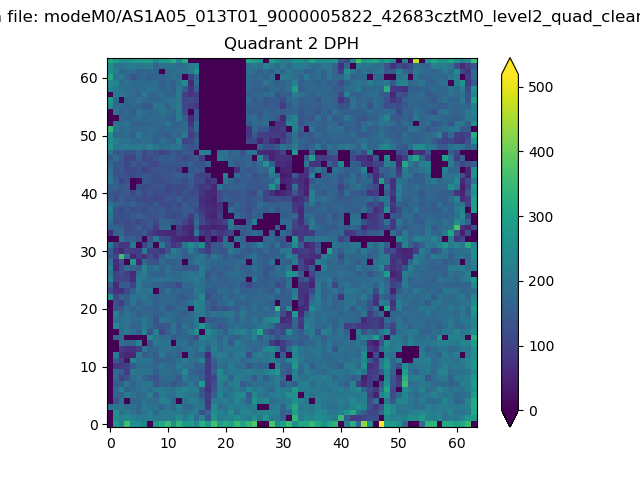
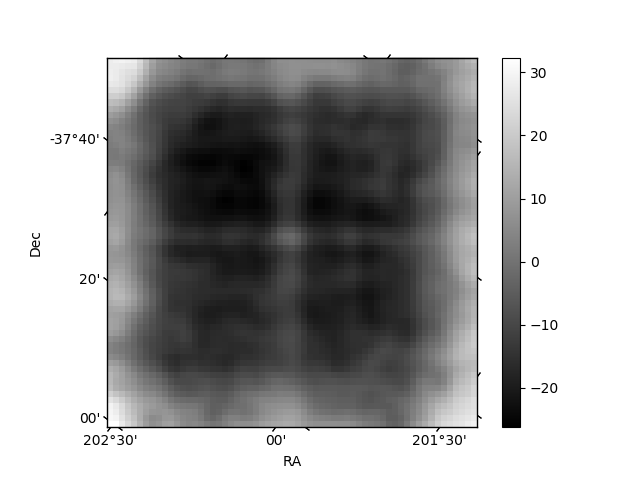
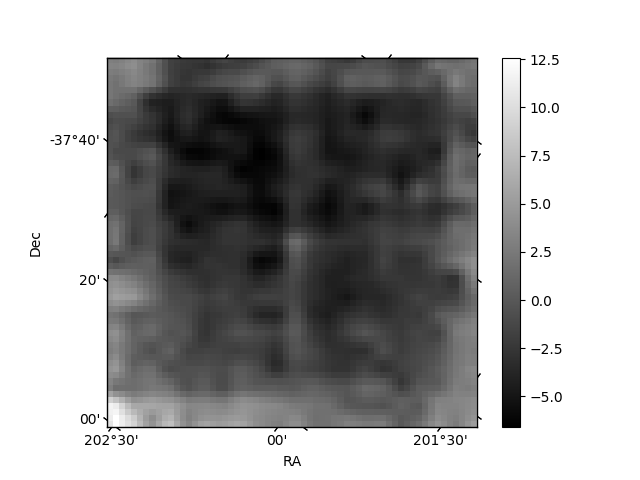
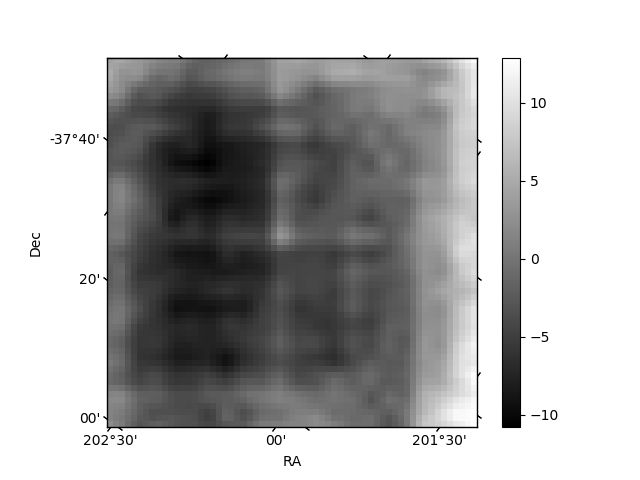
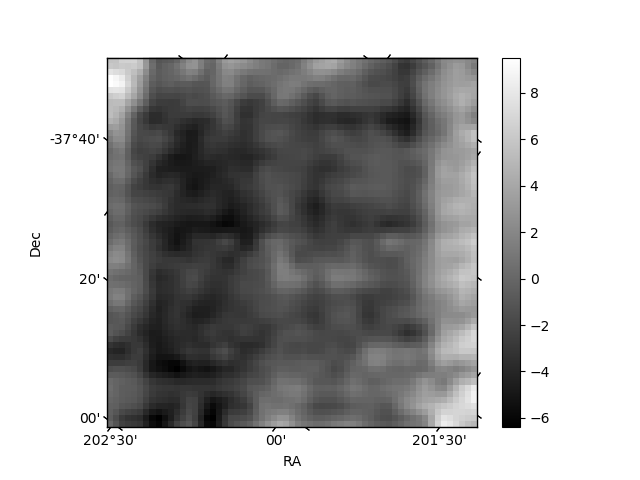
Histogram calculated using DETX and DETY for each event in the final _common_clean file
| Quadrant A | 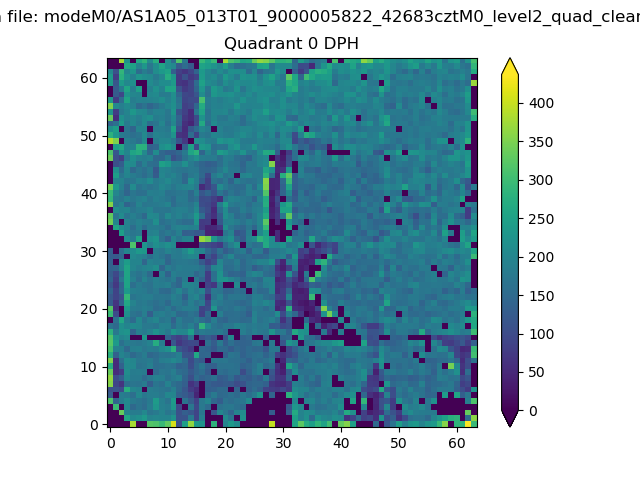 |
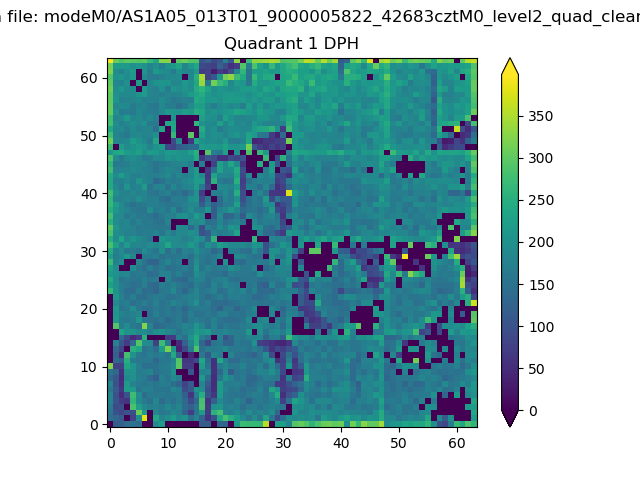 |
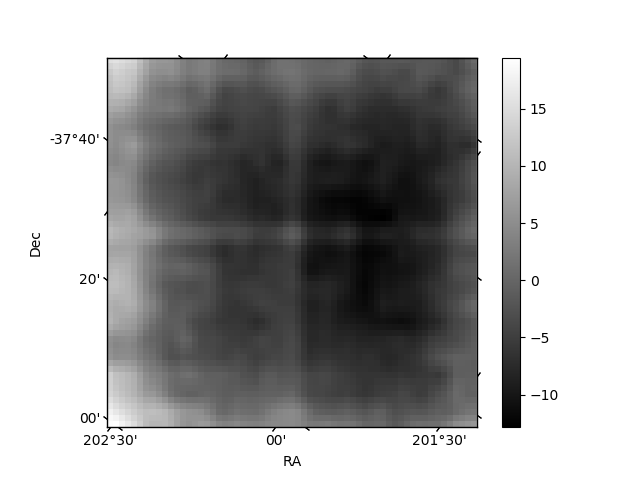
Quadrant B |
|---|---|---|---|
| Quadrant D | 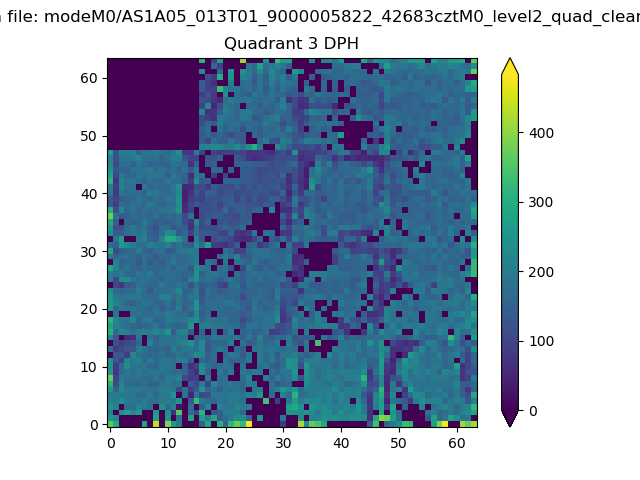 |
 |
Quadrant C |
| Plot type | Count rate plots | Images |
|---|---|---|
| Comparison with Poisson distribution Blue bars denote a histogram of data divided into 1 sec bins. Red curve is a Poisson curve with rate = median count rate of data. |
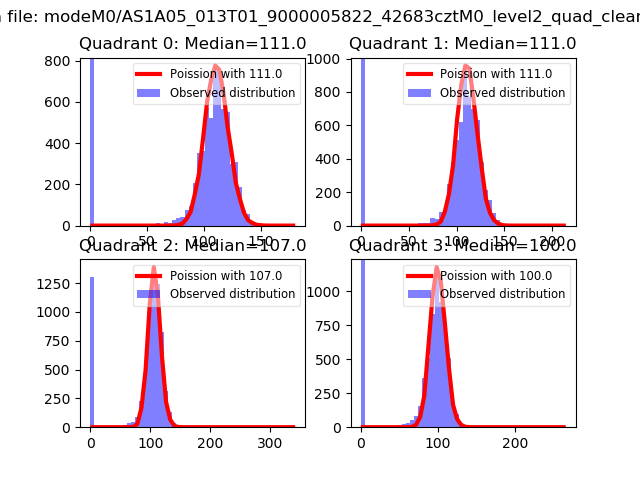 |
 |
| Quadrant-wise count rates Data is divided into 100 sec bins |
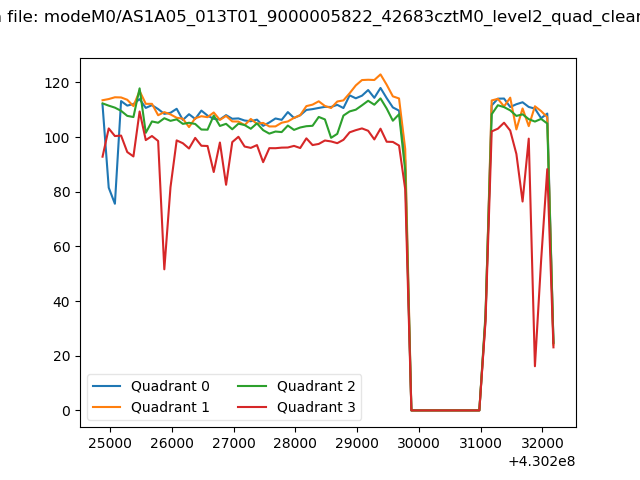 |
|
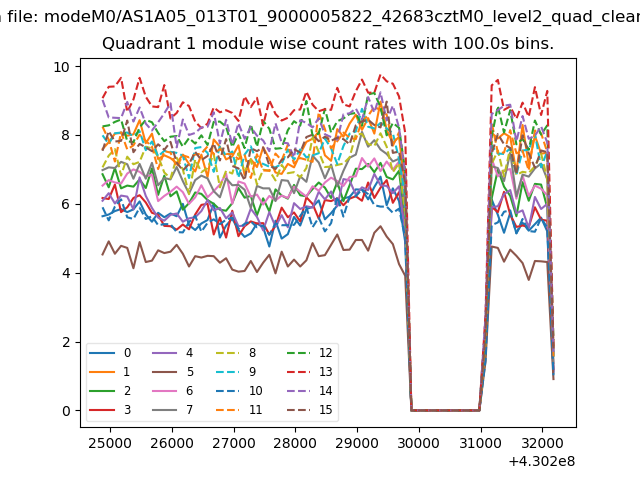
| Module-wise count rates for Quadrant A Data is divided into 100 sec bins |
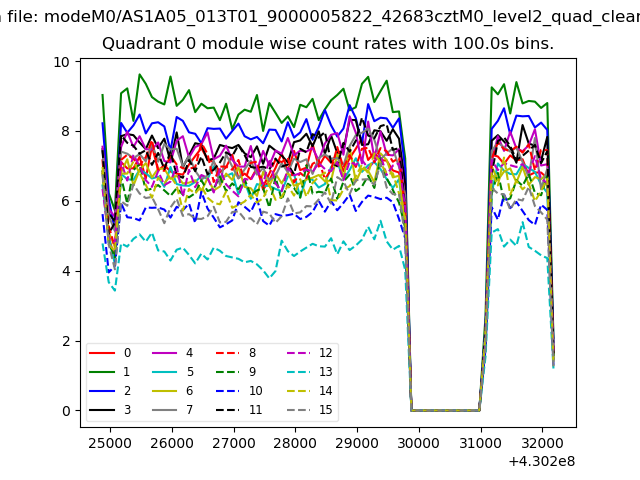 |
 |
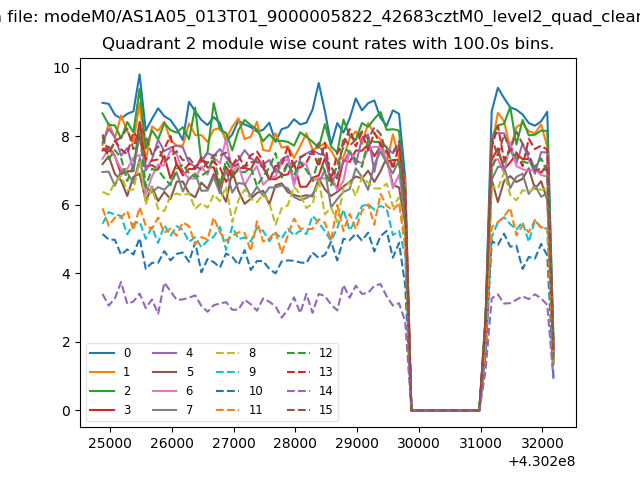
| Module-wise count rates for Quadrant B Data is divided into 100 sec bins |
 |
 |
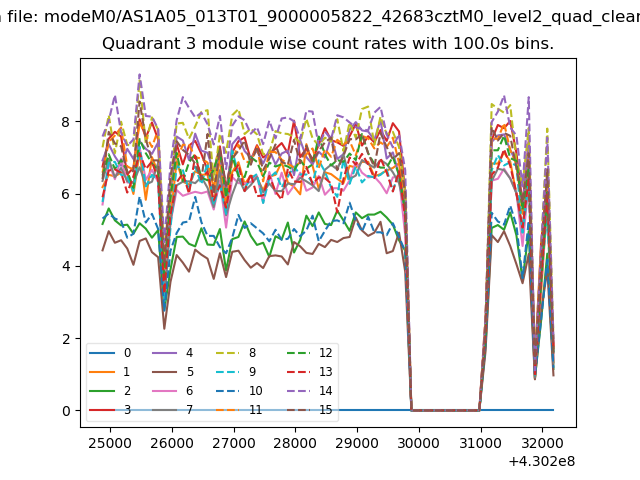
| Module-wise count rates for Quadrant C Data is divided into 100 sec bins |
 |
 |
| Module-wise count rates for Quadrant D Data is divided into 100 sec bins |
 |
 |
| Parameter | Plot |
|---|---|
| CZT HV Monitor | 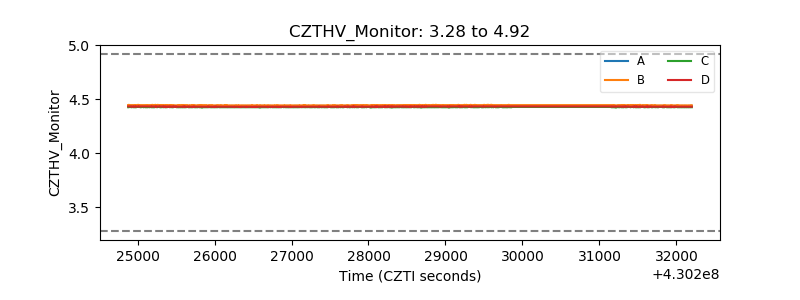 |
| D_VDD | 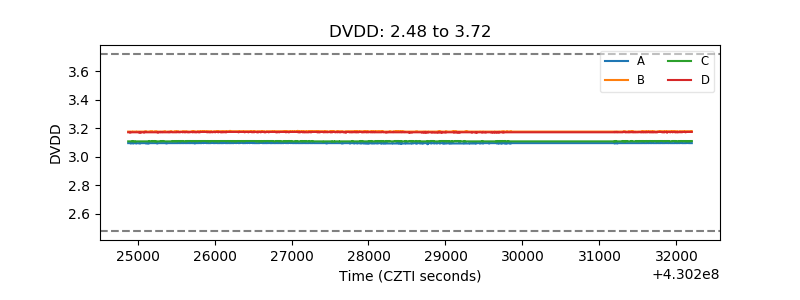 |
| Temperature 1 | 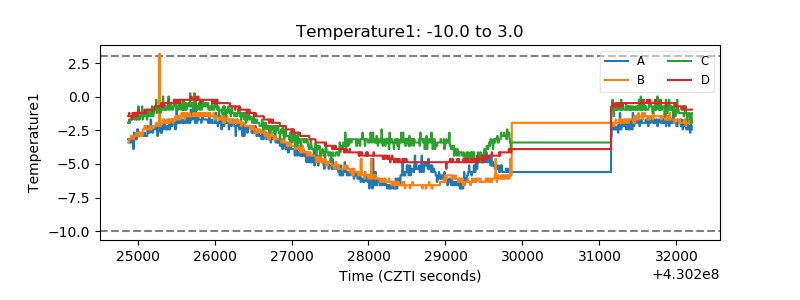 |
| Veto HV Monitor | 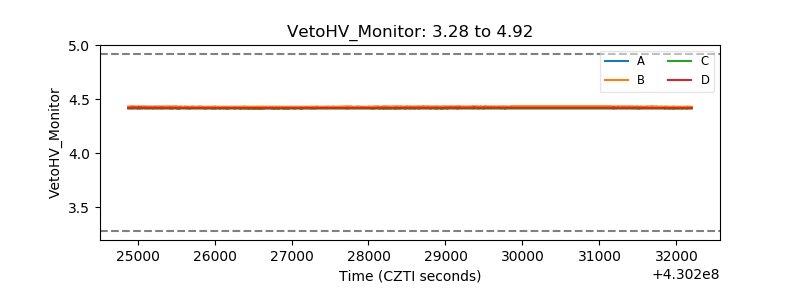 |
| Veto LLD | 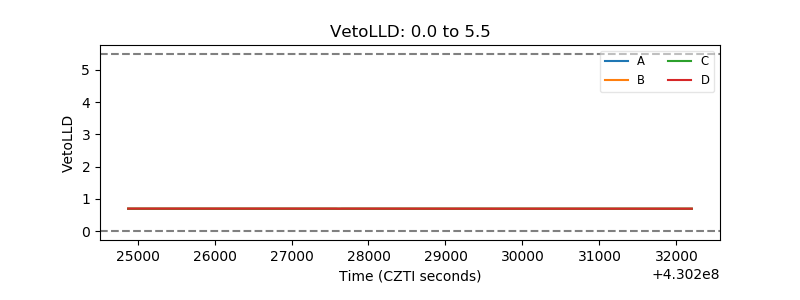 |
| Alpha Counter | 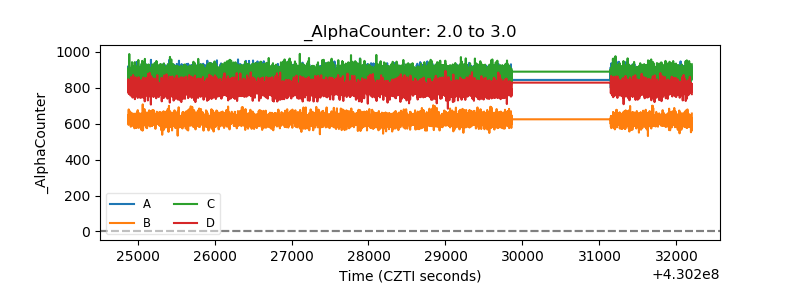 |
| _CPM_Rate | 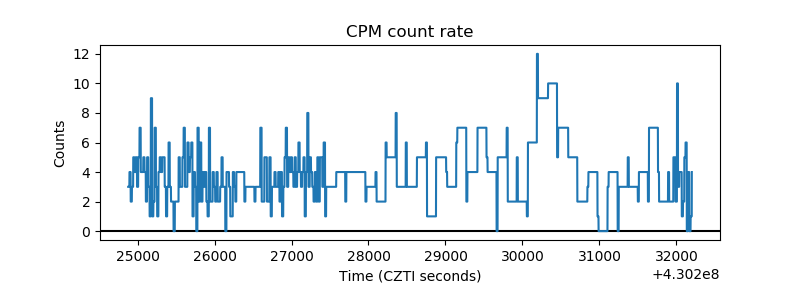 |
| CZT Counter | 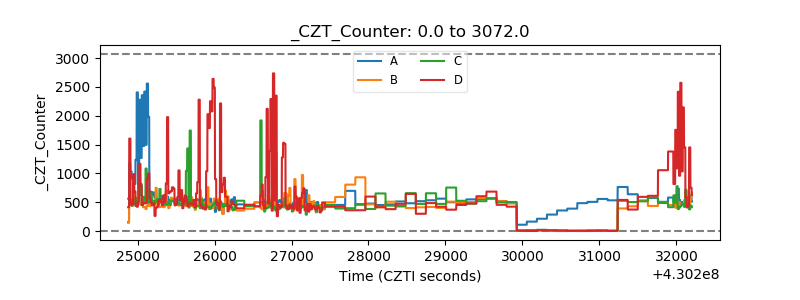 |
| +2.5 Volts monitor | 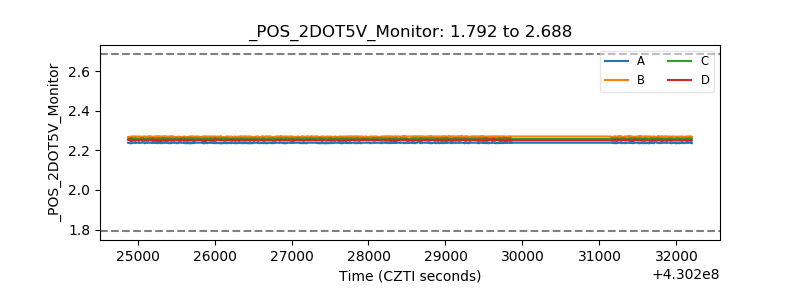 |
| +5 Volts monitor | 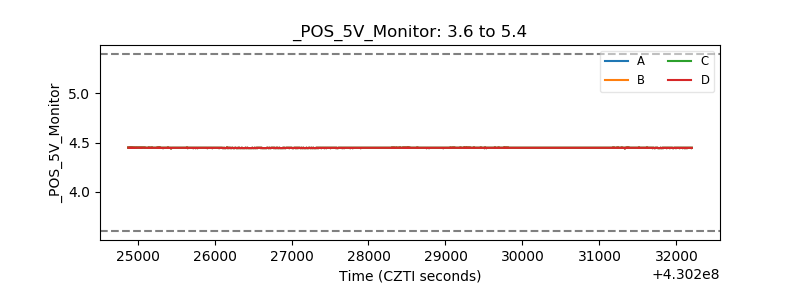 |
| _ROLL_ROT | 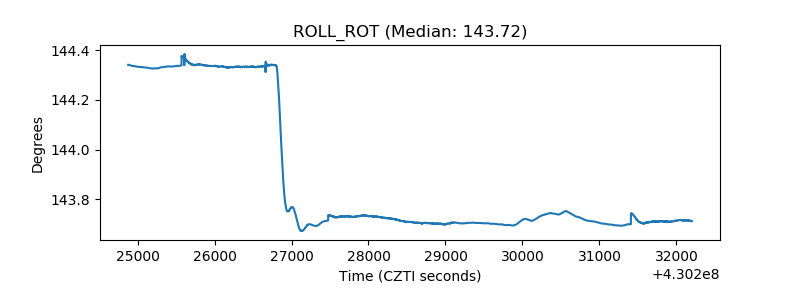 |
| _Roll_DEC | 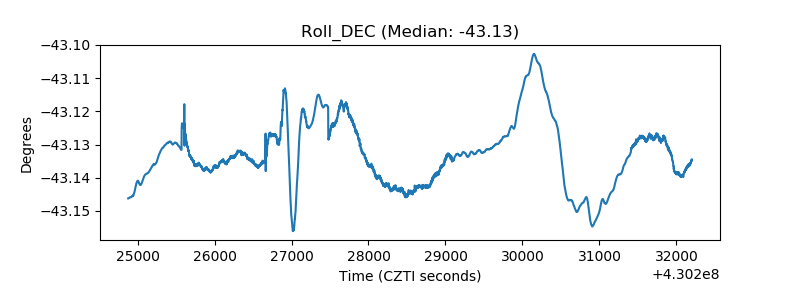 |
| _Roll_RA | 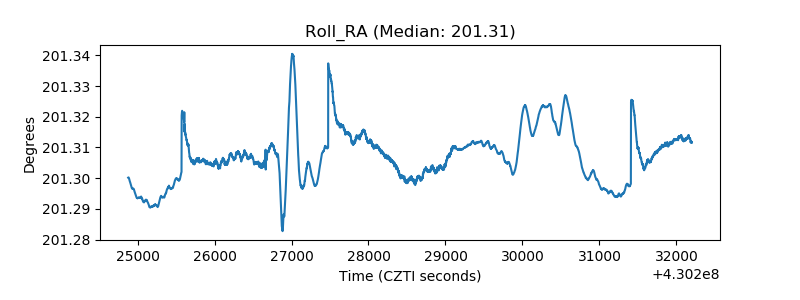 |
| Veto Counter | 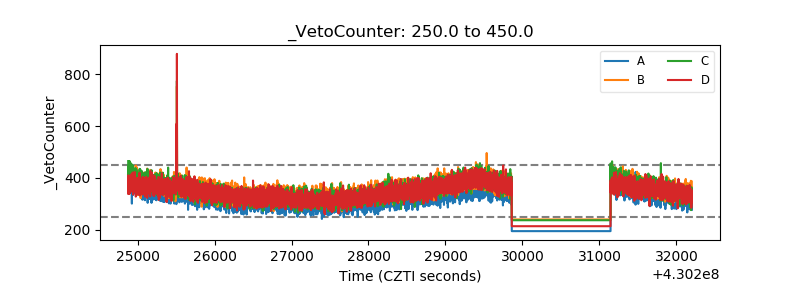 |