| Param | Original file | Final file |
|---|---|---|
| Filename | modeM0/AS1A05_013T01_9000005822_42685cztM0_level2.fits | modeM0/AS1A05_013T01_9000005822_42685cztM0_level2_quad_clean.evt |
| Size (bytes) | 698,941,440 | 170,890,560 |
| Size | 666.6 MB | 163.0 MB |
| Events in quadrant A | 5,831,960 | 1,156,148 |
| Events in quadrant B | 5,006,184 | 1,167,893 |
| Events in quadrant C | 5,533,167 | 1,124,909 |
| Events in quadrant D | 8,667,539 | 980,493 |
| Mode M0 | |||
|---|---|---|---|
| Quadrant | BADHDUFLAG | Total packets | Discarded packets |
| A | 0 | 23696 | 3 |
| B | 0 | 22444 | 3 |
| C | 0 | 23396 | 3 |
| D | 0 | 33126 | 3 |
| Mode M9 | |||
|---|---|---|---|
| Quadrant | BADHDUFLAG | Total packets | Discarded packets |
| A | 0 | 29 | 0 |
| B | 0 | 30 | 0 |
| C | 0 | 30 | 0 |
| D | 0 | 30 | 0 |
| Mode SS | |||
|---|---|---|---|
| Quadrant | BADHDUFLAG | Total packets | Discarded packets |
| A | 0 | 218 | 0 |
| B | 0 | 218 | 0 |
| C | 0 | 218 | 0 |
| D | 0 | 218 | 0 |
| Quadrant | Total seconds | Saturated seconds | Saturation percentage |
|---|---|---|---|
| A | 10755 | 60 | 0.557880% |
| B | 10755 | 61 | 0.567178% |
| C | 10755 | 30 | 0.278940% |
| D | 10755 | 820 | 7.624361% |
Noise dominated data is calculated using 1-second bins in cleaned event files. If a bin has >2000 counts, and if more than 50% of those come from <1% of pixels, then it is considered to be noise-dominated and hence unusable.
| Quadrant | # 1 sec bins | Bins with >0 counts | Bins with >2000 counts | High rate bins dominated by noise | Noise dominated (total time) | Noise dominated (detector-on time) | Marked lightcurve |
|---|---|---|---|---|---|---|---|
| A | 13559 | 10757 | 38 | 38 | 0.28% | 0.35% | 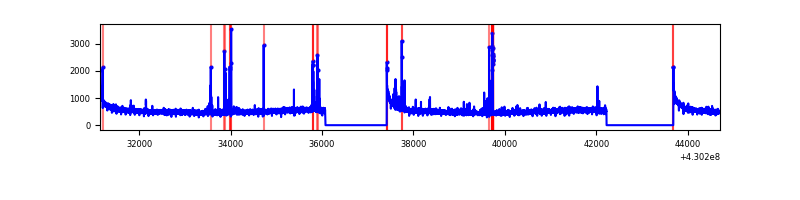 |
| B | 13559 | 10757 | 42 | 42 | 0.31% | 0.39% | 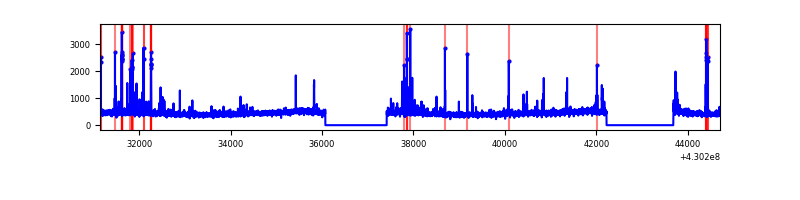 |
| C | 13559 | 10757 | 15 | 15 | 0.11% | 0.14% | 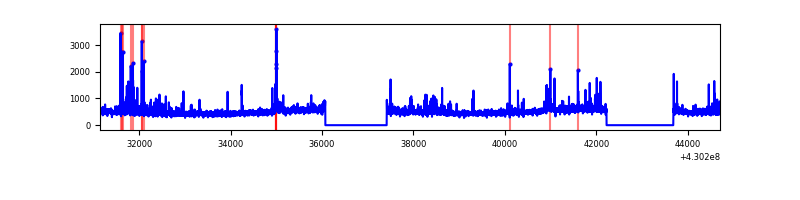 |
| D | 13559 | 10757 | 825 | 825 | 6.08% | 7.67% | 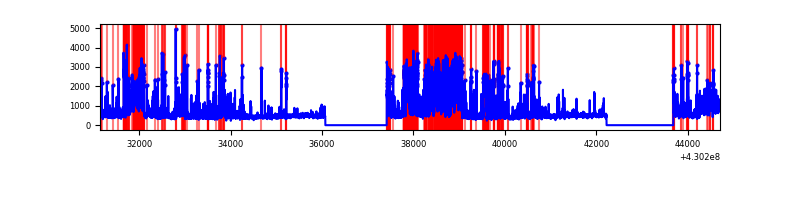 |
Top three noisy pixels from each quadrant. If the there are fewer than three noisy pixels in the level2.evt file, extra rows are filled as -1
| Pixel properties | Quadrant properties | ||||||
|---|---|---|---|---|---|---|---|
| Quadrant | DetID | PixID | Counts | Sigma | Mean | Median | Sigma |
| A | 10 | 83 | 1089584 | 4530.51 | 1172 | 1148 | 240.2 |
| A | 13 | 248 | 101895 | 419.35 | 1172 | 1148 | 240.2 |
| A | 15 | 237 | 84225 | 345.8 | 1172 | 1148 | 240.2 |
| B | 15 | 32 | 94631 | 418.86 | 1159 | 1128 | 223.2 |
| B | 4 | 141 | 66590 | 293.25 | 1159 | 1128 | 223.2 |
| B | 0 | 245 | 53468 | 234.46 | 1159 | 1128 | 223.2 |
| C | 15 | 214 | 445863 | 1677.42 | 1134 | 1141 | 265.1 |
| C | 8 | 79 | 290862 | 1092.78 | 1134 | 1141 | 265.1 |
| C | 14 | 254 | 161292 | 604.06 | 1134 | 1141 | 265.1 |
| D | 1 | 47 | 1884096 | 6970.54 | 1103 | 1072 | 270.1 |
| D | 2 | 249 | 1195473 | 4421.41 | 1103 | 1072 | 270.1 |
| D | 1 | 52 | 922334 | 3410.31 | 1103 | 1072 | 270.1 |
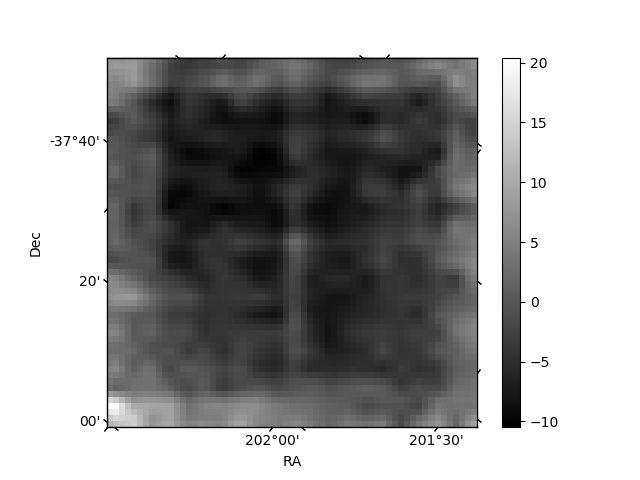
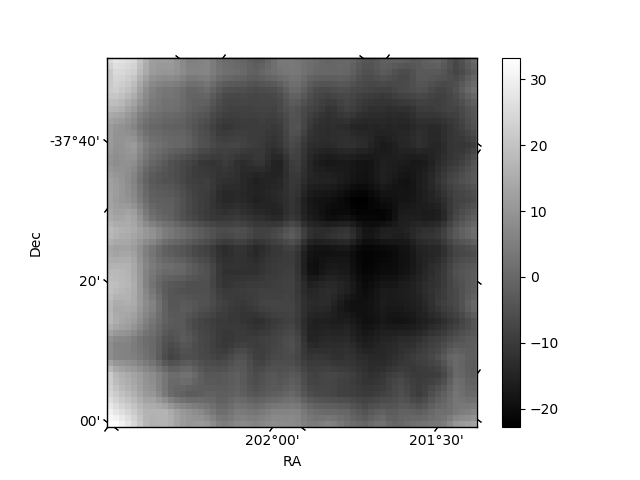
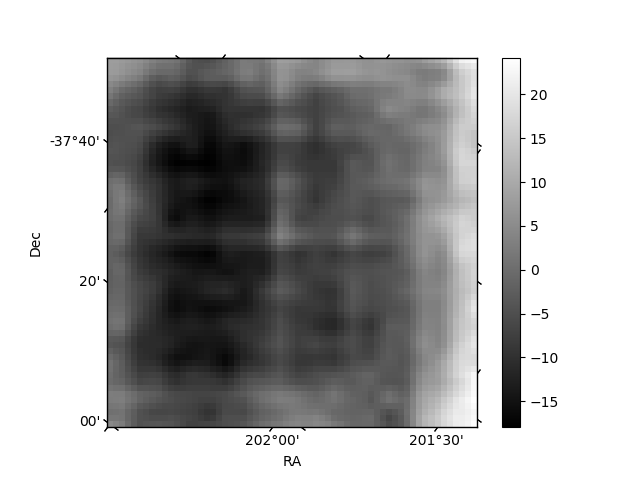
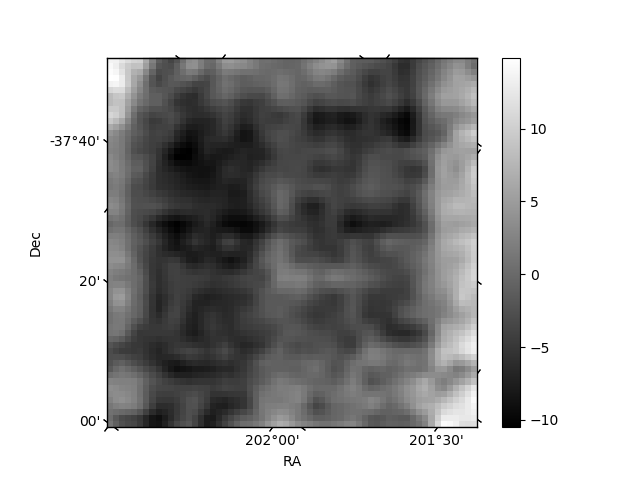
Histogram calculated using DETX and DETY for each event in the final _common_clean file
| Quadrant A | 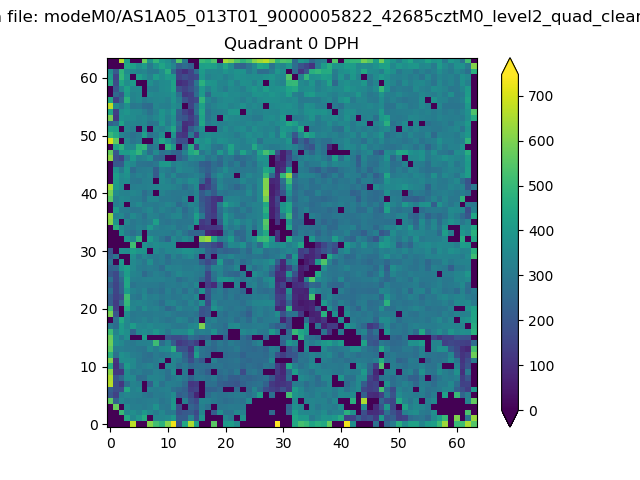 |
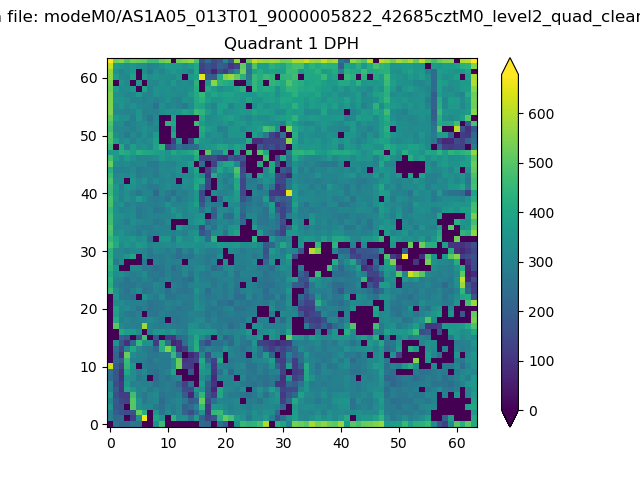 |
Quadrant B |
|---|---|---|---|
| Quadrant D | 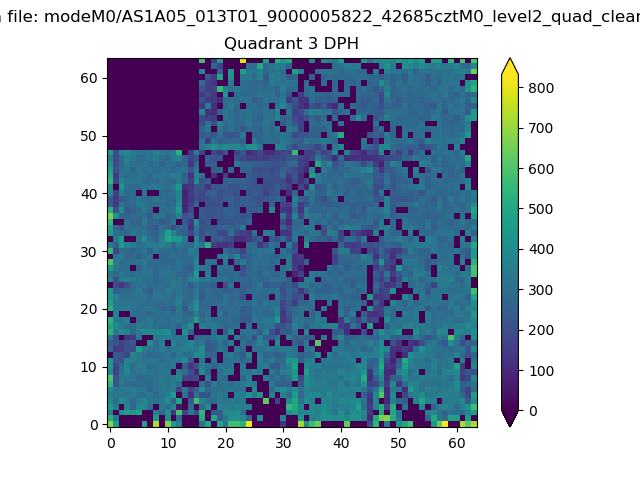 |
 |
Quadrant C |
| Plot type | Count rate plots | Images |
|---|---|---|
| Comparison with Poisson distribution Blue bars denote a histogram of data divided into 1 sec bins. Red curve is a Poisson curve with rate = median count rate of data. |
 |
 |
| Quadrant-wise count rates Data is divided into 100 sec bins |
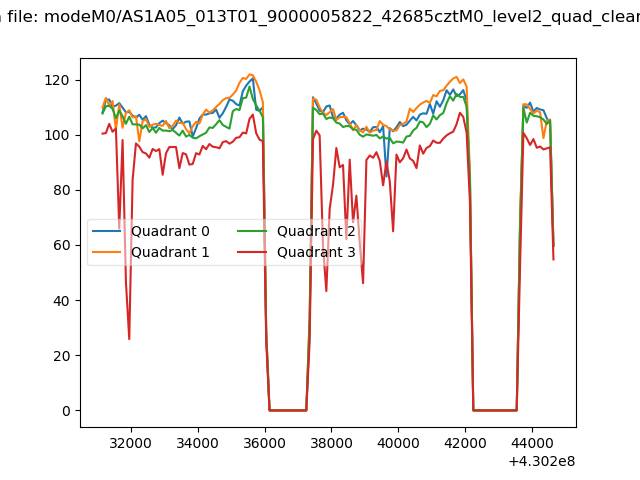 |
|
| Module-wise count rates for Quadrant A Data is divided into 100 sec bins |
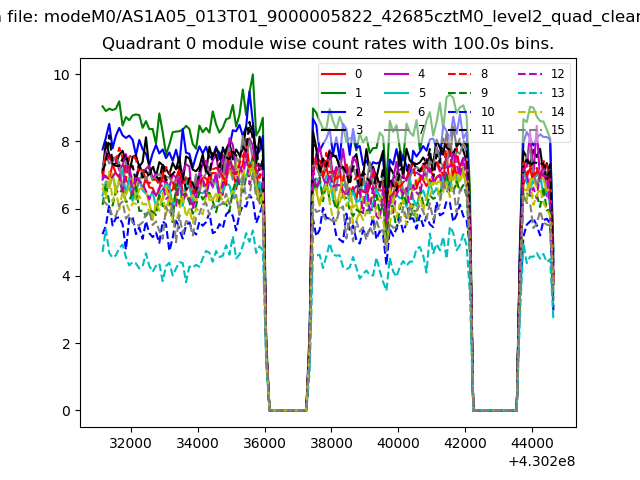 |
 |
| Module-wise count rates for Quadrant B Data is divided into 100 sec bins |
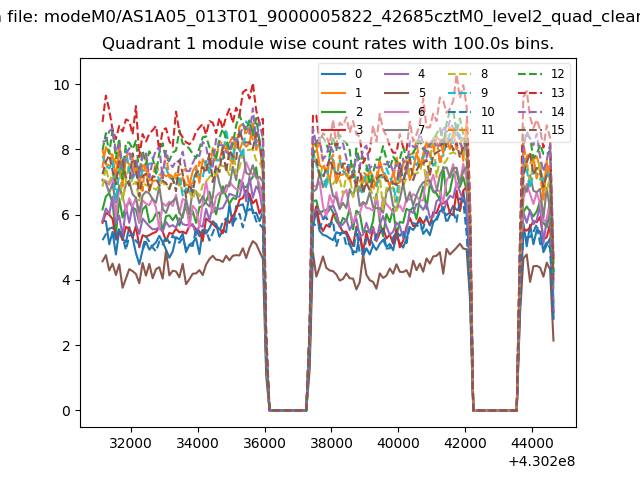 |
 |
| Module-wise count rates for Quadrant C Data is divided into 100 sec bins |
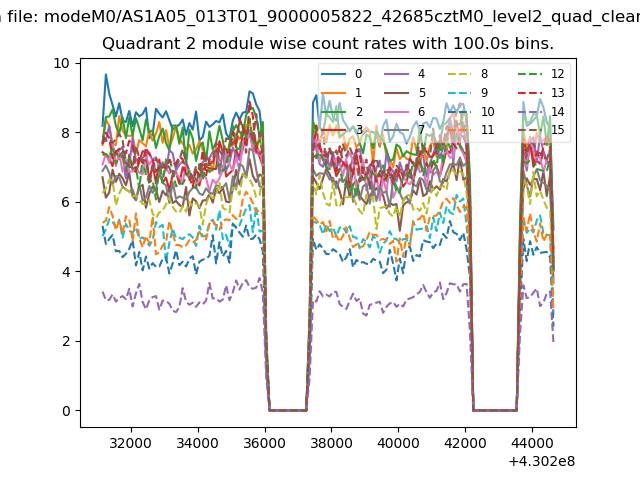 |
 |
| Module-wise count rates for Quadrant D Data is divided into 100 sec bins |
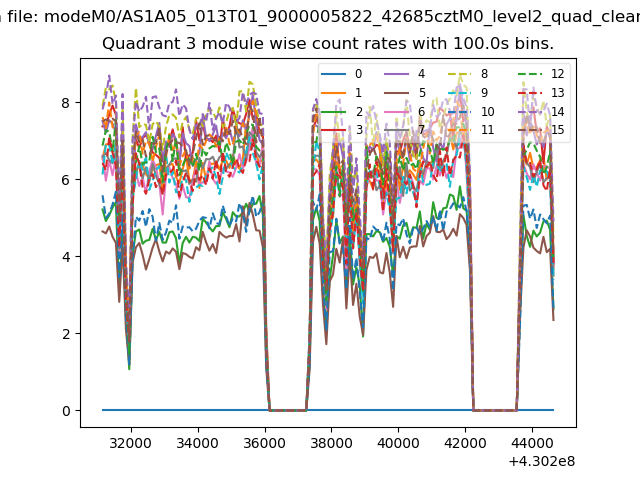 |
 |
| Parameter | Plot |
|---|---|
| CZT HV Monitor | 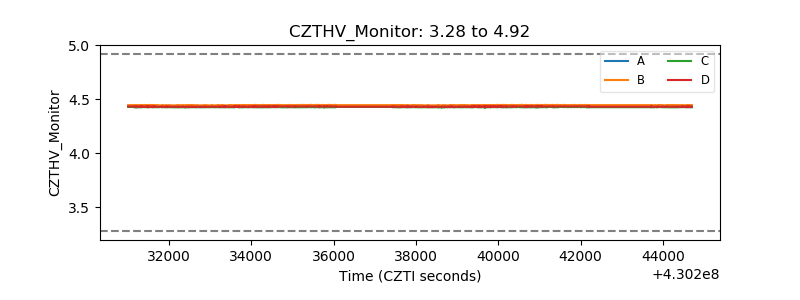 |
| D_VDD |  |
| Temperature 1 | 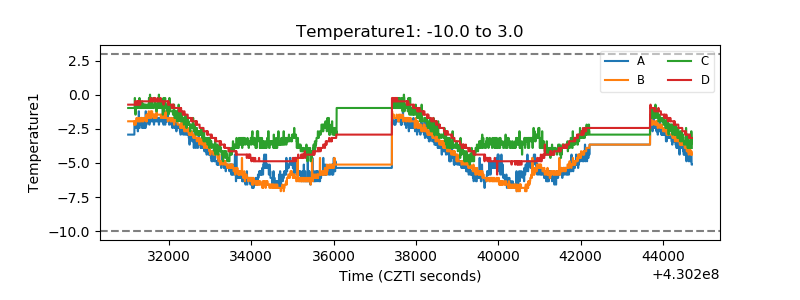 |
| Veto HV Monitor | 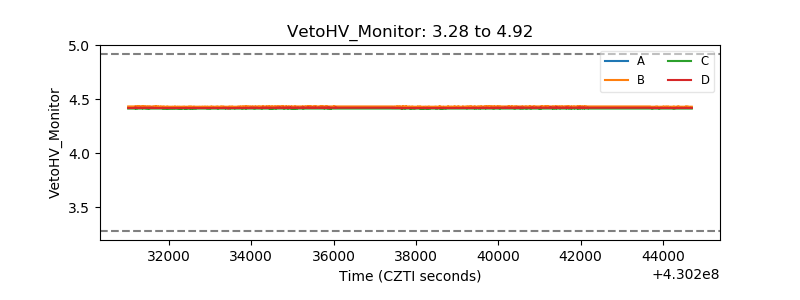 |
| Veto LLD | 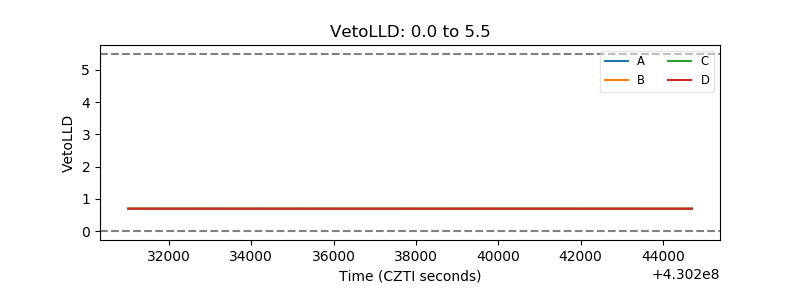 |
| Alpha Counter | 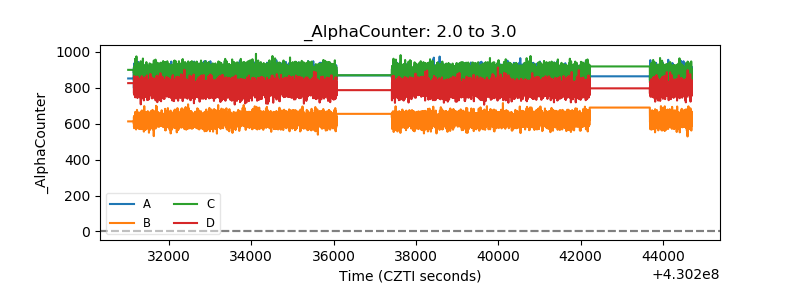 |
| _CPM_Rate | 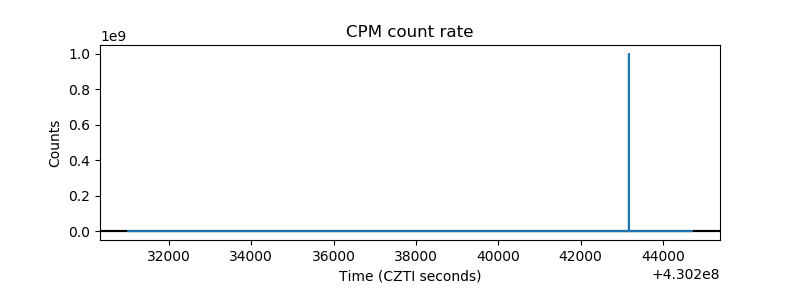 |
| CZT Counter | 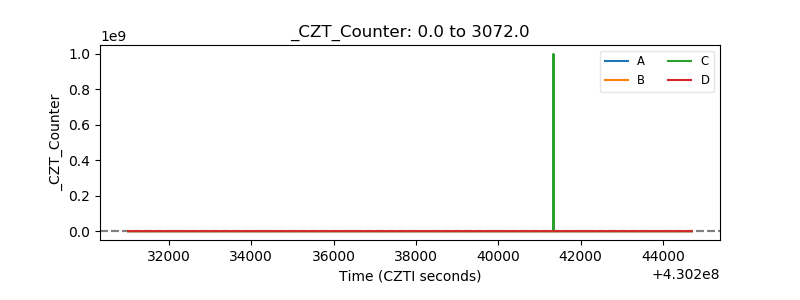 |
| +2.5 Volts monitor | 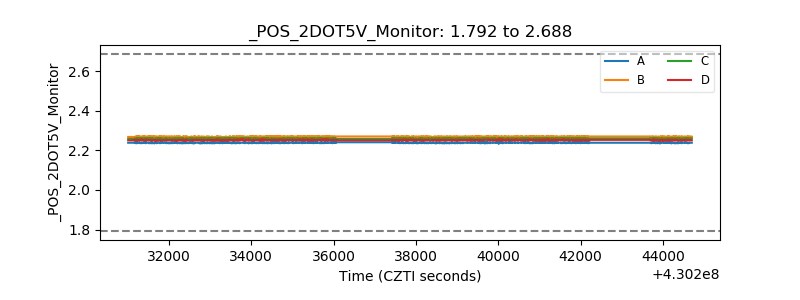 |
| +5 Volts monitor | 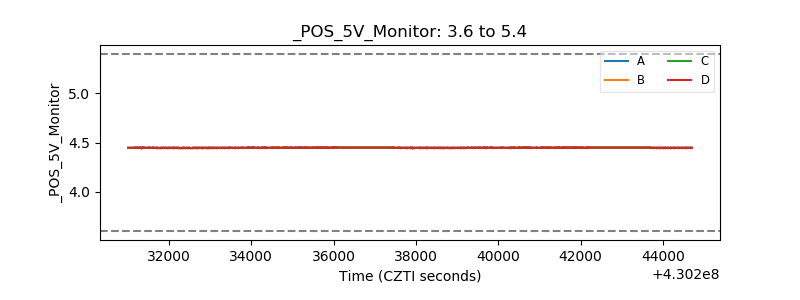 |
| _ROLL_ROT | 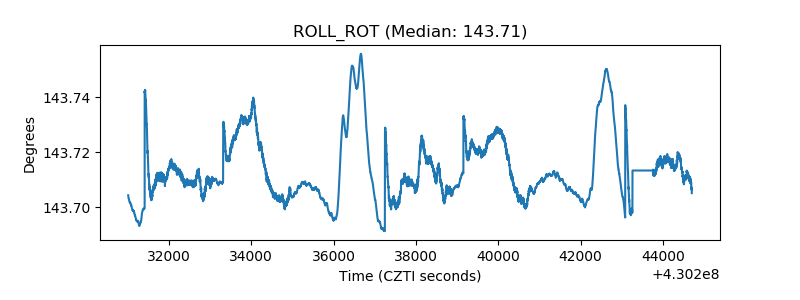 |
| _Roll_DEC | 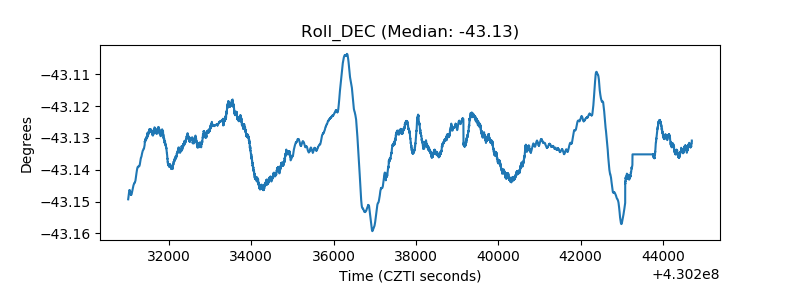 |
| _Roll_RA | 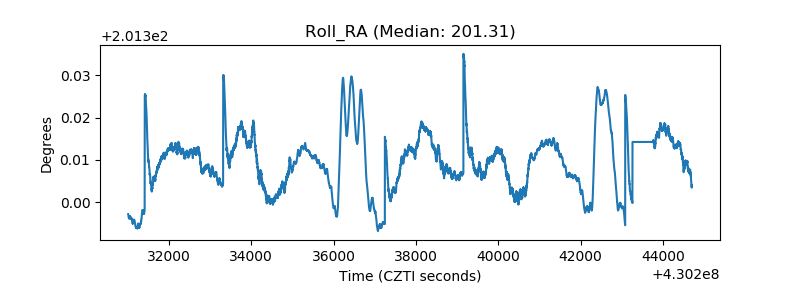 |
| Veto Counter | 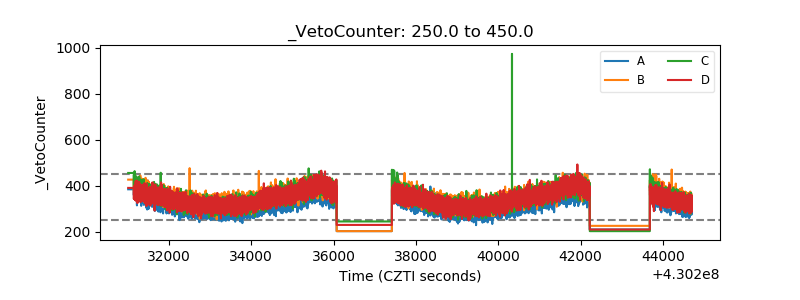 |