| Param | Original file | Final file |
|---|---|---|
| Filename | modeM0/AS1A05_013T01_9000005822_42686cztM0_level2.fits | modeM0/AS1A05_013T01_9000005822_42686cztM0_level2_quad_clean.evt |
| Size (bytes) | 361,175,040 | 90,432,000 |
| Size | 344.4 MB | 86.2 MB |
| Events in quadrant A | 3,037,070 | 604,849 |
| Events in quadrant B | 2,520,000 | 615,779 |
| Events in quadrant C | 3,102,205 | 589,002 |
| Events in quadrant D | 4,273,842 | 536,213 |
| Mode M0 | |||
|---|---|---|---|
| Quadrant | BADHDUFLAG | Total packets | Discarded packets |
| A | 0 | 12370 | 2 |
| B | 0 | 11496 | 2 |
| C | 0 | 12848 | 2 |
| D | 0 | 16606 | 2 |
| Mode M9 | |||
|---|---|---|---|
| Quadrant | BADHDUFLAG | Total packets | Discarded packets |
| A | 0 | 20 | 0 |
| B | 0 | 21 | 0 |
| C | 0 | 21 | 0 |
| D | 0 | 21 | 0 |
| Mode SS | |||
|---|---|---|---|
| Quadrant | BADHDUFLAG | Total packets | Discarded packets |
| A | 0 | 114 | 0 |
| B | 0 | 114 | 0 |
| C | 0 | 114 | 0 |
| D | 0 | 114 | 0 |
| Quadrant | Total seconds | Saturated seconds | Saturation percentage |
|---|---|---|---|
| A | 5608 | 38 | 0.677603% |
| B | 5608 | 23 | 0.410128% |
| C | 5608 | 19 | 0.338802% |
| D | 5608 | 205 | 3.655492% |
Noise dominated data is calculated using 1-second bins in cleaned event files. If a bin has >2000 counts, and if more than 50% of those come from <1% of pixels, then it is considered to be noise-dominated and hence unusable.
| Quadrant | # 1 sec bins | Bins with >0 counts | Bins with >2000 counts | High rate bins dominated by noise | Noise dominated (total time) | Noise dominated (detector-on time) | Marked lightcurve |
|---|---|---|---|---|---|---|---|
| A | 7191 | 5609 | 16 | 16 | 0.22% | 0.29% | 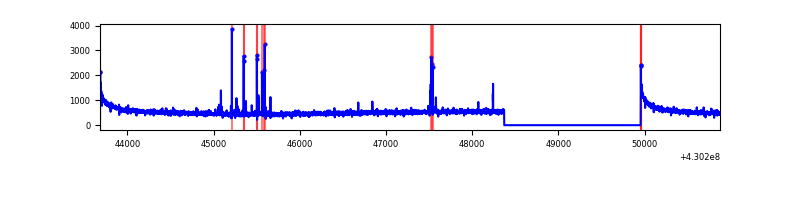 |
| B | 7191 | 5609 | 10 | 10 | 0.14% | 0.18% | 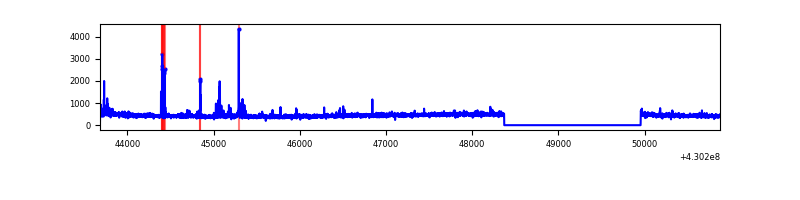 |
| C | 7191 | 5609 | 10 | 10 | 0.14% | 0.18% | 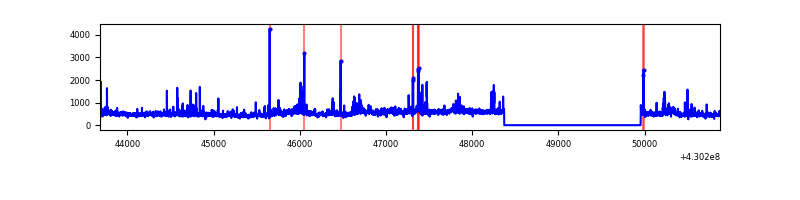 |
| D | 7191 | 5609 | 184 | 184 | 2.56% | 3.28% | 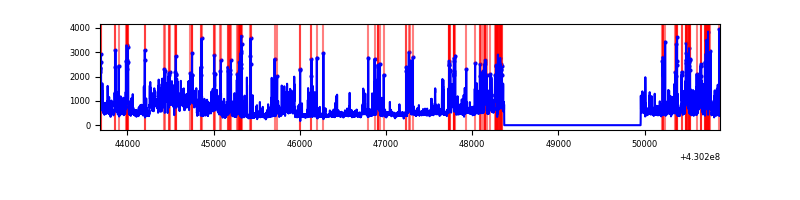 |
Top three noisy pixels from each quadrant. If the there are fewer than three noisy pixels in the level2.evt file, extra rows are filled as -1
| Pixel properties | Quadrant properties | ||||||
|---|---|---|---|---|---|---|---|
| Quadrant | DetID | PixID | Counts | Sigma | Mean | Median | Sigma |
| A | 10 | 83 | 600941 | 4814.83 | 606 | 593 | 124.7 |
| A | 13 | 248 | 36396 | 287.14 | 606 | 593 | 124.7 |
| A | 15 | 237 | 31238 | 245.77 | 606 | 593 | 124.7 |
| B | 5 | 255 | 34530 | 287.4 | 604 | 588 | 118.1 |
| B | 0 | 229 | 29244 | 242.64 | 604 | 588 | 118.1 |
| B | 4 | 141 | 26069 | 215.76 | 604 | 588 | 118.1 |
| C | 8 | 79 | 283604 | 2039.92 | 587 | 590 | 138.7 |
| C | 15 | 214 | 232449 | 1671.2 | 587 | 590 | 138.7 |
| C | 14 | 254 | 163323 | 1172.95 | 587 | 590 | 138.7 |
| D | 1 | 47 | 992523 | 6892.2 | 581 | 561 | 143.9 |
| D | 2 | 249 | 431328 | 2992.99 | 581 | 561 | 143.9 |
| D | 1 | 52 | 328449 | 2278.18 | 581 | 561 | 143.9 |
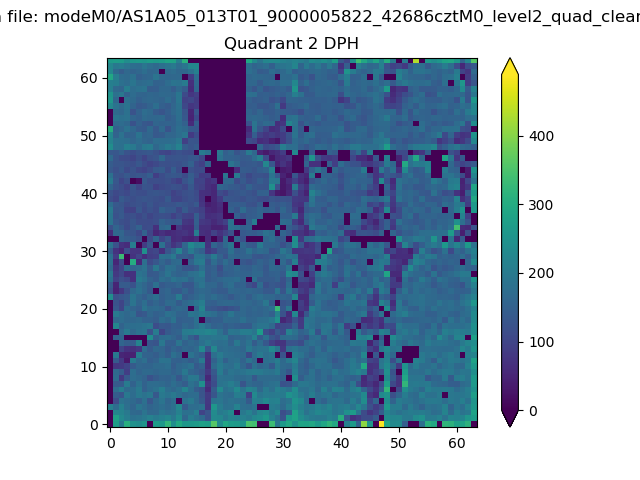
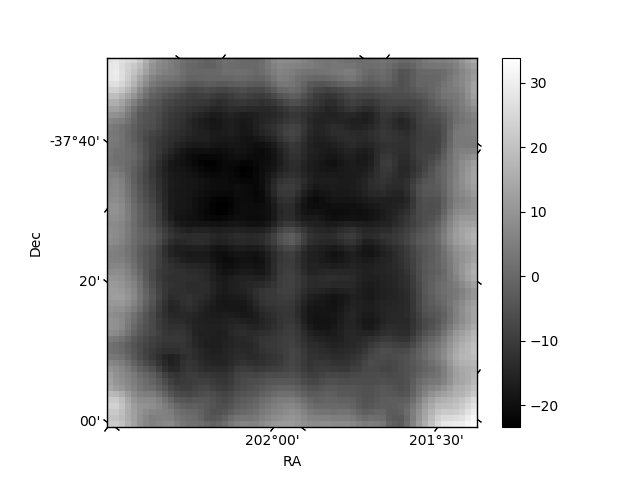
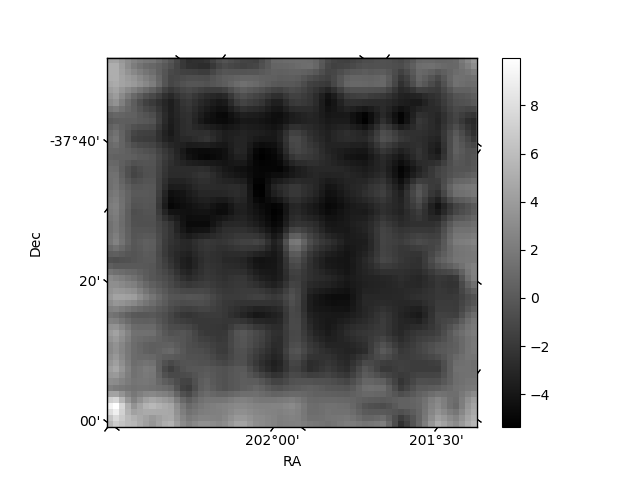
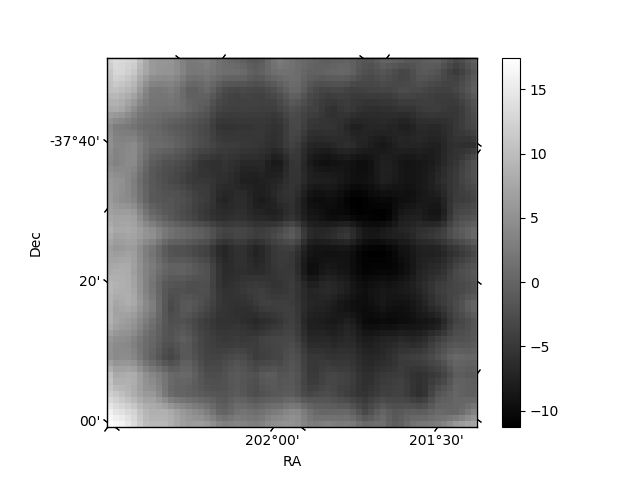
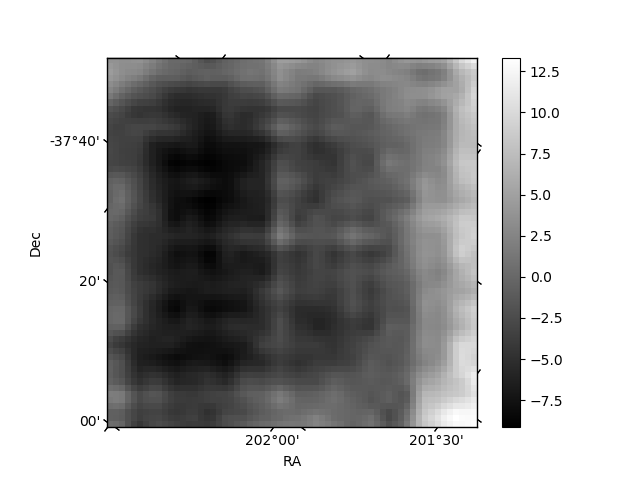
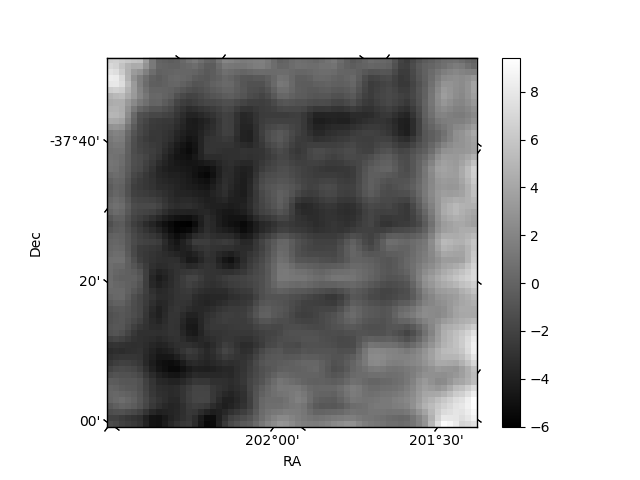
Histogram calculated using DETX and DETY for each event in the final _common_clean file
| Quadrant A | 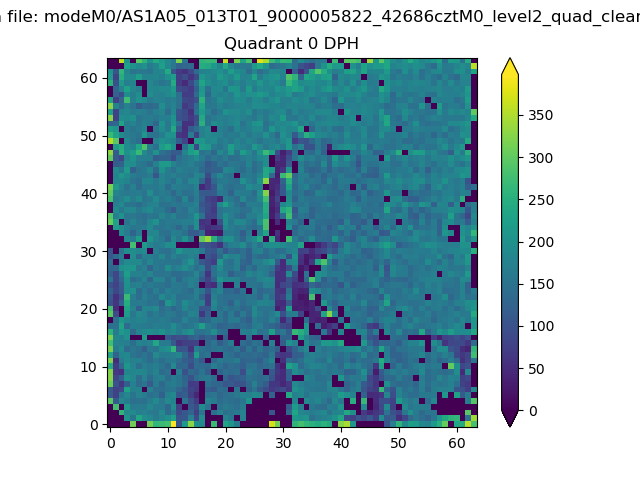 |
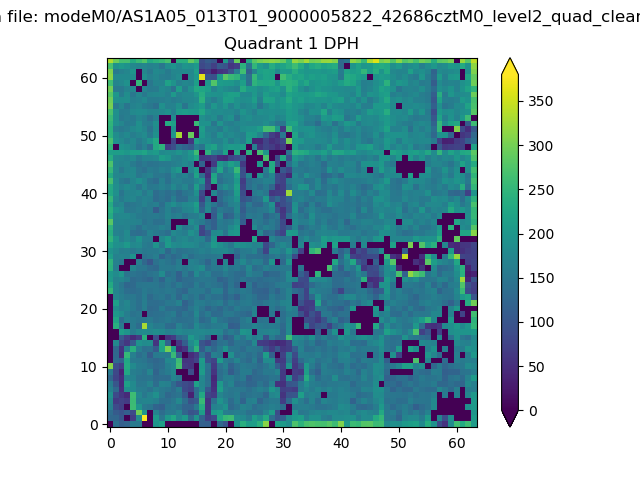 |
Quadrant B |
|---|---|---|---|
| Quadrant D | 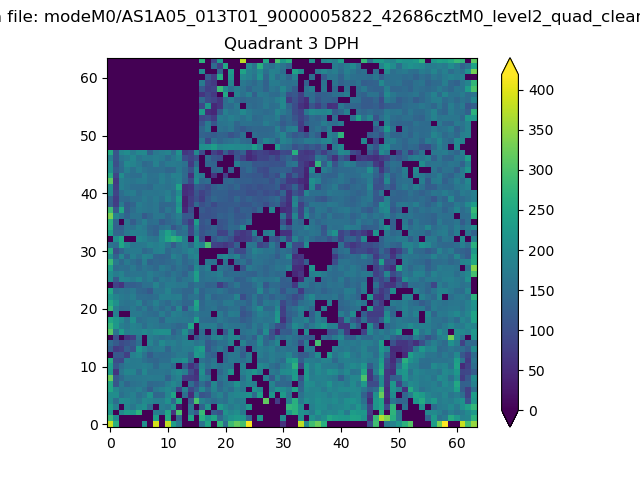 |
 |
Quadrant C |
| Plot type | Count rate plots | Images |
|---|---|---|
| Comparison with Poisson distribution Blue bars denote a histogram of data divided into 1 sec bins. Red curve is a Poisson curve with rate = median count rate of data. |
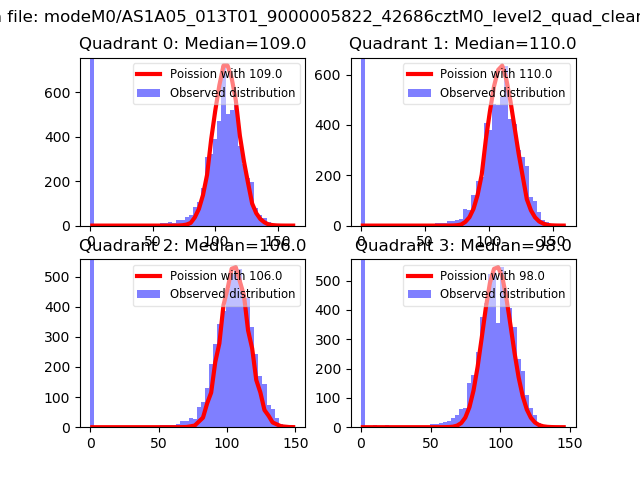 |
 |
| Quadrant-wise count rates Data is divided into 100 sec bins |
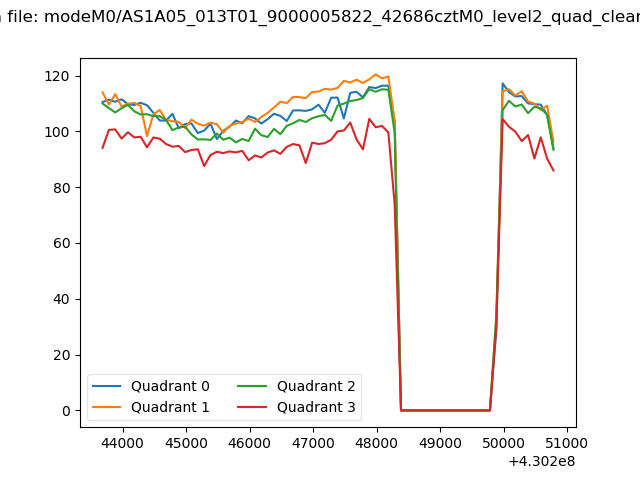 |
|
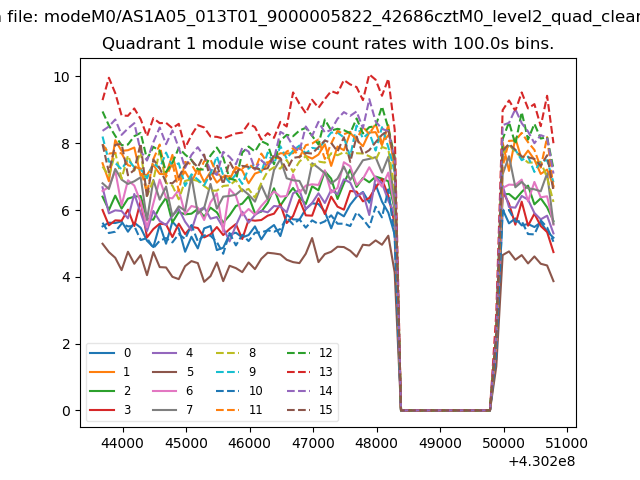
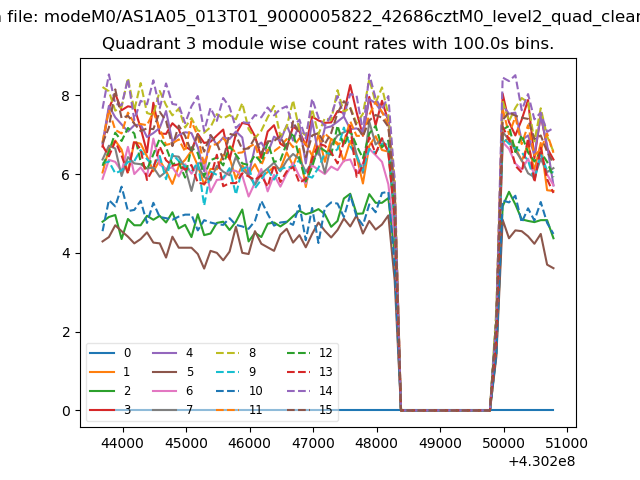
| Module-wise count rates for Quadrant A Data is divided into 100 sec bins |
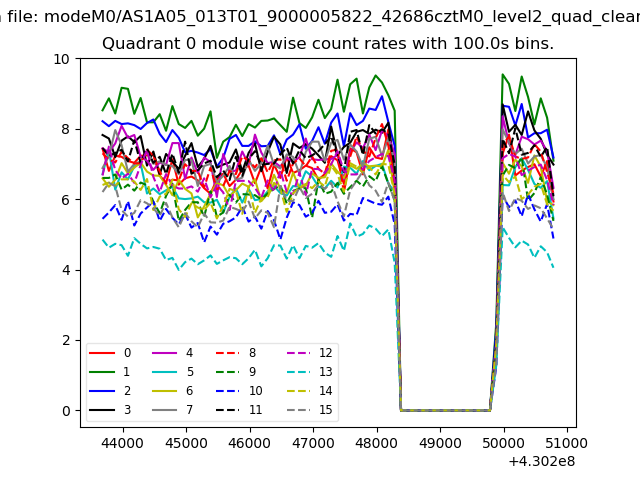 |
 |
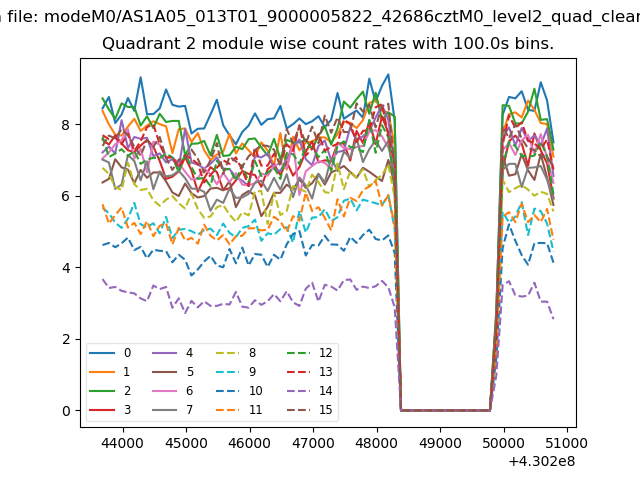
| Module-wise count rates for Quadrant B Data is divided into 100 sec bins |
 |
 |
| Module-wise count rates for Quadrant C Data is divided into 100 sec bins |
 |
 |
| Module-wise count rates for Quadrant D Data is divided into 100 sec bins |
 |
 |
| Parameter | Plot |
|---|---|
| CZT HV Monitor | 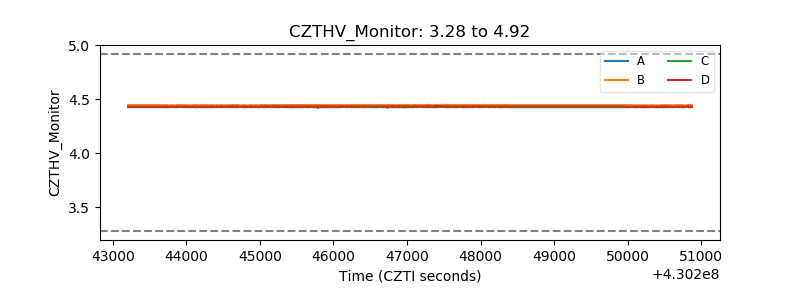 |
| D_VDD | 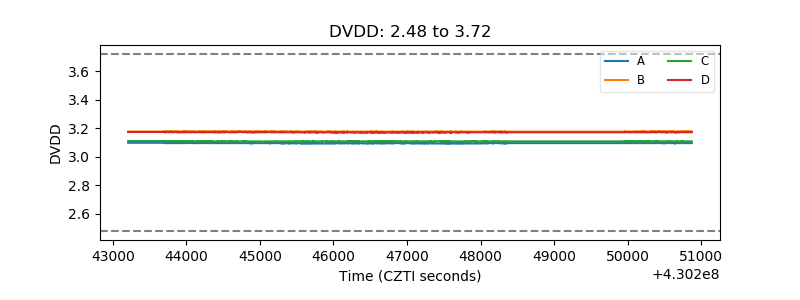 |
| Temperature 1 | 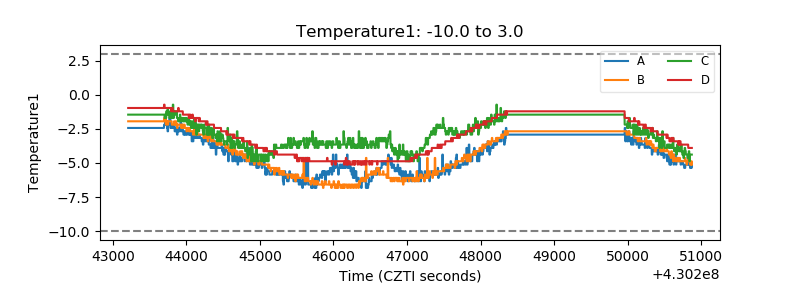 |
| Veto HV Monitor | 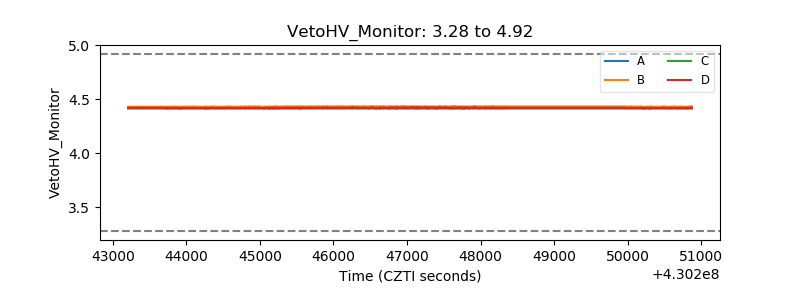 |
| Veto LLD | 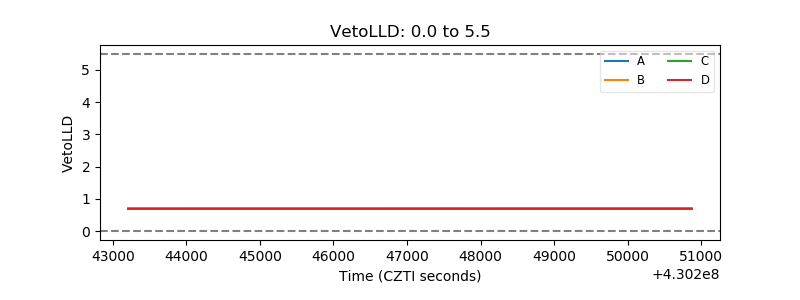 |
| Alpha Counter | 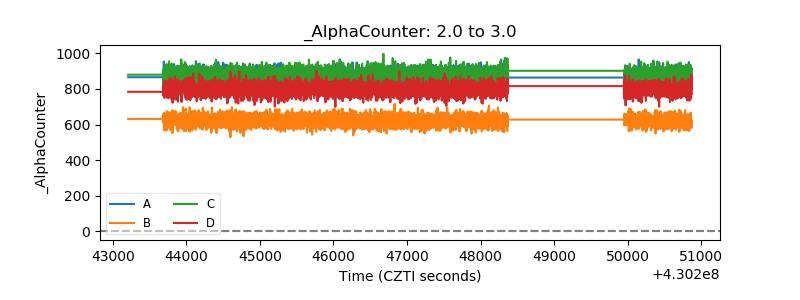 |
| _CPM_Rate | 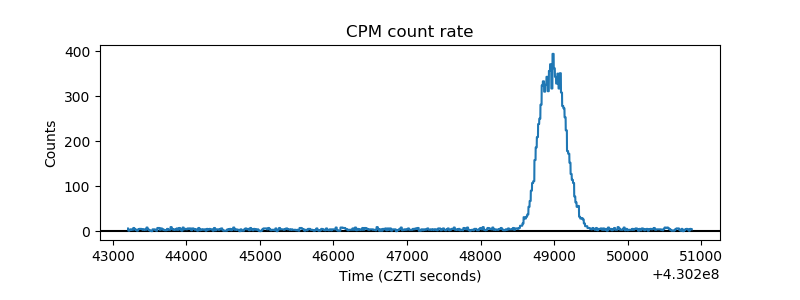 |
| CZT Counter | 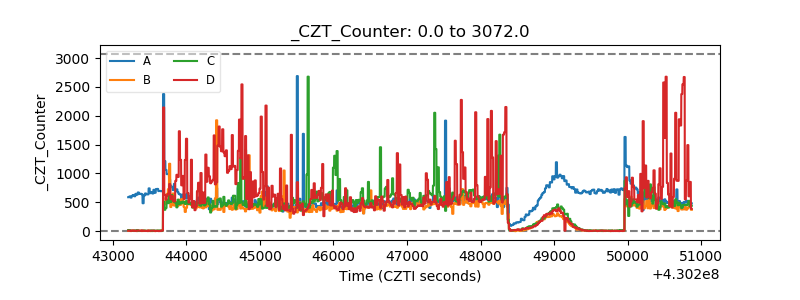 |
| +2.5 Volts monitor | 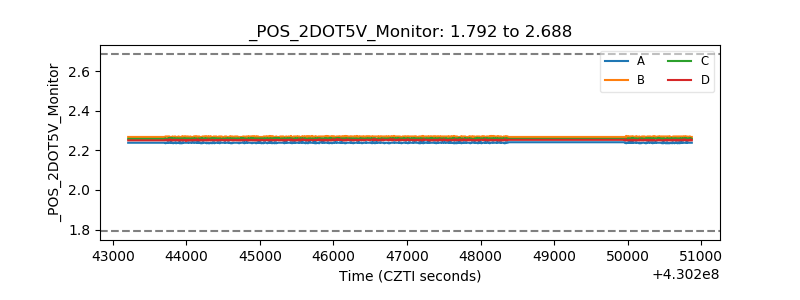 |
| +5 Volts monitor | 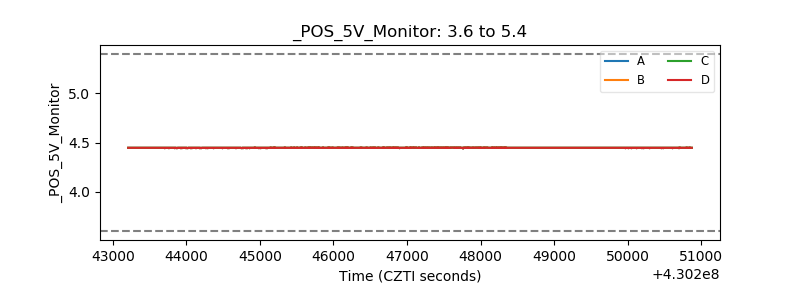 |
| _ROLL_ROT | 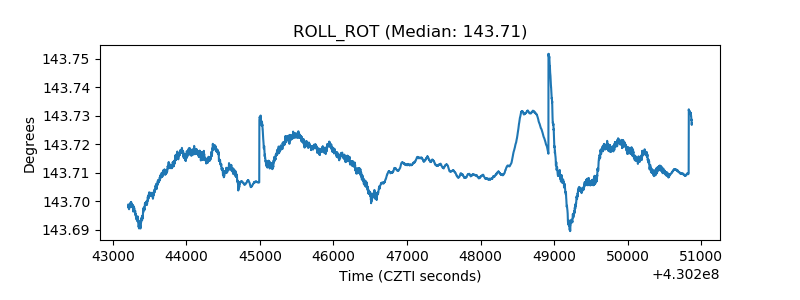 |
| _Roll_DEC | 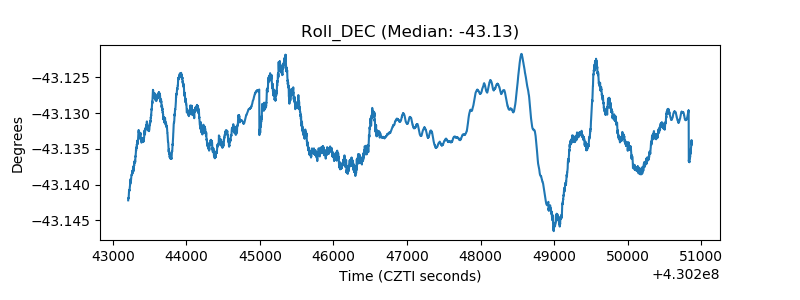 |
| _Roll_RA |  |
| Veto Counter | 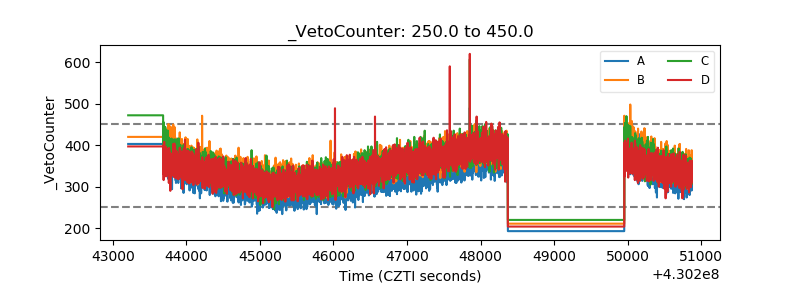 |