| Param | Original file | Final file |
|---|---|---|
| Filename | modeM0/AS1A05_013T01_9000005822_42687cztM0_level2.fits | modeM0/AS1A05_013T01_9000005822_42687cztM0_level2_quad_clean.evt |
| Size (bytes) | 347,857,920 | 88,444,800 |
| Size | 331.7 MB | 84.3 MB |
| Events in quadrant A | 3,268,782 | 588,805 |
| Events in quadrant B | 2,411,978 | 609,791 |
| Events in quadrant C | 2,886,752 | 579,506 |
| Events in quadrant D | 3,884,579 | 518,116 |
| Mode M0 | |||
|---|---|---|---|
| Quadrant | BADHDUFLAG | Total packets | Discarded packets |
| A | 0 | 13063 | 2 |
| B | 0 | 11086 | 2 |
| C | 0 | 12024 | 2 |
| D | 0 | 15181 | 2 |
| Mode M9 | |||
|---|---|---|---|
| Quadrant | BADHDUFLAG | Total packets | Discarded packets |
| A | 0 | 21 | 0 |
| B | 0 | 22 | 0 |
| C | 0 | 22 | 0 |
| D | 0 | 22 | 0 |
| Mode SS | |||
|---|---|---|---|
| Quadrant | BADHDUFLAG | Total packets | Discarded packets |
| A | 0 | 112 | 0 |
| B | 0 | 112 | 0 |
| C | 0 | 112 | 0 |
| D | 0 | 112 | 0 |
| Quadrant | Total seconds | Saturated seconds | Saturation percentage |
|---|---|---|---|
| A | 5451 | 141 | 2.586681% |
| B | 5451 | 10 | 0.183453% |
| C | 5451 | 8 | 0.146762% |
| D | 5451 | 266 | 4.879839% |
Noise dominated data is calculated using 1-second bins in cleaned event files. If a bin has >2000 counts, and if more than 50% of those come from <1% of pixels, then it is considered to be noise-dominated and hence unusable.
| Quadrant | # 1 sec bins | Bins with >0 counts | Bins with >2000 counts | High rate bins dominated by noise | Noise dominated (total time) | Noise dominated (detector-on time) | Marked lightcurve |
|---|---|---|---|---|---|---|---|
| A | 7123 | 5452 | 105 | 105 | 1.47% | 1.93% | 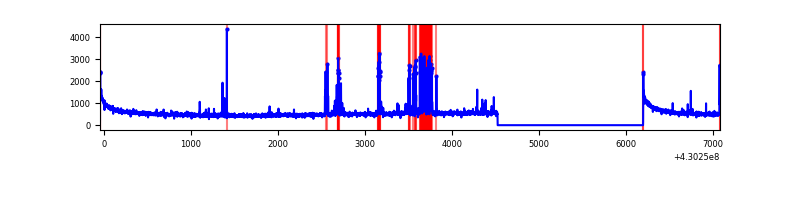 |
| B | 7123 | 5452 | 4 | 4 | 0.06% | 0.07% | 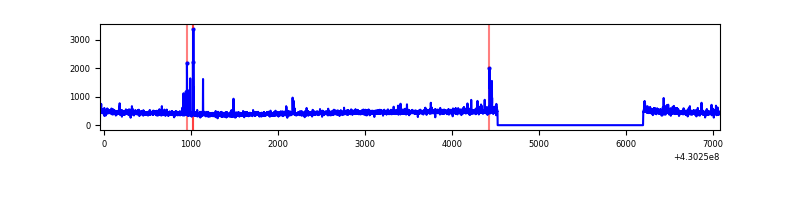 |
| C | 7123 | 5452 | 5 | 5 | 0.07% | 0.09% | 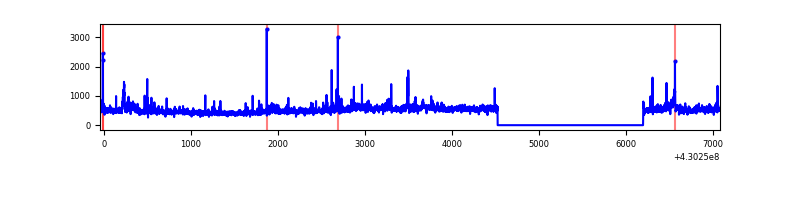 |
| D | 7123 | 5452 | 236 | 236 | 3.31% | 4.33% | 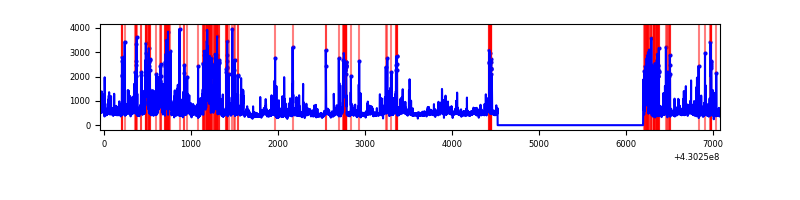 |
Top three noisy pixels from each quadrant. If the there are fewer than three noisy pixels in the level2.evt file, extra rows are filled as -1
| Pixel properties | Quadrant properties | ||||||
|---|---|---|---|---|---|---|---|
| Quadrant | DetID | PixID | Counts | Sigma | Mean | Median | Sigma |
| A | 10 | 83 | 576518 | 4773.63 | 587 | 576 | 120.7 |
| A | 13 | 248 | 372770 | 3084.89 | 587 | 576 | 120.7 |
| A | 15 | 237 | 32714 | 266.37 | 587 | 576 | 120.7 |
| B | 5 | 255 | 43446 | 374.39 | 590 | 572 | 114.5 |
| B | 0 | 245 | 16548 | 139.51 | 590 | 572 | 114.5 |
| B | 12 | 111 | 14861 | 124.78 | 590 | 572 | 114.5 |
| C | 15 | 214 | 227314 | 1696.54 | 572 | 576 | 133.6 |
| C | 8 | 79 | 201670 | 1504.67 | 572 | 576 | 133.6 |
| C | 3 | 233 | 63624 | 471.75 | 572 | 576 | 133.6 |
| D | 1 | 52 | 773051 | 5585.74 | 562 | 544 | 138.3 |
| D | 1 | 47 | 413419 | 2985.36 | 562 | 544 | 138.3 |
| D | 2 | 249 | 251061 | 1811.4 | 562 | 544 | 138.3 |
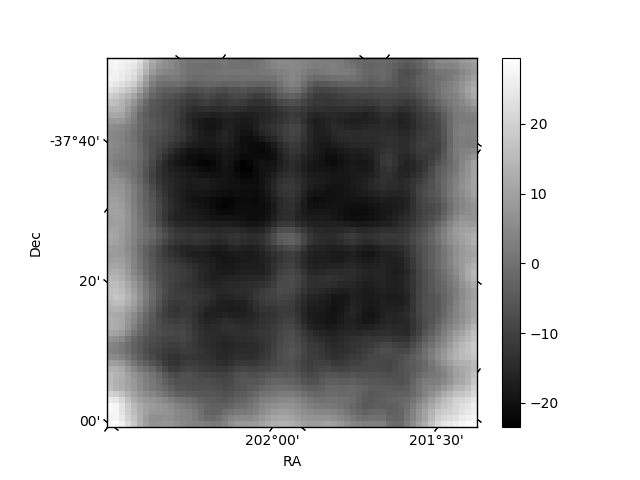
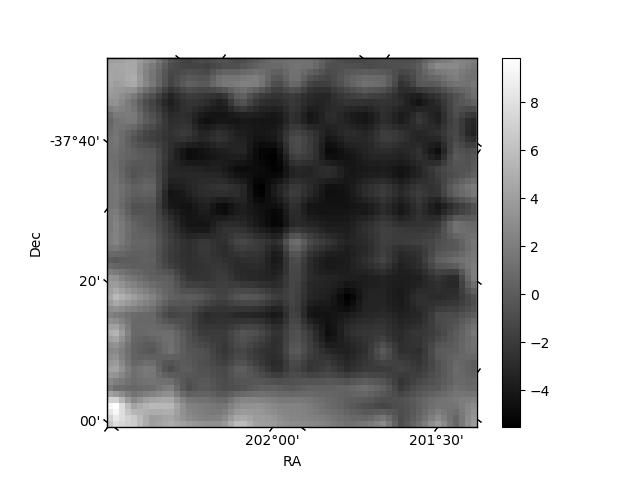
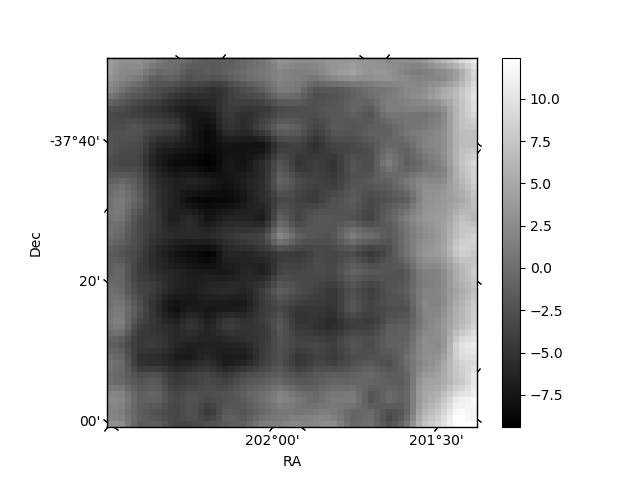
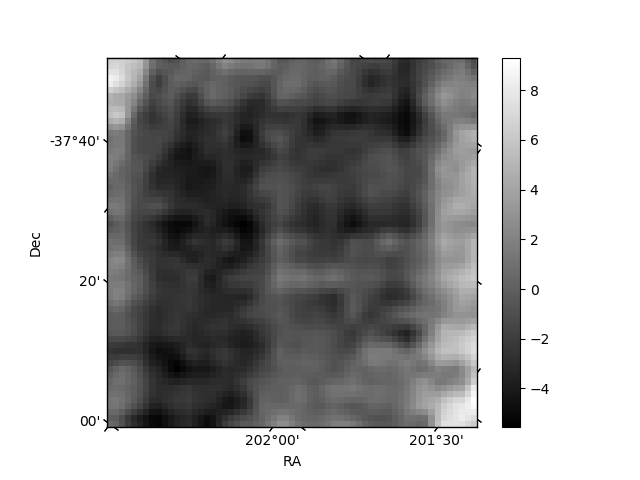
Histogram calculated using DETX and DETY for each event in the final _common_clean file
| Quadrant A | 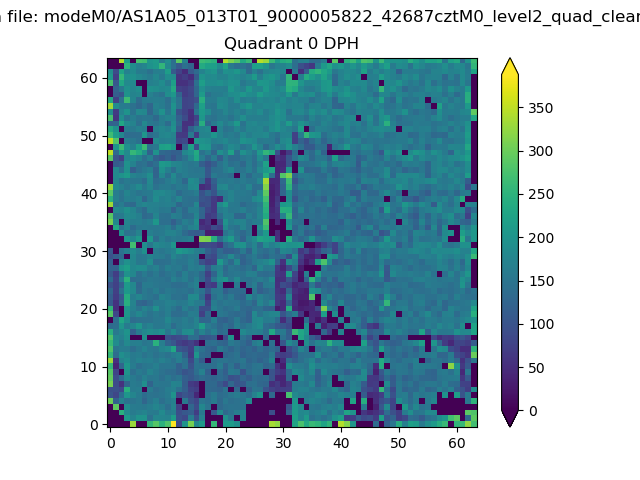 |
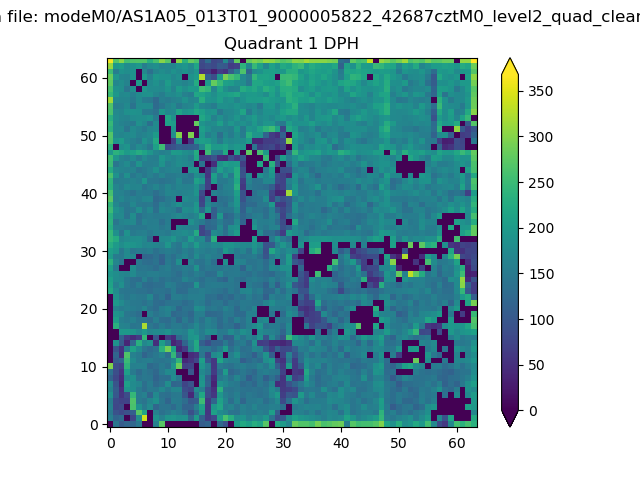 |
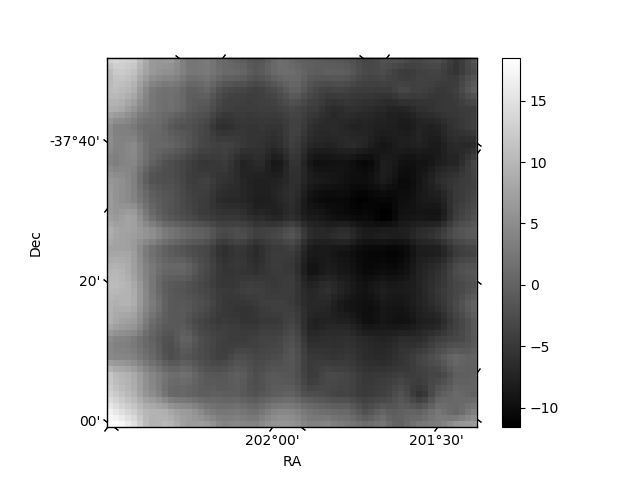
Quadrant B |
|---|---|---|---|
| Quadrant D | 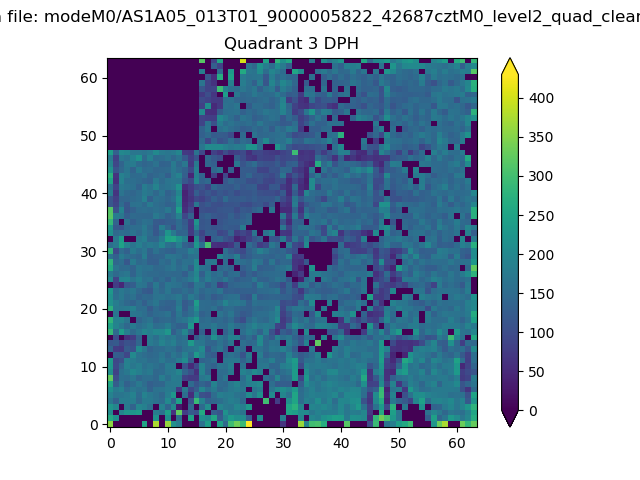 |
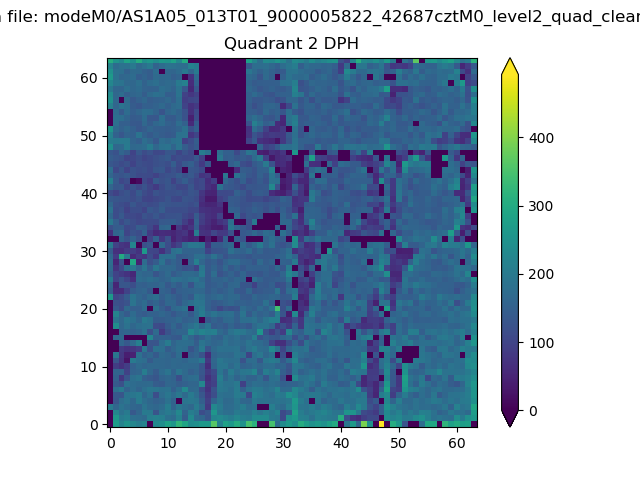 |
Quadrant C |
| Plot type | Count rate plots | Images |
|---|---|---|
| Comparison with Poisson distribution Blue bars denote a histogram of data divided into 1 sec bins. Red curve is a Poisson curve with rate = median count rate of data. |
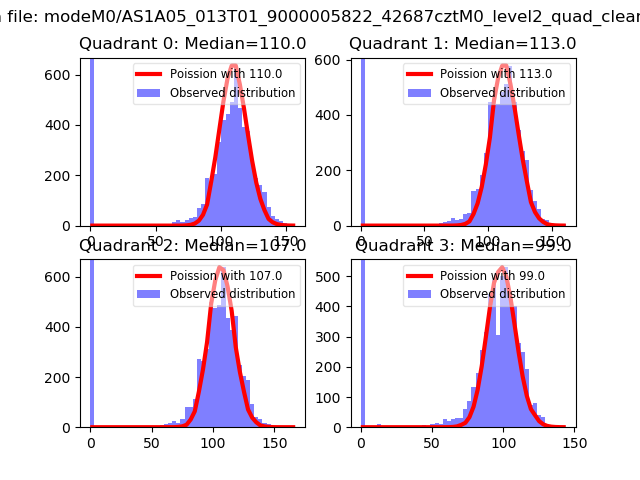 |
 |
| Quadrant-wise count rates Data is divided into 100 sec bins |
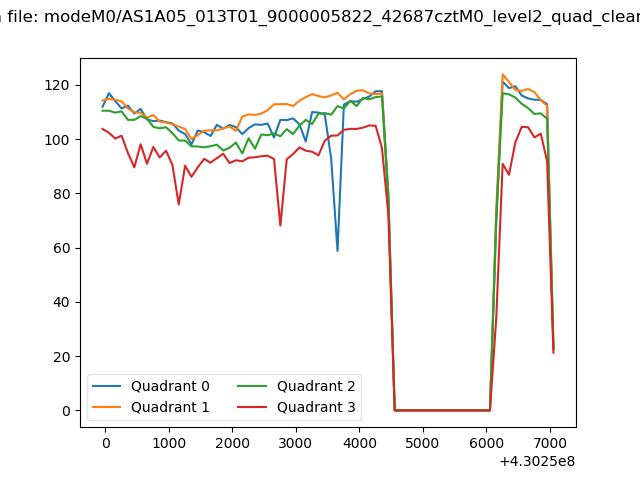 |
|
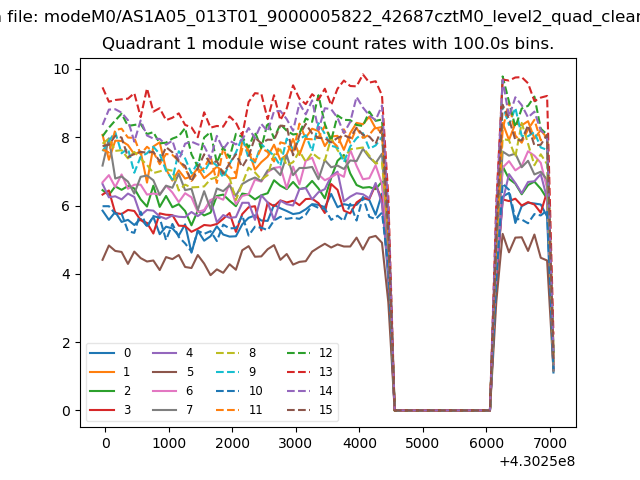
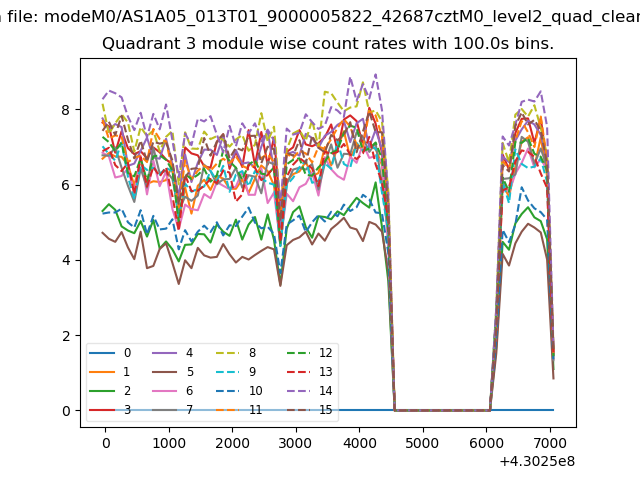
| Module-wise count rates for Quadrant A Data is divided into 100 sec bins |
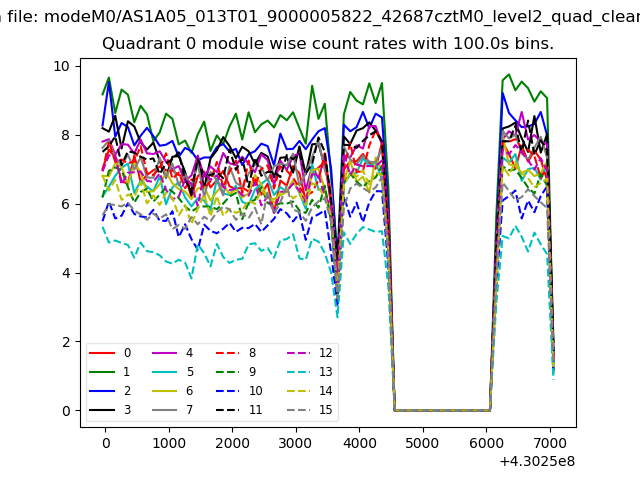 |
 |
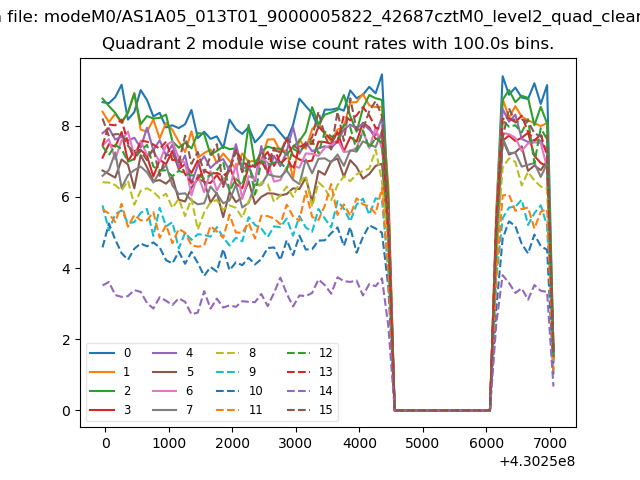
| Module-wise count rates for Quadrant B Data is divided into 100 sec bins |
 |
 |
| Module-wise count rates for Quadrant C Data is divided into 100 sec bins |
 |
 |
| Module-wise count rates for Quadrant D Data is divided into 100 sec bins |
 |
 |
| Parameter | Plot |
|---|---|
| CZT HV Monitor | 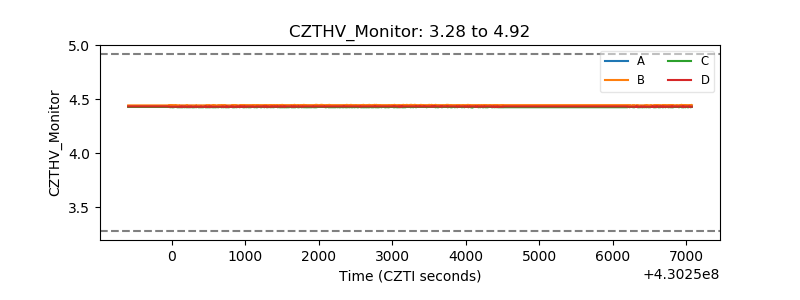 |
| D_VDD | 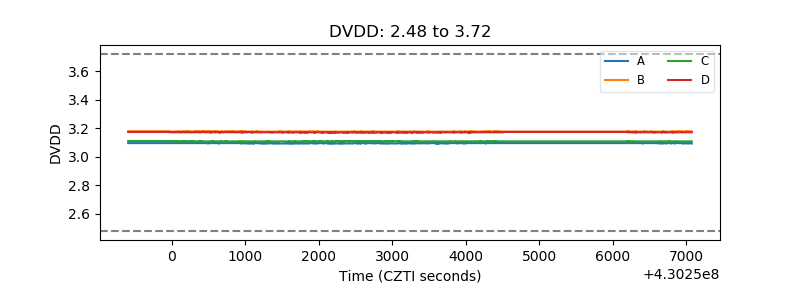 |
| Temperature 1 | 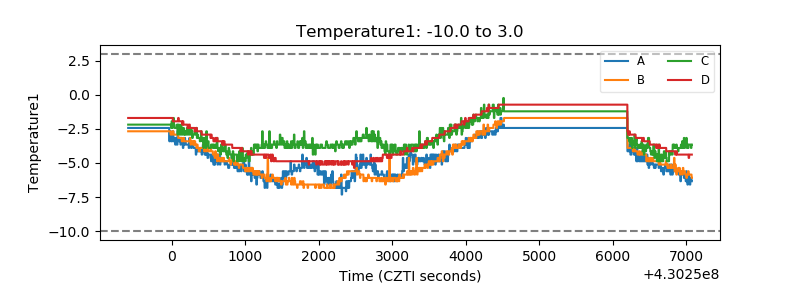 |
| Veto HV Monitor | 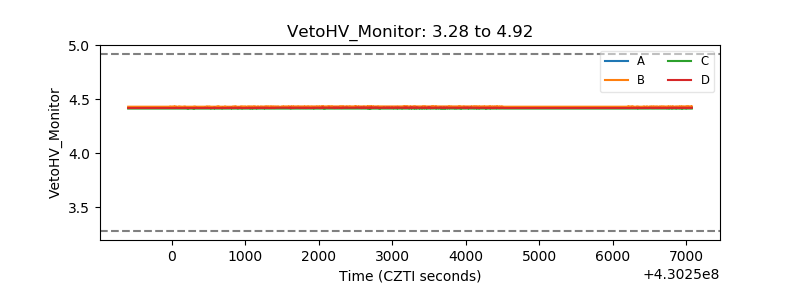 |
| Veto LLD | 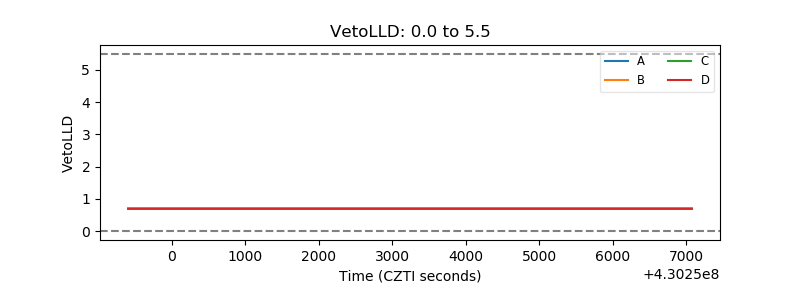 |
| Alpha Counter | 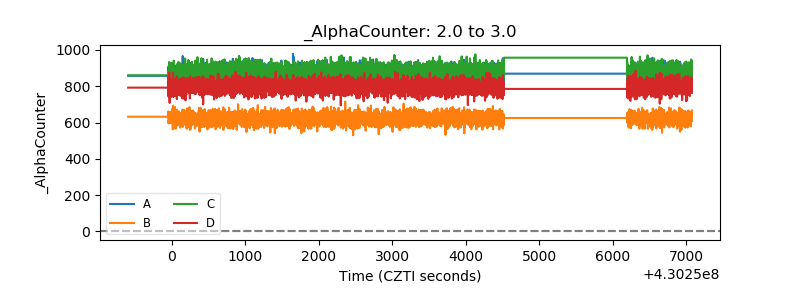 |
| _CPM_Rate | 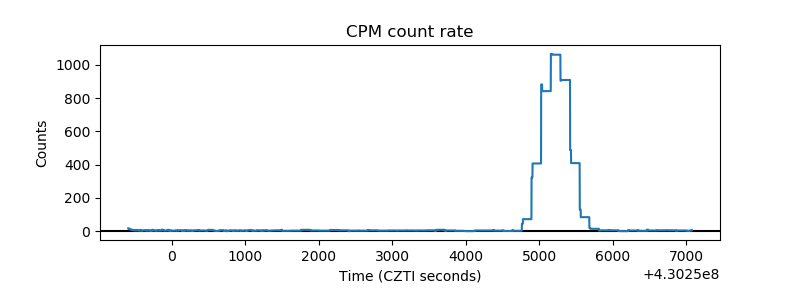 |
| CZT Counter | 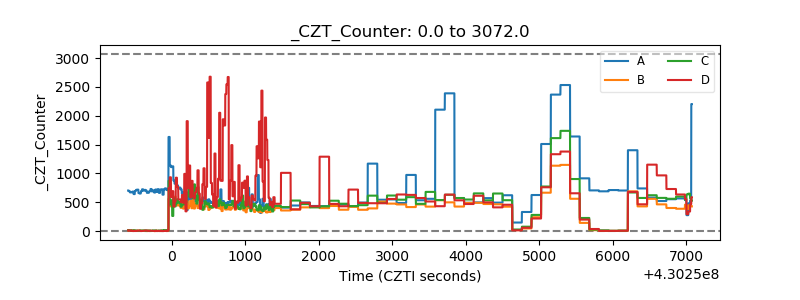 |
| +2.5 Volts monitor | 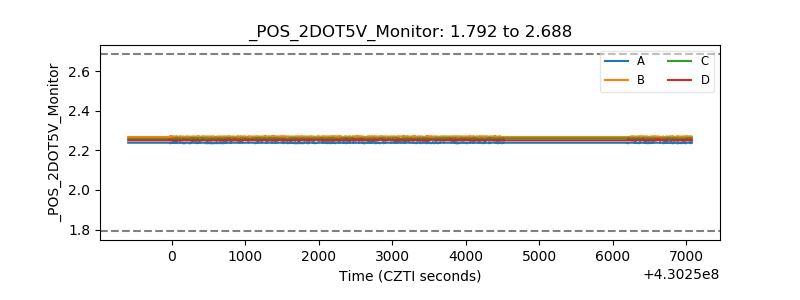 |
| +5 Volts monitor | 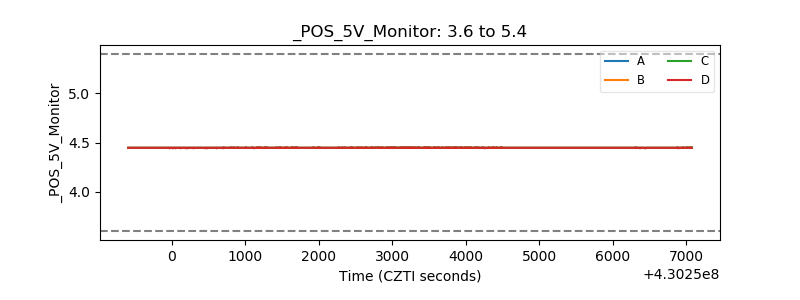 |
| _ROLL_ROT | 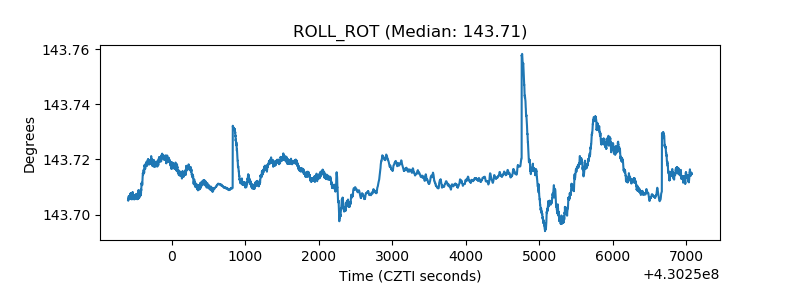 |
| _Roll_DEC | 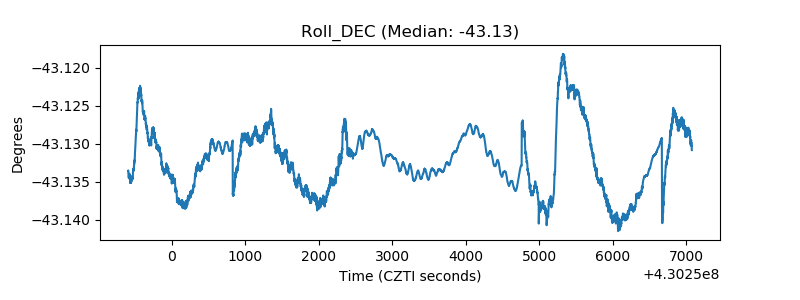 |
| _Roll_RA | 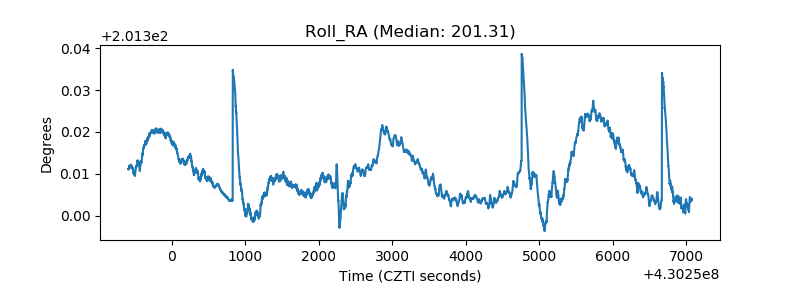 |
| Veto Counter | 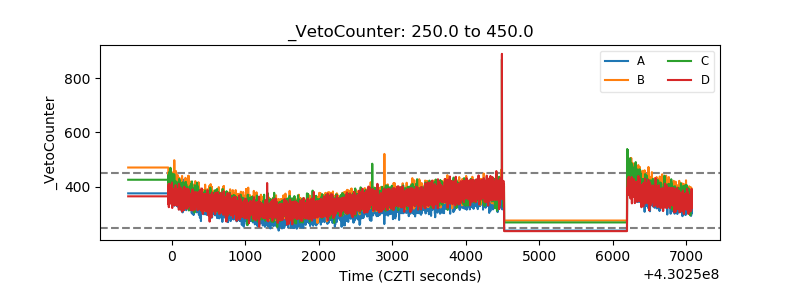 |