| Param | Original file | Final file |
|---|---|---|
| Filename | modeM0/AS1A05_013T01_9000005822_42689cztM0_level2.fits | modeM0/AS1A05_013T01_9000005822_42689cztM0_level2_quad_clean.evt |
| Size (bytes) | 327,715,200 | 86,080,320 |
| Size | 312.5 MB | 82.1 MB |
| Events in quadrant A | 3,011,289 | 585,743 |
| Events in quadrant B | 2,336,366 | 605,190 |
| Events in quadrant C | 2,829,835 | 569,472 |
| Events in quadrant D | 3,549,273 | 482,732 |
| Mode M0 | |||
|---|---|---|---|
| Quadrant | BADHDUFLAG | Total packets | Discarded packets |
| A | 0 | 12048 | 2 |
| B | 0 | 10537 | 2 |
| C | 0 | 11520 | 2 |
| D | 0 | 14150 | 2 |
| Mode M9 | |||
|---|---|---|---|
| Quadrant | BADHDUFLAG | Total packets | Discarded packets |
| A | 0 | 23 | 0 |
| B | 0 | 24 | 0 |
| C | 0 | 24 | 0 |
| D | 0 | 24 | 0 |
| Mode SS | |||
|---|---|---|---|
| Quadrant | BADHDUFLAG | Total packets | Discarded packets |
| A | 0 | 106 | 0 |
| B | 0 | 106 | 0 |
| C | 0 | 106 | 0 |
| D | 0 | 106 | 0 |
| Quadrant | Total seconds | Saturated seconds | Saturation percentage |
|---|---|---|---|
| A | 5186 | 62 | 1.195526% |
| B | 5185 | 4 | 0.077146% |
| C | 5185 | 11 | 0.212150% |
| D | 5185 | 461 | 8.891032% |
Noise dominated data is calculated using 1-second bins in cleaned event files. If a bin has >2000 counts, and if more than 50% of those come from <1% of pixels, then it is considered to be noise-dominated and hence unusable.
| Quadrant | # 1 sec bins | Bins with >0 counts | Bins with >2000 counts | High rate bins dominated by noise | Noise dominated (total time) | Noise dominated (detector-on time) | Marked lightcurve |
|---|---|---|---|---|---|---|---|
| A | 7009 | 5187 | 46 | 46 | 0.66% | 0.89% | 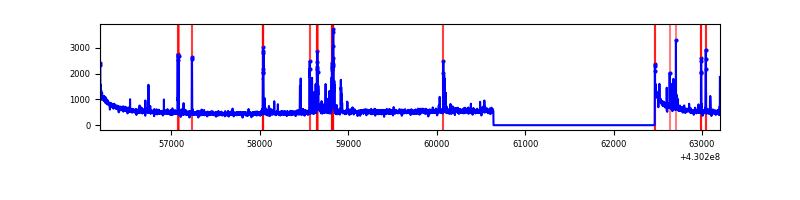 |
| B | 7008 | 5186 | 2 | 2 | 0.03% | 0.04% | 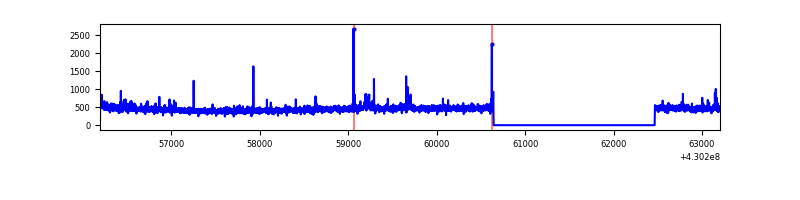 |
| C | 7008 | 5186 | 4 | 4 | 0.06% | 0.08% | 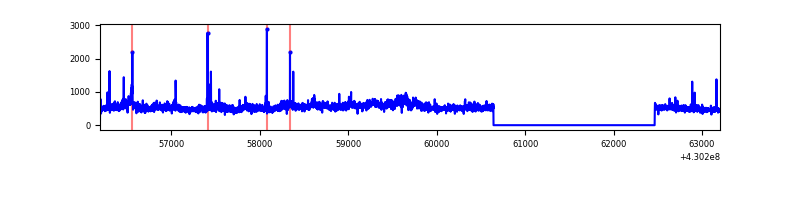 |
| D | 7008 | 5186 | 398 | 398 | 5.68% | 7.67% | 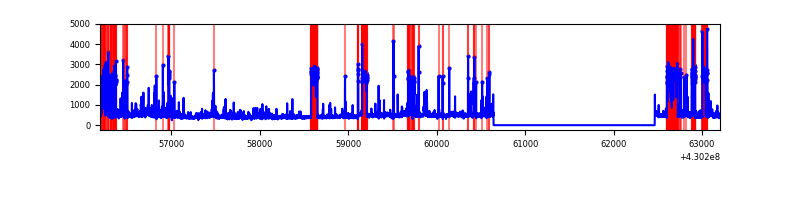 |
Top three noisy pixels from each quadrant. If the there are fewer than three noisy pixels in the level2.evt file, extra rows are filled as -1
| Pixel properties | Quadrant properties | ||||||
|---|---|---|---|---|---|---|---|
| Quadrant | DetID | PixID | Counts | Sigma | Mean | Median | Sigma |
| A | 10 | 83 | 535019 | 4531.68 | 573 | 562 | 117.9 |
| A | 13 | 248 | 190463 | 1610.18 | 573 | 562 | 117.9 |
| A | 15 | 237 | 51794 | 434.4 | 573 | 562 | 117.9 |
| B | 3 | 112 | 18094 | 157.96 | 572 | 555 | 111.0 |
| B | 0 | 245 | 17859 | 155.84 | 572 | 555 | 111.0 |
| B | 5 | 172 | 16336 | 142.13 | 572 | 555 | 111.0 |
| C | 8 | 79 | 316252 | 2449.43 | 556 | 560 | 128.9 |
| C | 15 | 214 | 217918 | 1686.47 | 556 | 560 | 128.9 |
| C | 3 | 233 | 47137 | 361.39 | 556 | 560 | 128.9 |
| D | 1 | 52 | 790663 | 6242.77 | 523 | 508 | 126.6 |
| D | 2 | 249 | 364590 | 2876.5 | 523 | 508 | 126.6 |
| D | 13 | 249 | 191890 | 1512.05 | 523 | 508 | 126.6 |
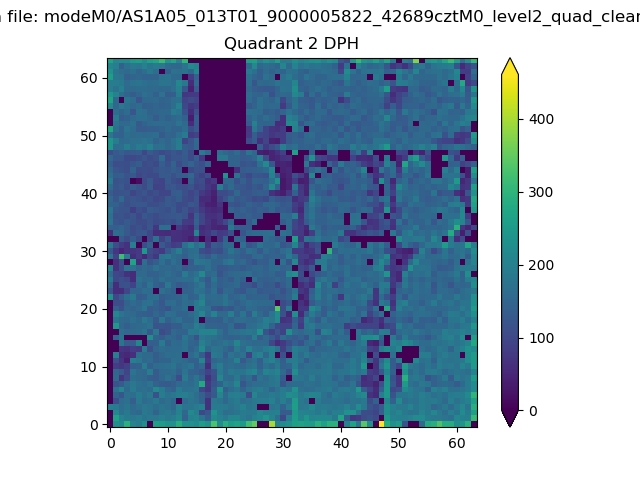
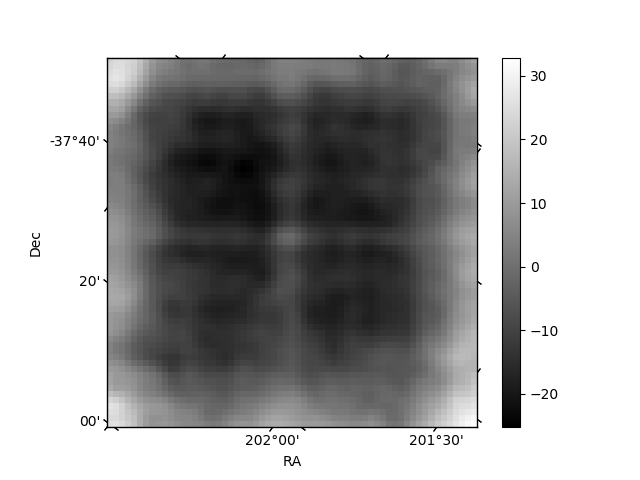
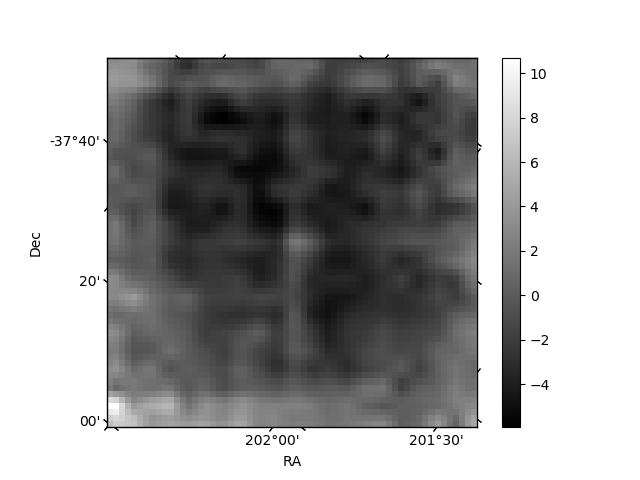
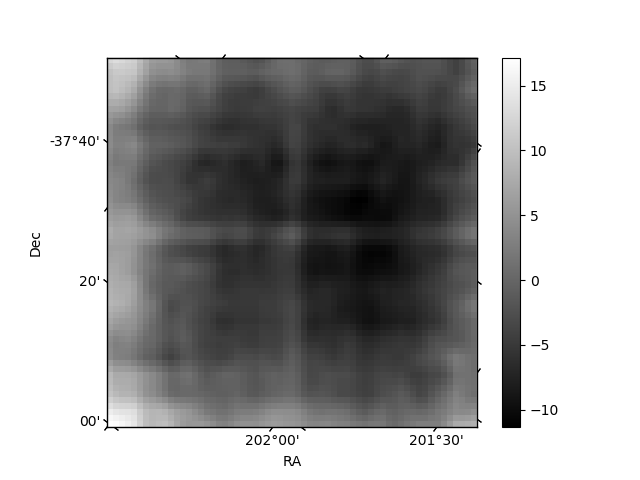
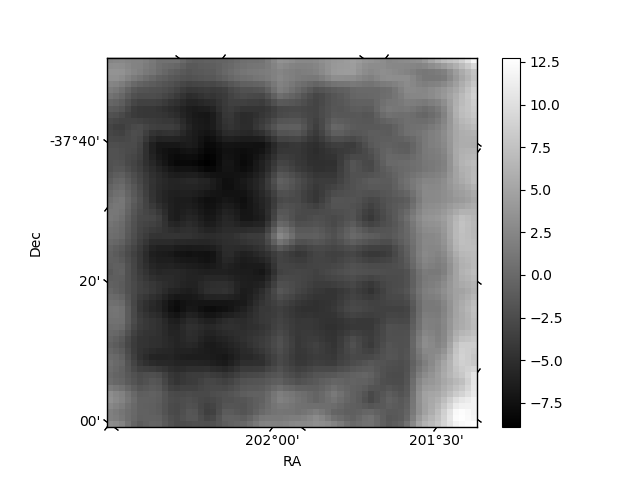
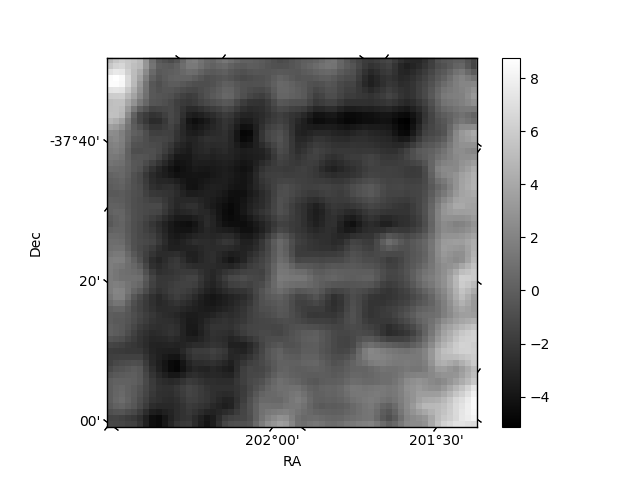
Histogram calculated using DETX and DETY for each event in the final _common_clean file
| Quadrant A | 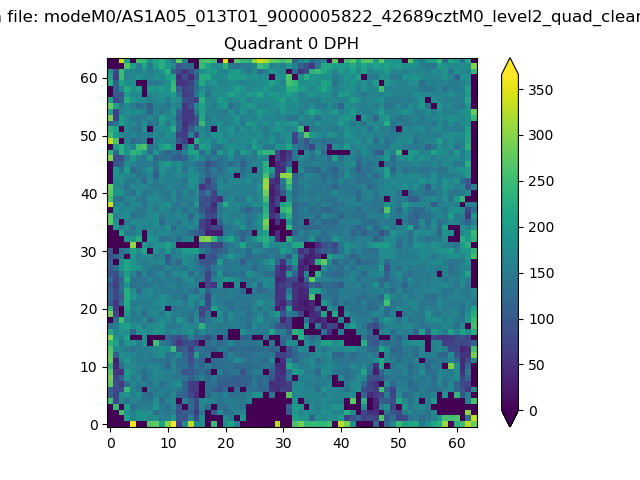 |
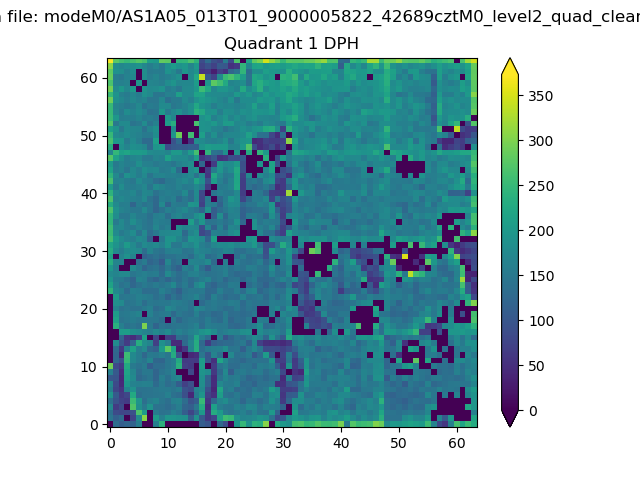 |
Quadrant B |
|---|---|---|---|
| Quadrant D | 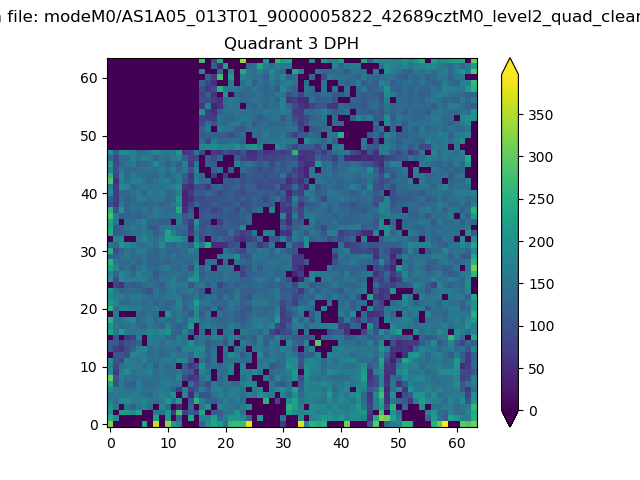 |
 |
Quadrant C |
| Plot type | Count rate plots | Images |
|---|---|---|
| Comparison with Poisson distribution Blue bars denote a histogram of data divided into 1 sec bins. Red curve is a Poisson curve with rate = median count rate of data. |
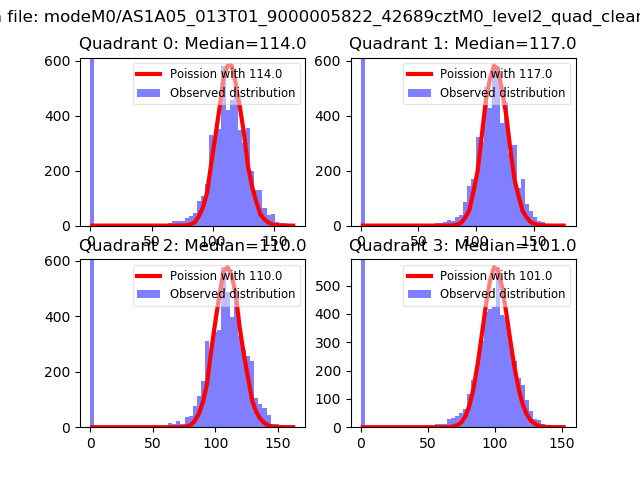 |
 |
| Quadrant-wise count rates Data is divided into 100 sec bins |
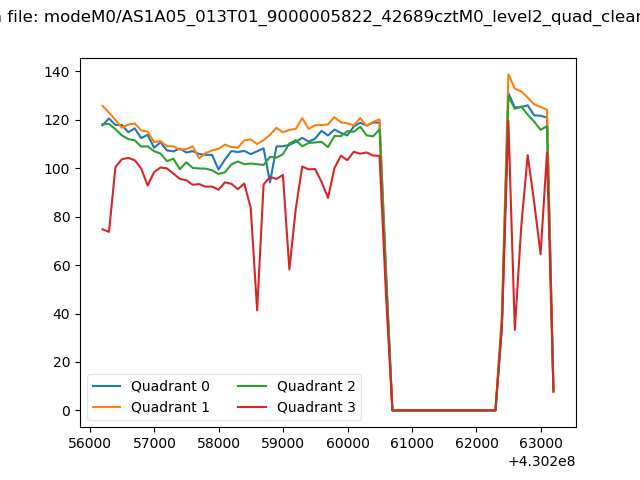 |
|
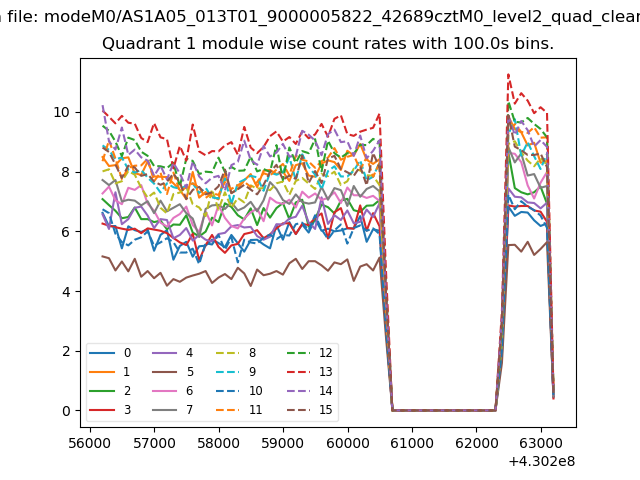
| Module-wise count rates for Quadrant A Data is divided into 100 sec bins |
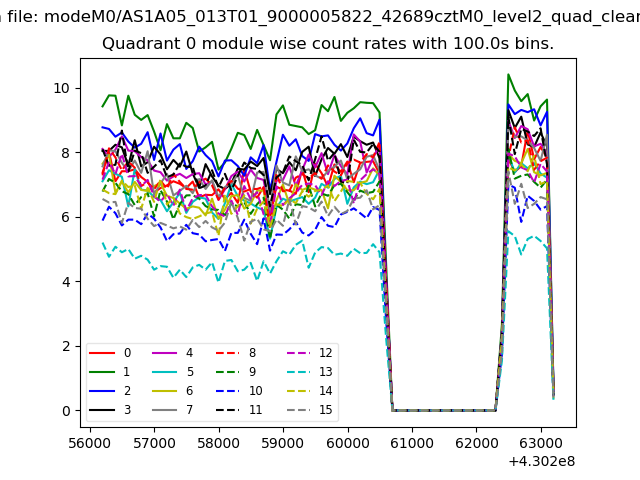 |
 |
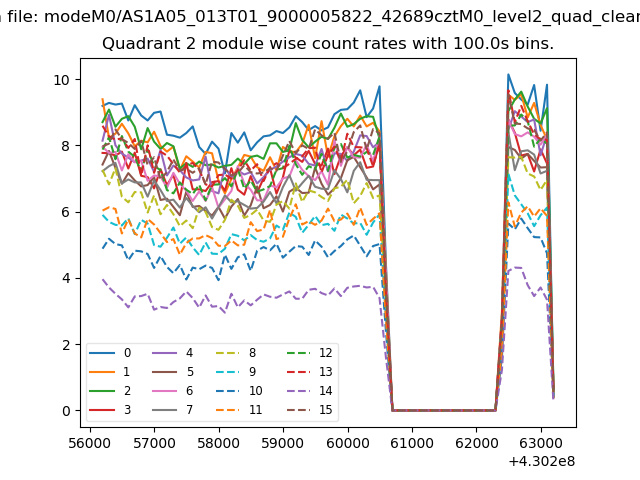
| Module-wise count rates for Quadrant B Data is divided into 100 sec bins |
 |
 |
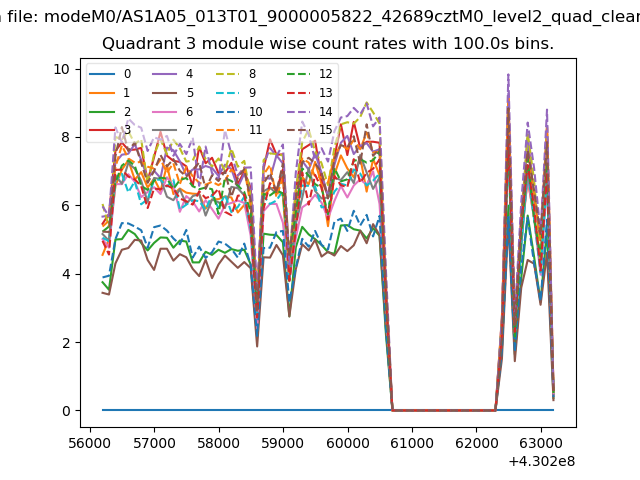
| Module-wise count rates for Quadrant C Data is divided into 100 sec bins |
 |
 |
| Module-wise count rates for Quadrant D Data is divided into 100 sec bins |
 |
 |
| Parameter | Plot |
|---|---|
| CZT HV Monitor | 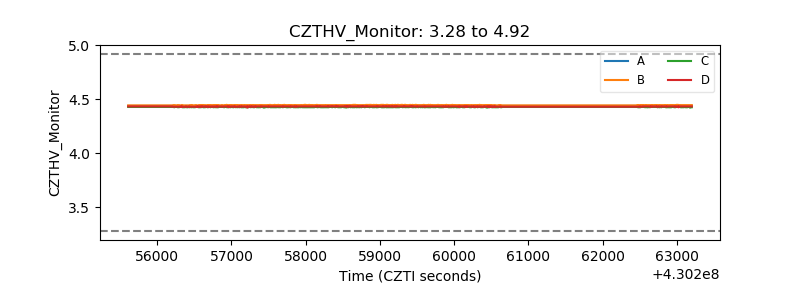 |
| D_VDD | 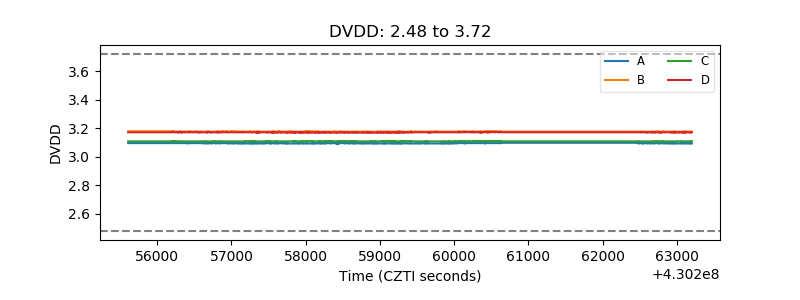 |
| Temperature 1 | 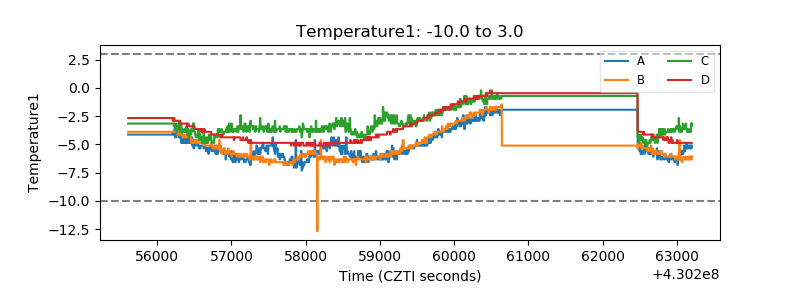 |
| Veto HV Monitor | 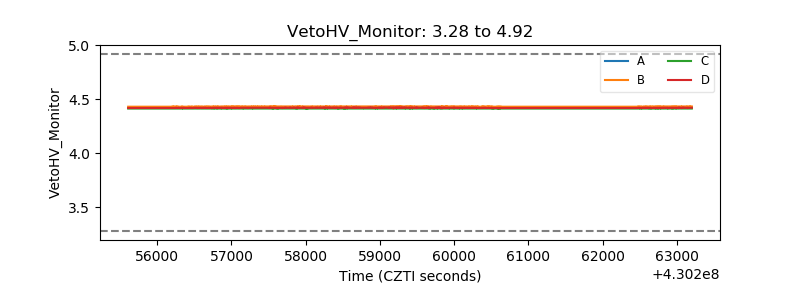 |
| Veto LLD | 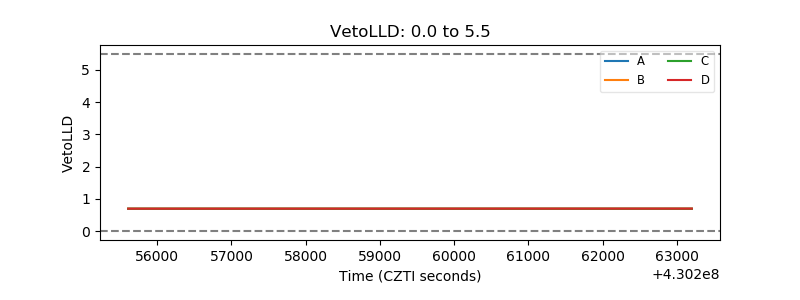 |
| Alpha Counter | 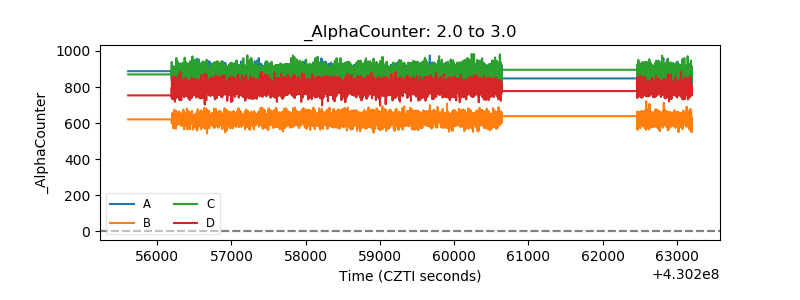 |
| _CPM_Rate | 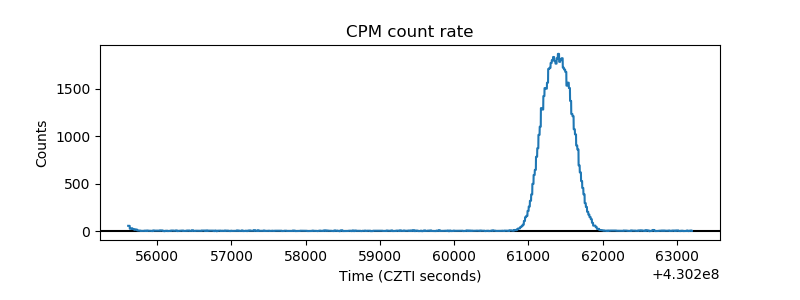 |
| CZT Counter | 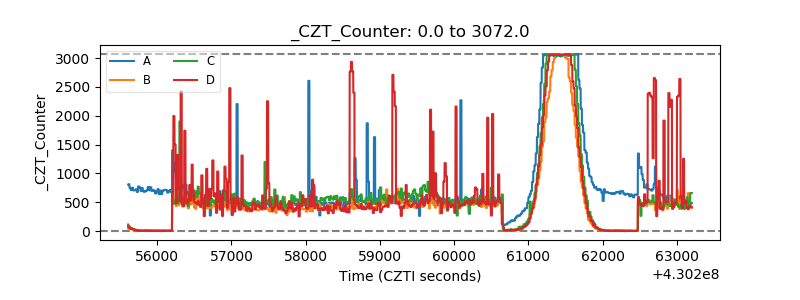 |
| +2.5 Volts monitor | 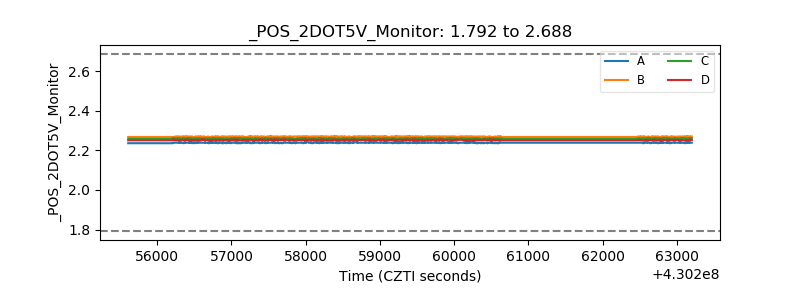 |
| +5 Volts monitor | 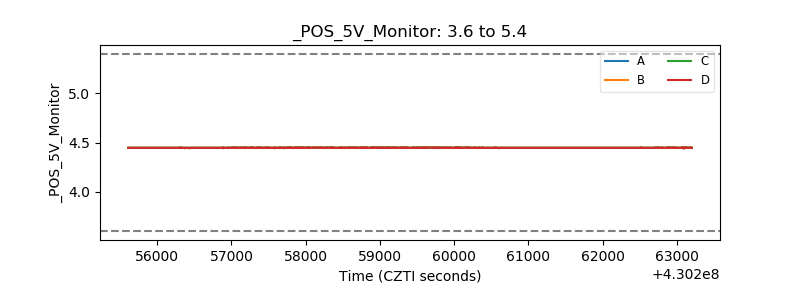 |
| _ROLL_ROT | 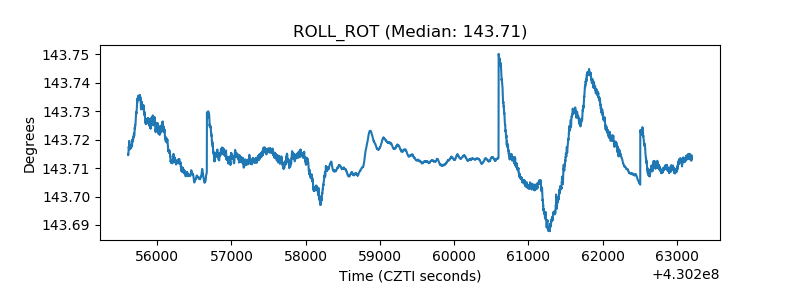 |
| _Roll_DEC | 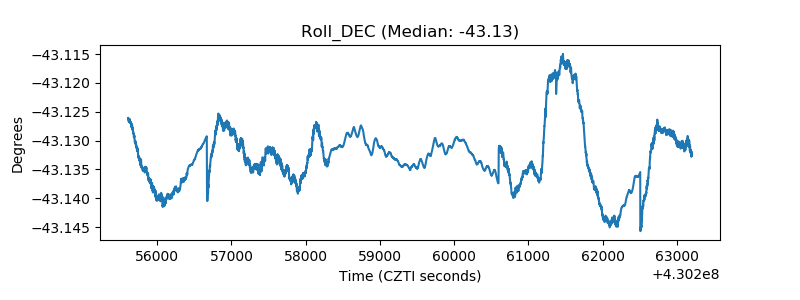 |
| _Roll_RA | 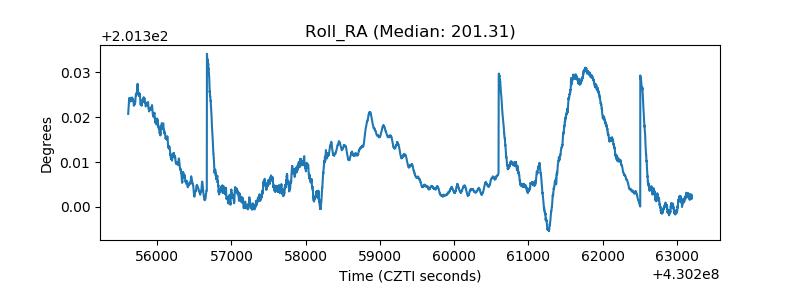 |
| Veto Counter | 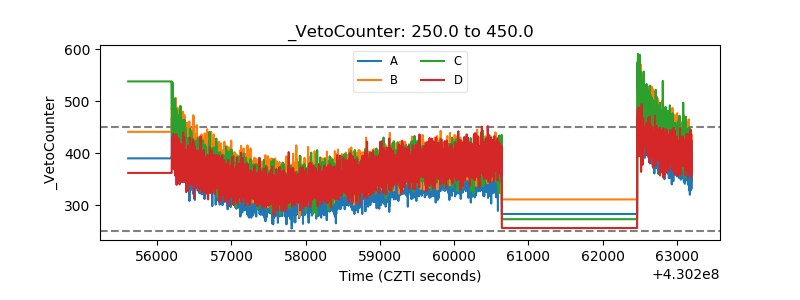 |