| Param | Original file | Final file |
|---|---|---|
| Filename | modeM0/AS1A05_013T01_9000005822_42690cztM0_level2.fits | modeM0/AS1A05_013T01_9000005822_42690cztM0_level2_quad_clean.evt |
| Size (bytes) | 324,711,360 | 90,227,520 |
| Size | 309.7 MB | 86.0 MB |
| Events in quadrant A | 3,000,996 | 619,325 |
| Events in quadrant B | 2,397,185 | 641,305 |
| Events in quadrant C | 2,621,761 | 596,946 |
| Events in quadrant D | 3,596,605 | 512,561 |
| Mode M0 | |||
|---|---|---|---|
| Quadrant | BADHDUFLAG | Total packets | Discarded packets |
| A | 0 | 11925 | 2 |
| B | 0 | 10482 | 2 |
| C | 0 | 10791 | 2 |
| D | 0 | 14258 | 2 |
| Mode M9 | |||
|---|---|---|---|
| Quadrant | BADHDUFLAG | Total packets | Discarded packets |
| A | 0 | 35 | 0 |
| B | 0 | 36 | 0 |
| C | 0 | 36 | 0 |
| D | 0 | 36 | 0 |
| Mode SS | |||
|---|---|---|---|
| Quadrant | BADHDUFLAG | Total packets | Discarded packets |
| A | 0 | 104 | 0 |
| B | 0 | 104 | 0 |
| C | 0 | 104 | 0 |
| D | 0 | 104 | 0 |
| Quadrant | Total seconds | Saturated seconds | Saturation percentage |
|---|---|---|---|
| A | 5172 | 39 | 0.754060% |
| B | 5172 | 7 | 0.135344% |
| C | 5172 | 13 | 0.251353% |
| D | 5172 | 405 | 7.830626% |
Noise dominated data is calculated using 1-second bins in cleaned event files. If a bin has >2000 counts, and if more than 50% of those come from <1% of pixels, then it is considered to be noise-dominated and hence unusable.
| Quadrant | # 1 sec bins | Bins with >0 counts | Bins with >2000 counts | High rate bins dominated by noise | Noise dominated (total time) | Noise dominated (detector-on time) | Marked lightcurve |
|---|---|---|---|---|---|---|---|
| A | 7115 | 5173 | 22 | 22 | 0.31% | 0.43% | 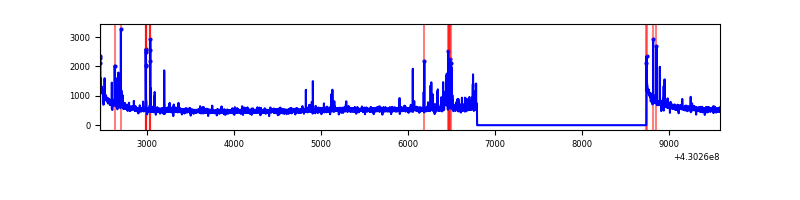 |
| B | 7115 | 5173 | 1 | 1 | 0.01% | 0.02% | 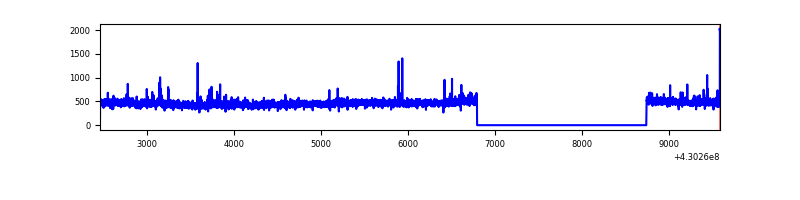 |
| C | 7115 | 5173 | 11 | 11 | 0.15% | 0.21% | 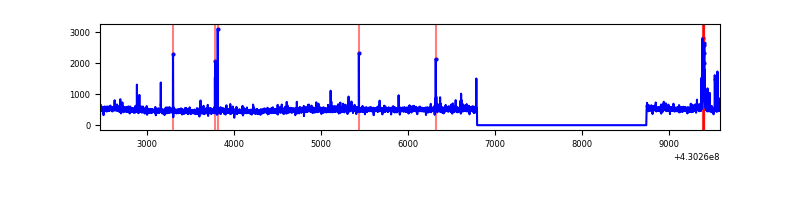 |
| D | 7115 | 5173 | 348 | 348 | 4.89% | 6.73% | 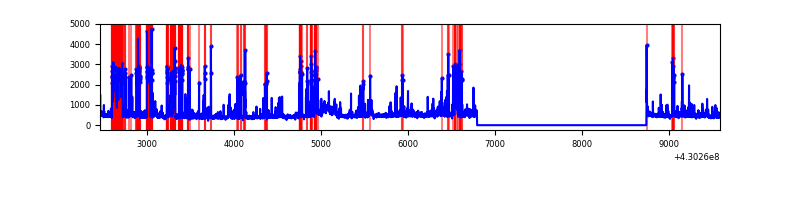 |
Top three noisy pixels from each quadrant. If the there are fewer than three noisy pixels in the level2.evt file, extra rows are filled as -1
| Pixel properties | Quadrant properties | ||||||
|---|---|---|---|---|---|---|---|
| Quadrant | DetID | PixID | Counts | Sigma | Mean | Median | Sigma |
| A | 10 | 83 | 540287 | 4485.04 | 592 | 581 | 120.3 |
| A | 13 | 248 | 83584 | 689.77 | 592 | 581 | 120.3 |
| A | 15 | 237 | 45898 | 376.59 | 592 | 581 | 120.3 |
| B | 5 | 172 | 24140 | 208.63 | 593 | 578 | 112.9 |
| B | 0 | 245 | 21114 | 181.84 | 593 | 578 | 112.9 |
| B | 5 | 255 | 14141 | 120.09 | 593 | 578 | 112.9 |
| C | 15 | 214 | 217690 | 1629.08 | 577 | 581 | 133.3 |
| C | 14 | 254 | 86995 | 648.41 | 577 | 581 | 133.3 |
| C | 3 | 233 | 26572 | 195.02 | 577 | 581 | 133.3 |
| D | 1 | 52 | 968073 | 7365.37 | 544 | 529 | 131.4 |
| D | 2 | 249 | 417505 | 3174.21 | 544 | 529 | 131.4 |
| D | 1 | 47 | 47632 | 358.57 | 544 | 529 | 131.4 |
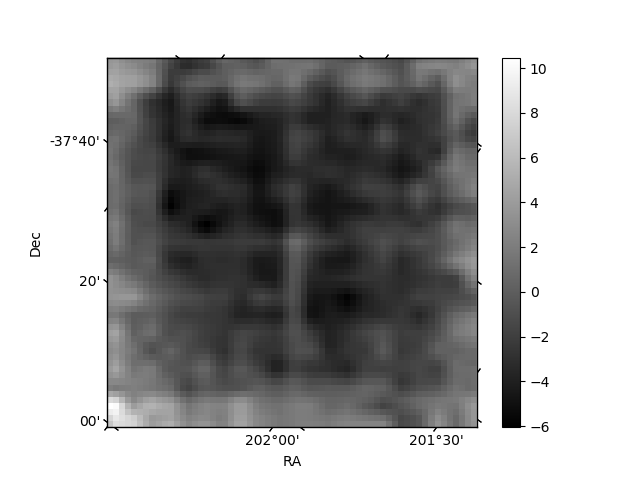
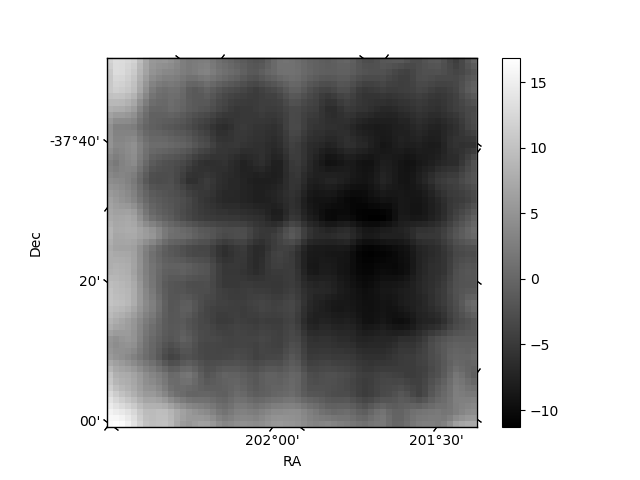
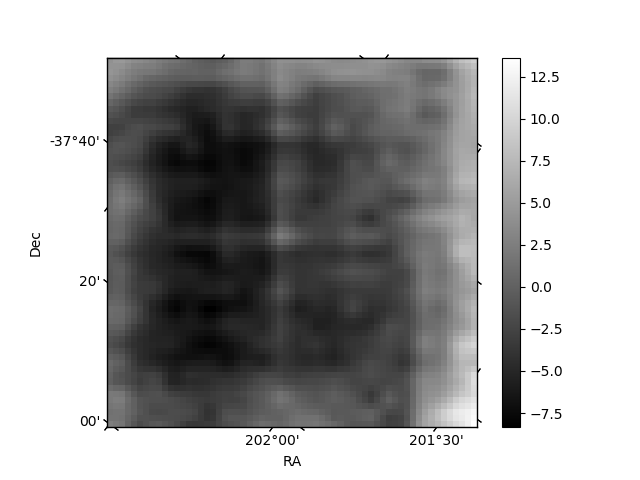
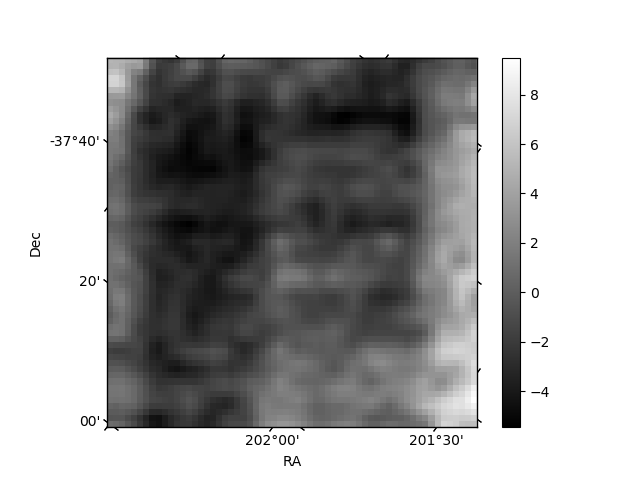
Histogram calculated using DETX and DETY for each event in the final _common_clean file
| Quadrant A | 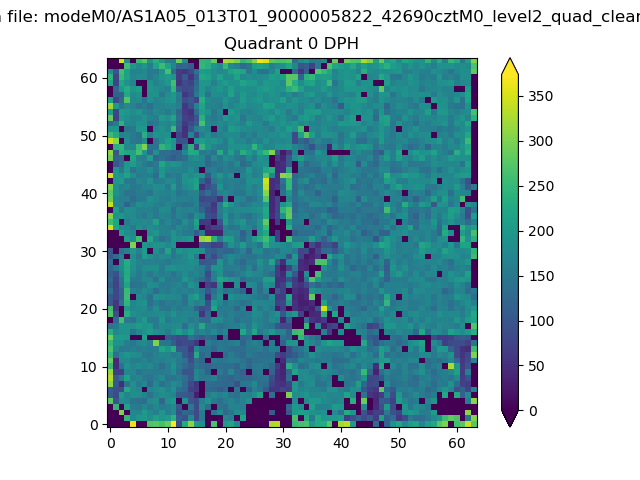 |
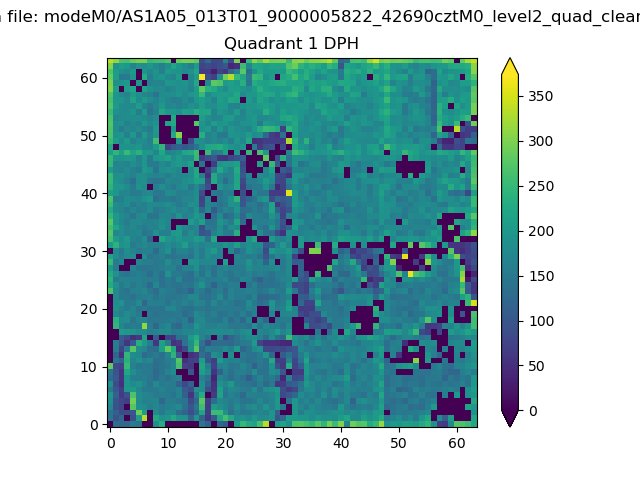 |
Quadrant B |
|---|---|---|---|
| Quadrant D | 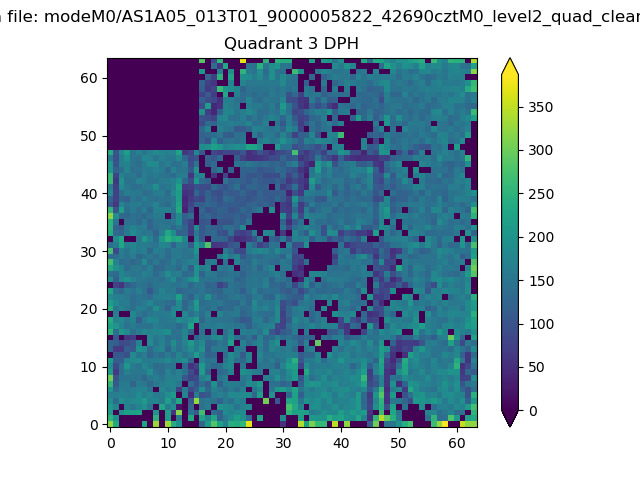 |
 |
Quadrant C |
| Plot type | Count rate plots | Images |
|---|---|---|
| Comparison with Poisson distribution Blue bars denote a histogram of data divided into 1 sec bins. Red curve is a Poisson curve with rate = median count rate of data. |
 |
 |
| Quadrant-wise count rates Data is divided into 100 sec bins |
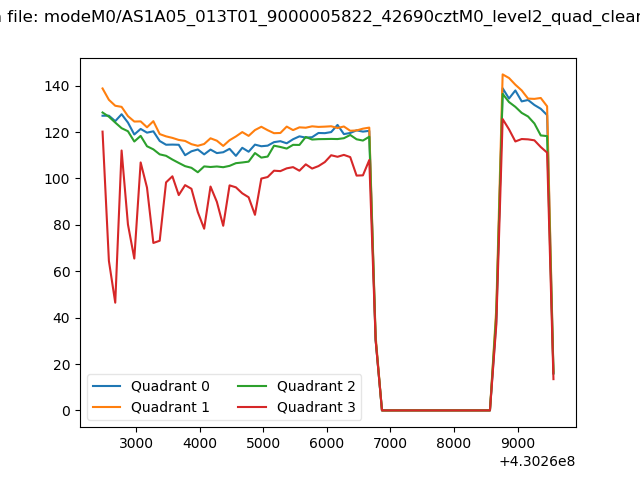 |
|
| Module-wise count rates for Quadrant A Data is divided into 100 sec bins |
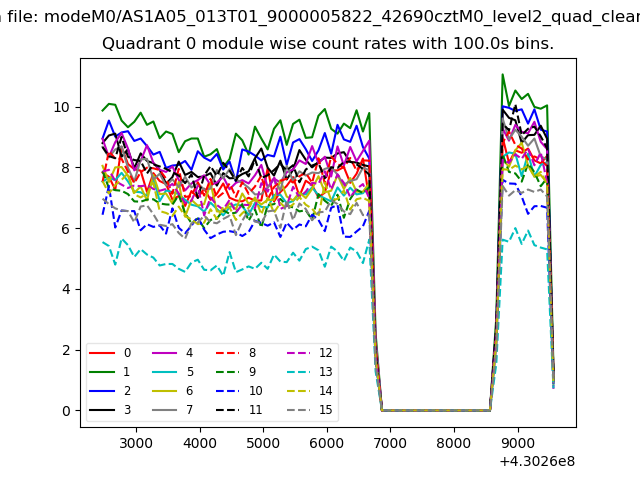 |
 |
| Module-wise count rates for Quadrant B Data is divided into 100 sec bins |
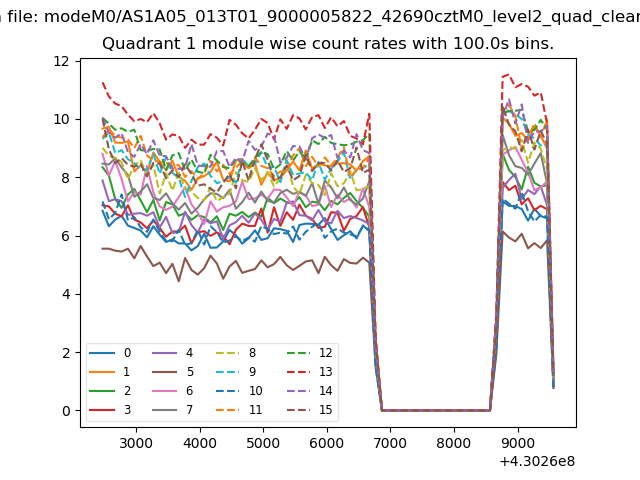 |
 |
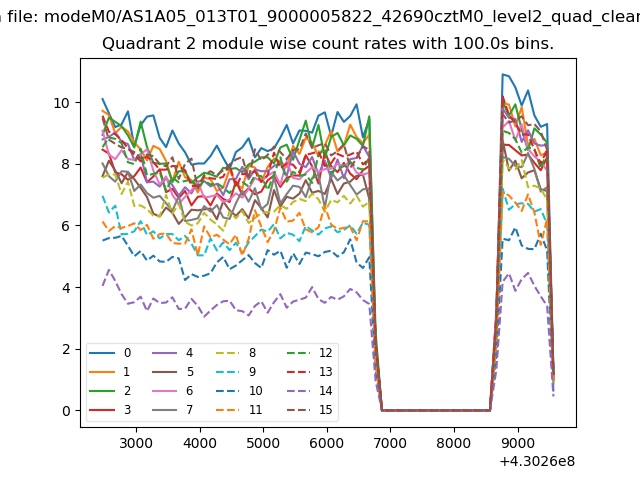
| Module-wise count rates for Quadrant C Data is divided into 100 sec bins |
 |
 |
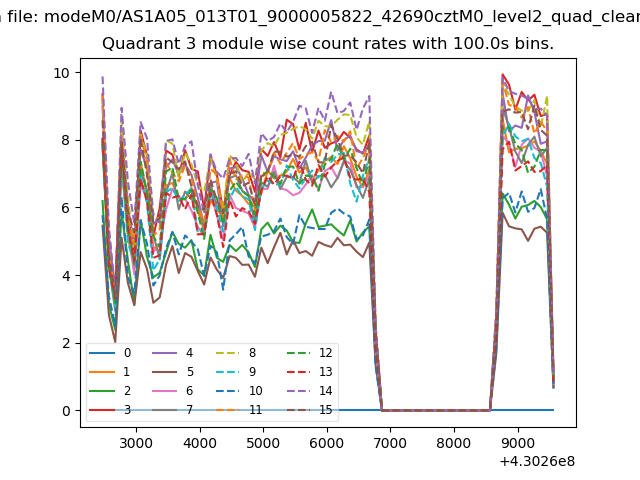
| Module-wise count rates for Quadrant D Data is divided into 100 sec bins |
 |
 |
| Parameter | Plot |
|---|---|
| CZT HV Monitor | 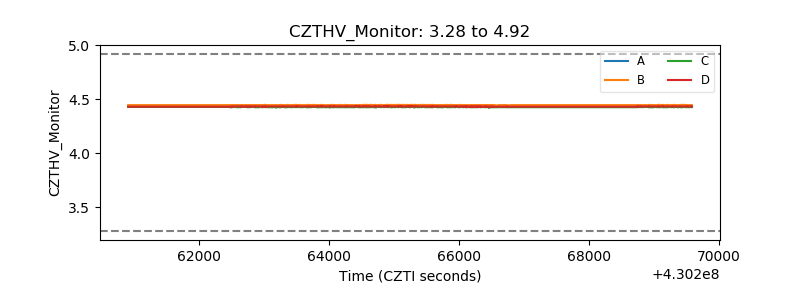 |
| D_VDD | 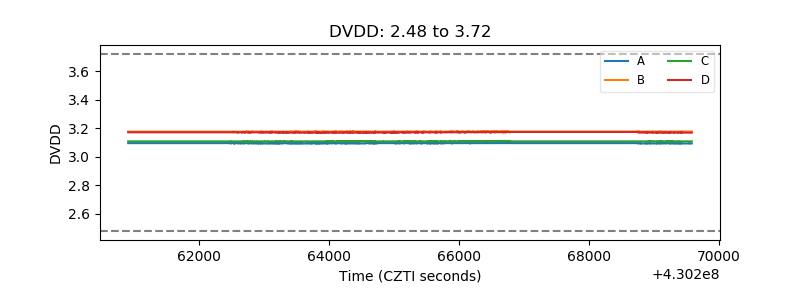 |
| Temperature 1 | 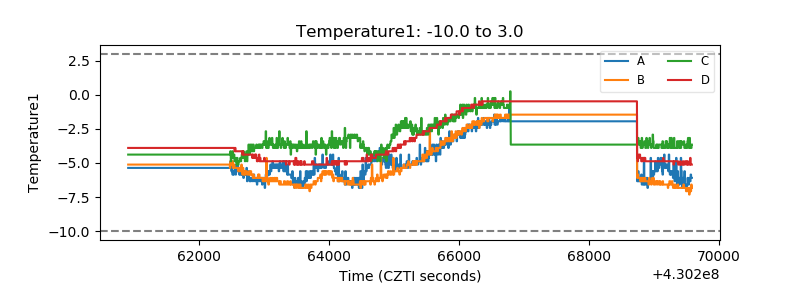 |
| Veto HV Monitor |  |
| Veto LLD | 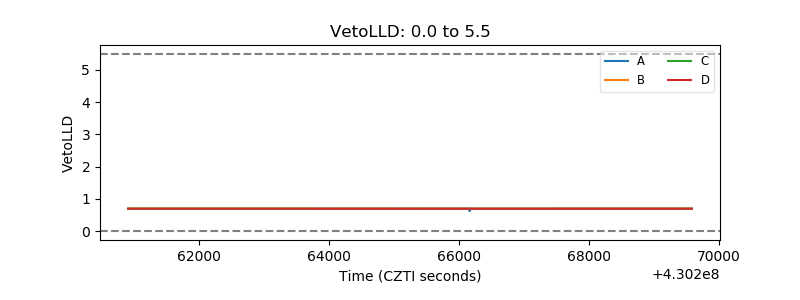 |
| Alpha Counter | 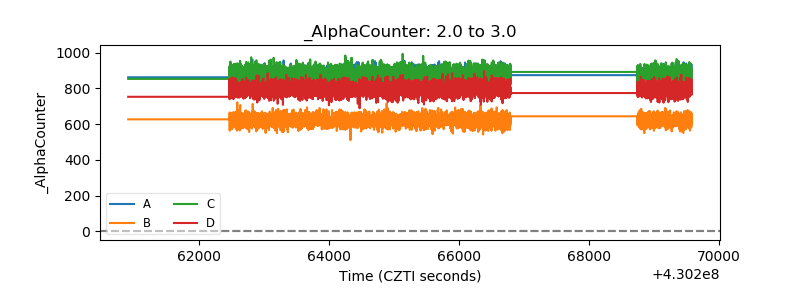 |
| _CPM_Rate |  |
| CZT Counter |  |
| +2.5 Volts monitor | 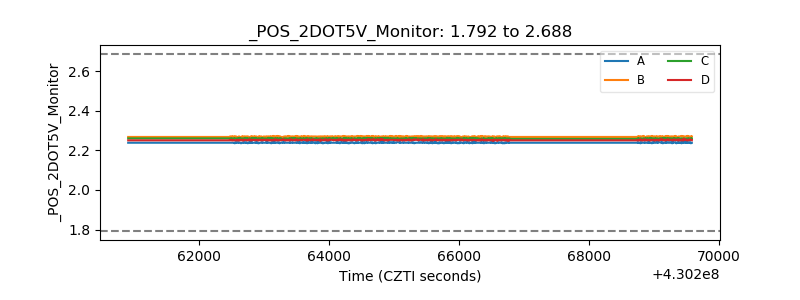 |
| +5 Volts monitor | 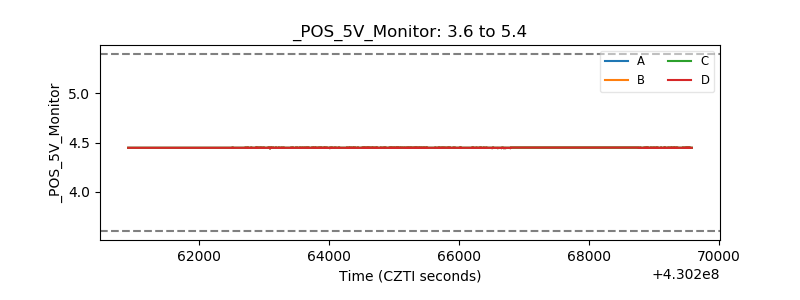 |
| _ROLL_ROT | 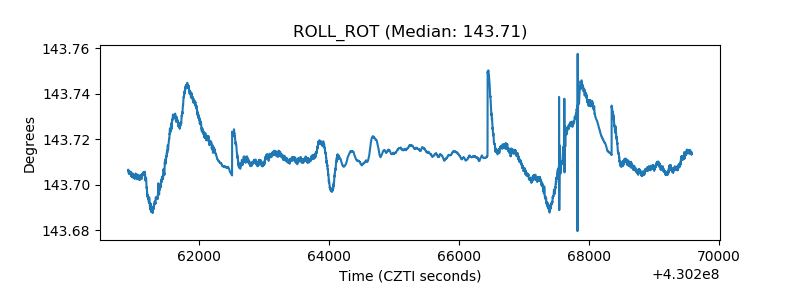 |
| _Roll_DEC | 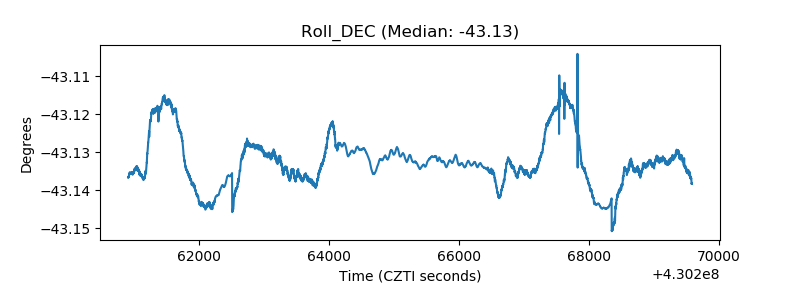 |
| _Roll_RA | 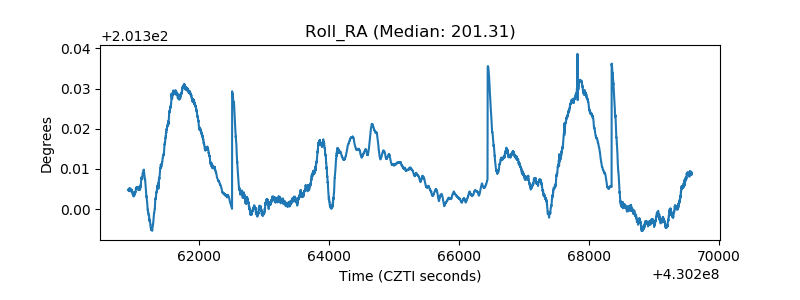 |
| Veto Counter | 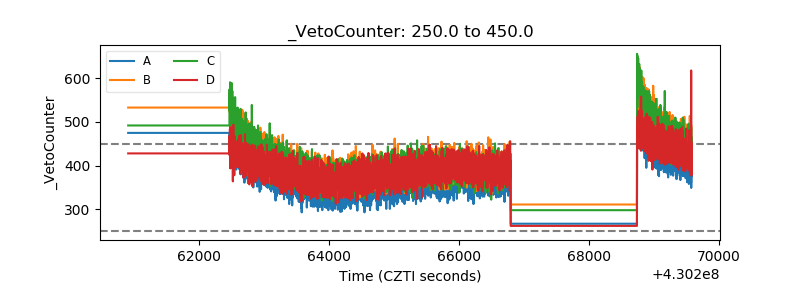 |