| Param | Original file | Final file |
|---|---|---|
| Filename | modeM0/AS1A05_013T01_9000005822_42691cztM0_level2.fits | modeM0/AS1A05_013T01_9000005822_42691cztM0_level2_quad_clean.evt |
| Size (bytes) | 392,201,280 | 87,799,680 |
| Size | 374.0 MB | 83.7 MB |
| Events in quadrant A | 3,499,178 | 618,106 |
| Events in quadrant B | 2,409,115 | 648,866 |
| Events in quadrant C | 5,358,835 | 494,220 |
| Events in quadrant D | 2,861,779 | 547,171 |
| Mode M0 | |||
|---|---|---|---|
| Quadrant | BADHDUFLAG | Total packets | Discarded packets |
| A | 0 | 13515 | 2 |
| B | 0 | 10255 | 2 |
| C | 0 | 19059 | 2 |
| D | 0 | 11822 | 2 |
| Mode M9 | |||
|---|---|---|---|
| Quadrant | BADHDUFLAG | Total packets | Discarded packets |
| A | 0 | 35 | 0 |
| B | 0 | 36 | 0 |
| C | 0 | 36 | 0 |
| D | 0 | 36 | 0 |
| Mode SS | |||
|---|---|---|---|
| Quadrant | BADHDUFLAG | Total packets | Discarded packets |
| A | 0 | 102 | 0 |
| B | 0 | 102 | 0 |
| C | 0 | 102 | 0 |
| D | 0 | 102 | 0 |
| Quadrant | Total seconds | Saturated seconds | Saturation percentage |
|---|---|---|---|
| A | 4999 | 146 | 2.920584% |
| B | 4998 | 14 | 0.280112% |
| C | 4998 | 1003 | 20.068027% |
| D | 4998 | 101 | 2.020808% |
Noise dominated data is calculated using 1-second bins in cleaned event files. If a bin has >2000 counts, and if more than 50% of those come from <1% of pixels, then it is considered to be noise-dominated and hence unusable.
| Quadrant | # 1 sec bins | Bins with >0 counts | Bins with >2000 counts | High rate bins dominated by noise | Noise dominated (total time) | Noise dominated (detector-on time) | Marked lightcurve |
|---|---|---|---|---|---|---|---|
| A | 7062 | 5000 | 102 | 102 | 1.44% | 2.04% | 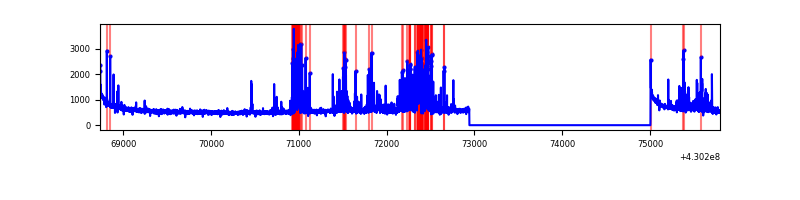 |
| B | 7061 | 4999 | 2 | 2 | 0.03% | 0.04% | 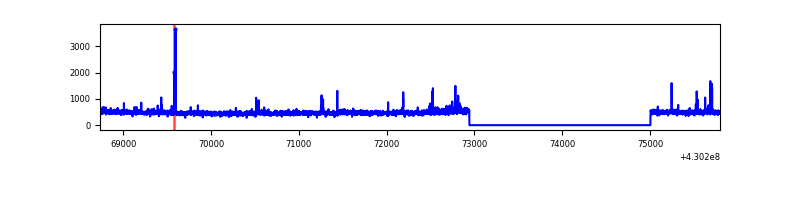 |
| C | 7061 | 4999 | 973 | 973 | 13.78% | 19.46% | 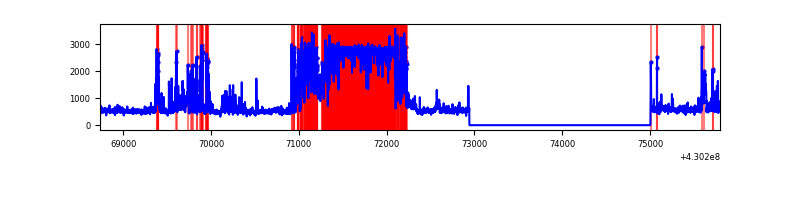 |
| D | 7061 | 4999 | 95 | 95 | 1.35% | 1.90% | 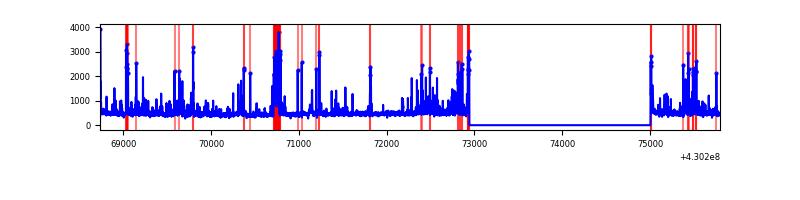 |
Top three noisy pixels from each quadrant. If the there are fewer than three noisy pixels in the level2.evt file, extra rows are filled as -1
| Pixel properties | Quadrant properties | ||||||
|---|---|---|---|---|---|---|---|
| Quadrant | DetID | PixID | Counts | Sigma | Mean | Median | Sigma |
| A | 13 | 248 | 562259 | 4662.93 | 587 | 576 | 120.5 |
| A | 10 | 83 | 530646 | 4400.49 | 587 | 576 | 120.5 |
| A | 7 | 3 | 100730 | 831.45 | 587 | 576 | 120.5 |
| B | 5 | 172 | 43135 | 381.0 | 589 | 575 | 111.7 |
| B | 0 | 245 | 15779 | 136.11 | 589 | 575 | 111.7 |
| B | 12 | 111 | 13738 | 117.84 | 589 | 575 | 111.7 |
| C | 14 | 254 | 2938097 | 24830.5 | 511 | 515 | 118.3 |
| C | 15 | 214 | 189911 | 1600.91 | 511 | 515 | 118.3 |
| C | 0 | 239 | 110285 | 927.85 | 511 | 515 | 118.3 |
| D | 1 | 52 | 297892 | 2131.91 | 569 | 553 | 139.5 |
| D | 12 | 6 | 199629 | 1427.37 | 569 | 553 | 139.5 |
| D | 2 | 249 | 101226 | 721.82 | 569 | 553 | 139.5 |
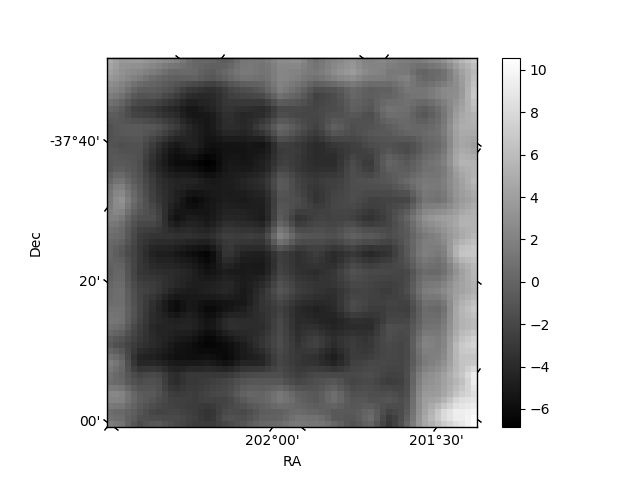
Histogram calculated using DETX and DETY for each event in the final _common_clean file
| Quadrant A | 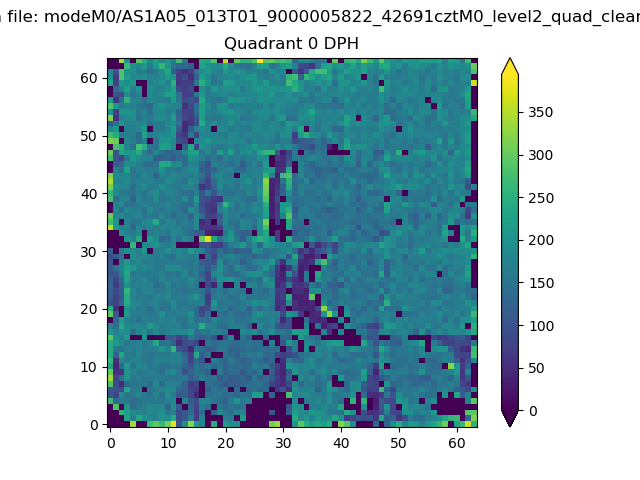 |
 |
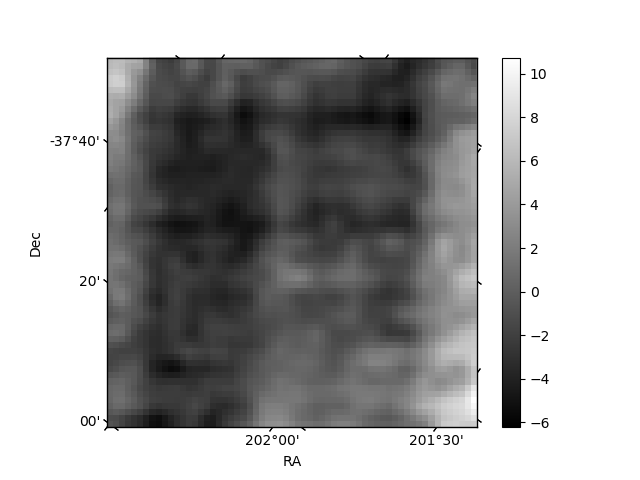
Quadrant B |
|---|---|---|---|
| Quadrant D | 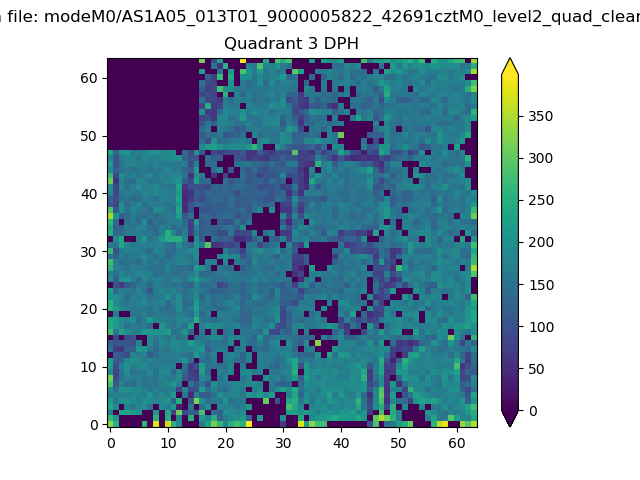 |
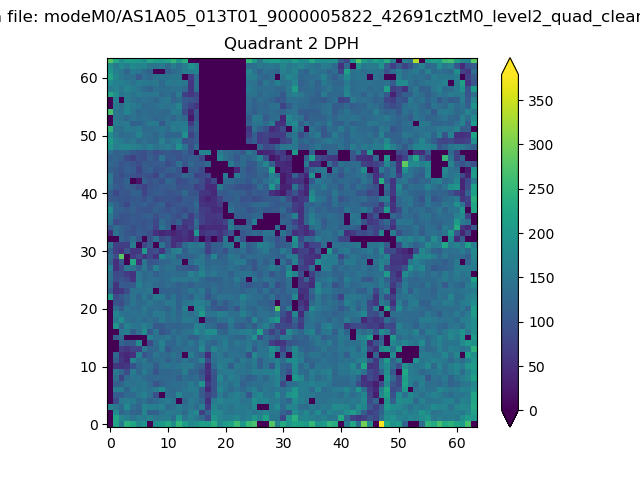 |
Quadrant C |
| Plot type | Count rate plots | Images |
|---|---|---|
| Comparison with Poisson distribution Blue bars denote a histogram of data divided into 1 sec bins. Red curve is a Poisson curve with rate = median count rate of data. |
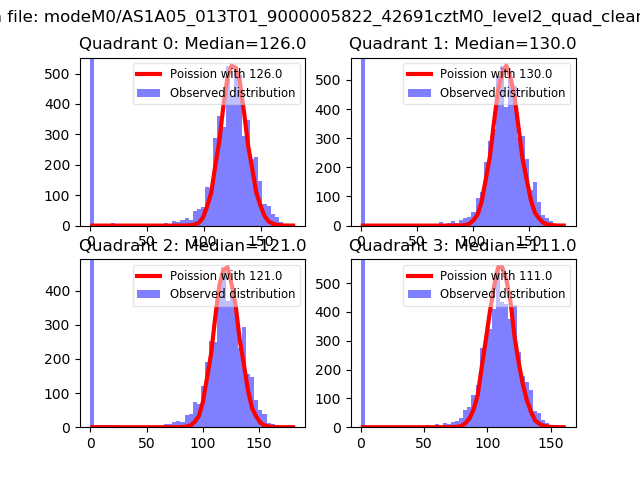 |
 |
| Quadrant-wise count rates Data is divided into 100 sec bins |
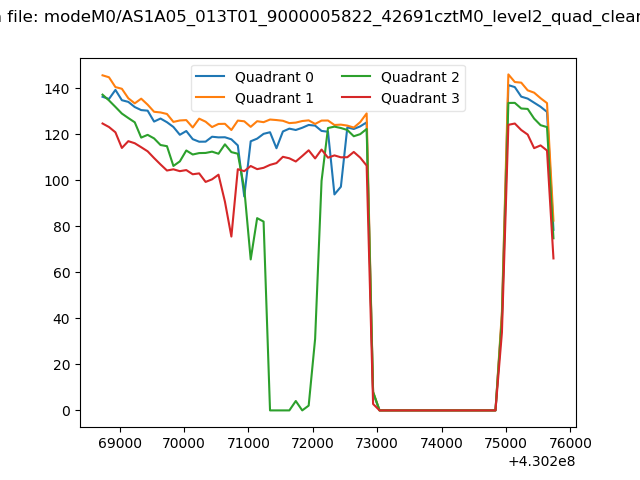 |
|
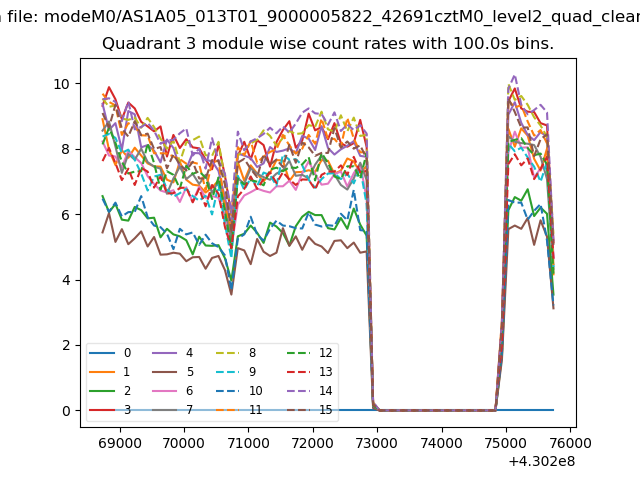
| Module-wise count rates for Quadrant A Data is divided into 100 sec bins |
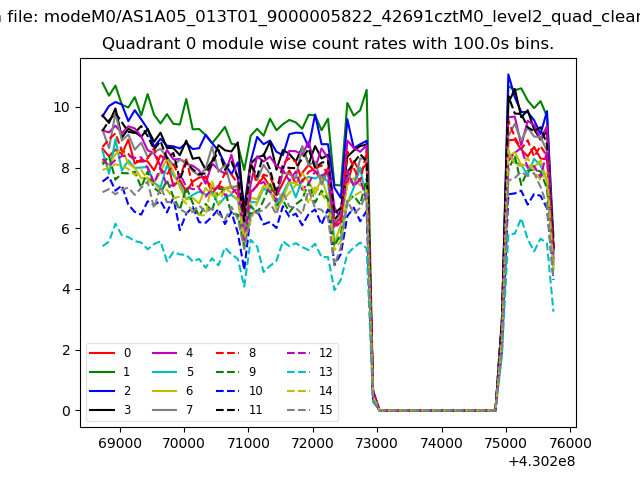 |
 |
| Module-wise count rates for Quadrant B Data is divided into 100 sec bins |
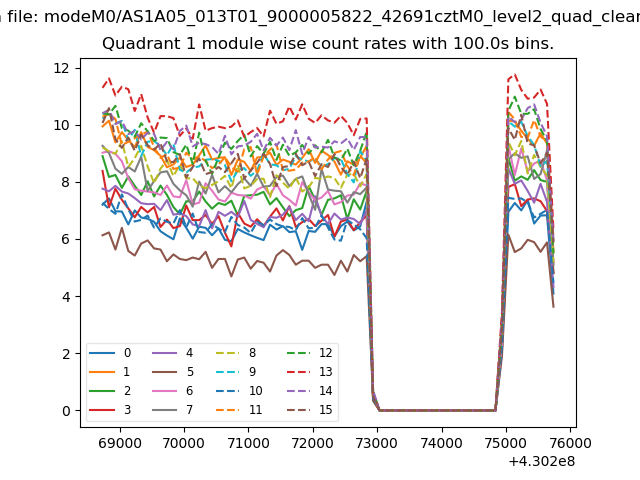 |
 |
| Module-wise count rates for Quadrant C Data is divided into 100 sec bins |
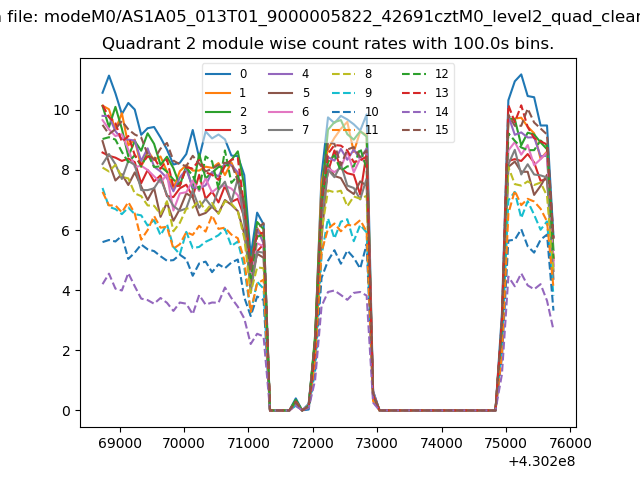 |
 |
| Module-wise count rates for Quadrant D Data is divided into 100 sec bins |
 |
 |
| Parameter | Plot |
|---|---|
| CZT HV Monitor | 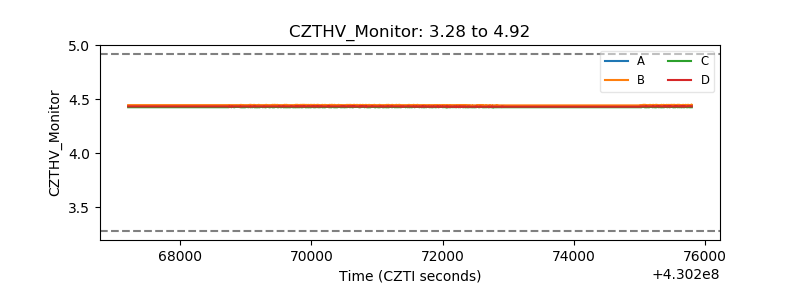 |
| D_VDD | 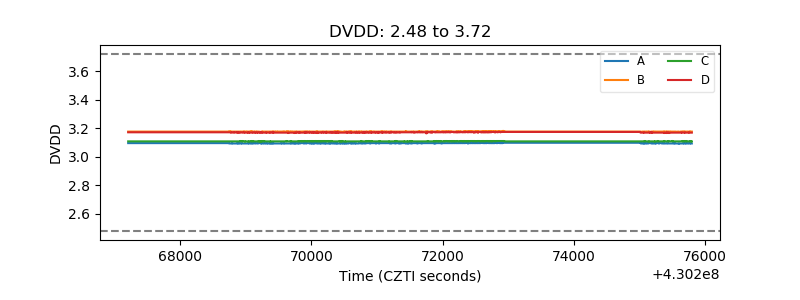 |
| Temperature 1 | 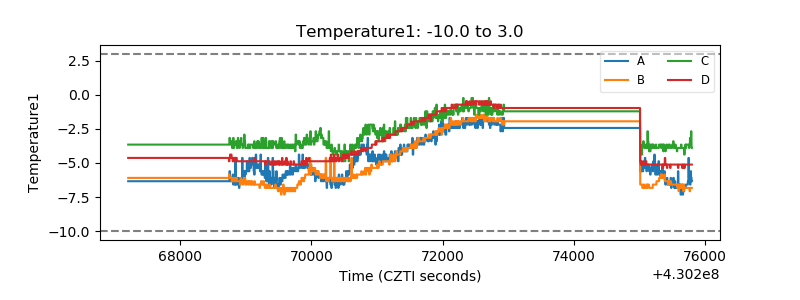 |
| Veto HV Monitor |  |
| Veto LLD | 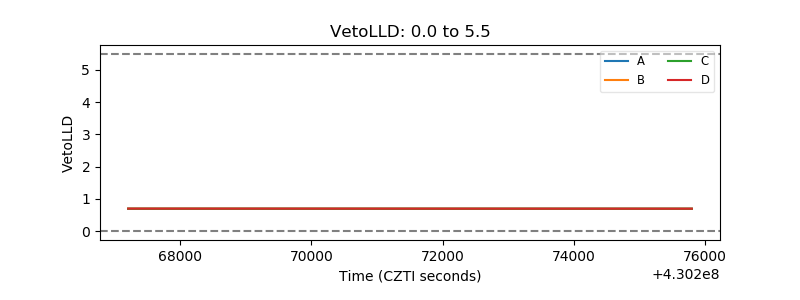 |
| Alpha Counter | 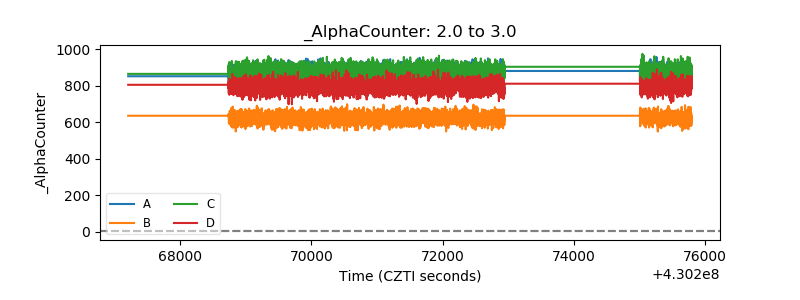 |
| _CPM_Rate | 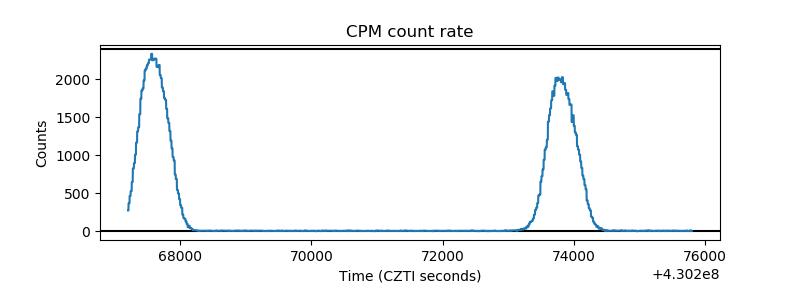 |
| CZT Counter | 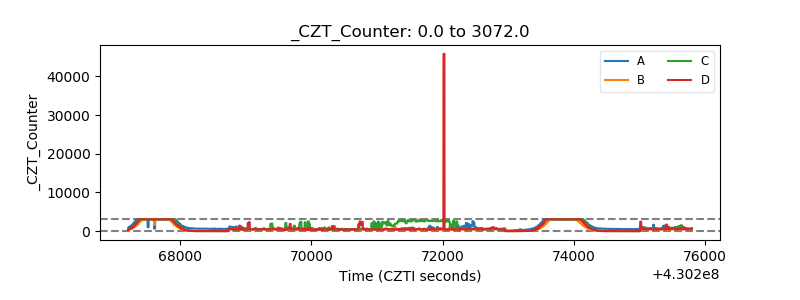 |
| +2.5 Volts monitor |  |
| +5 Volts monitor |  |
| _ROLL_ROT | 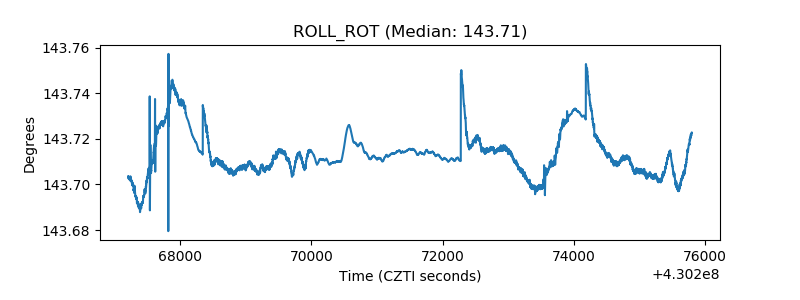 |
| _Roll_DEC | 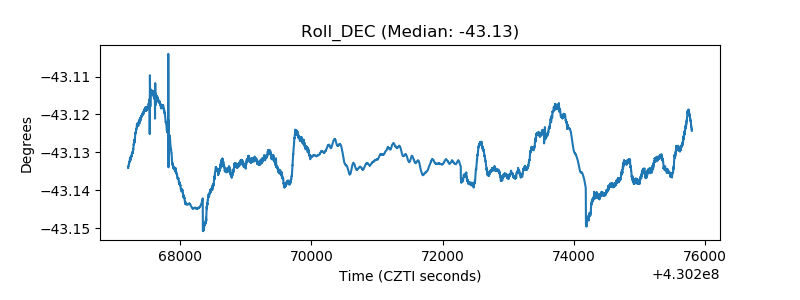 |
| _Roll_RA | 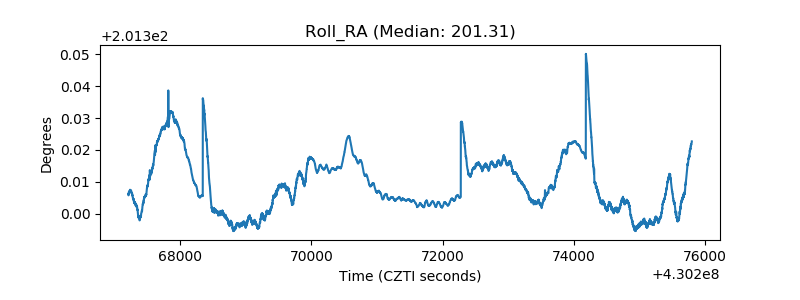 |
| Veto Counter | 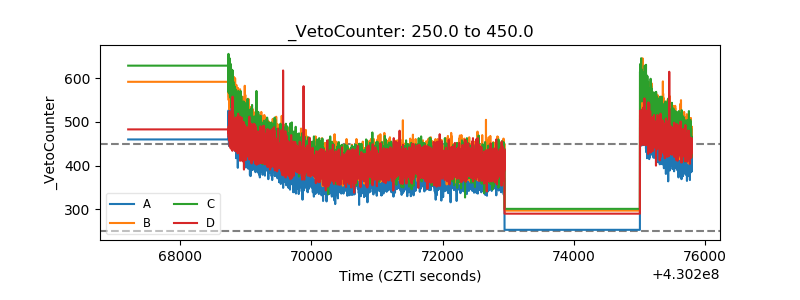 |