| Param | Original file | Final file |
|---|---|---|
| Filename | modeM0/AS1A05_013T01_9000005822_42692cztM0_level2.fits | modeM0/AS1A05_013T01_9000005822_42692cztM0_level2_quad_clean.evt |
| Size (bytes) | 335,937,600 | 94,881,600 |
| Size | 320.4 MB | 90.5 MB |
| Events in quadrant A | 3,683,994 | 638,415 |
| Events in quadrant B | 2,534,956 | 670,492 |
| Events in quadrant C | 2,812,358 | 627,518 |
| Events in quadrant D | 3,001,770 | 574,362 |
| Mode M0 | |||
|---|---|---|---|
| Quadrant | BADHDUFLAG | Total packets | Discarded packets |
| A | 0 | 14160 | 2 |
| B | 0 | 10726 | 2 |
| C | 0 | 11282 | 2 |
| D | 0 | 12225 | 2 |
| Mode M9 | |||
|---|---|---|---|
| Quadrant | BADHDUFLAG | Total packets | Discarded packets |
| A | 0 | 27 | 0 |
| B | 0 | 28 | 0 |
| C | 0 | 28 | 0 |
| D | 0 | 28 | 0 |
| Mode SS | |||
|---|---|---|---|
| Quadrant | BADHDUFLAG | Total packets | Discarded packets |
| A | 0 | 108 | 0 |
| B | 0 | 108 | 0 |
| C | 0 | 108 | 0 |
| D | 0 | 108 | 0 |
| Quadrant | Total seconds | Saturated seconds | Saturation percentage |
|---|---|---|---|
| A | 5166 | 150 | 2.903600% |
| B | 5166 | 18 | 0.348432% |
| C | 5166 | 18 | 0.348432% |
| D | 5166 | 55 | 1.064654% |
Noise dominated data is calculated using 1-second bins in cleaned event files. If a bin has >2000 counts, and if more than 50% of those come from <1% of pixels, then it is considered to be noise-dominated and hence unusable.
| Quadrant | # 1 sec bins | Bins with >0 counts | Bins with >2000 counts | High rate bins dominated by noise | Noise dominated (total time) | Noise dominated (detector-on time) | Marked lightcurve |
|---|---|---|---|---|---|---|---|
| A | 7320 | 5167 | 124 | 124 | 1.69% | 2.40% | 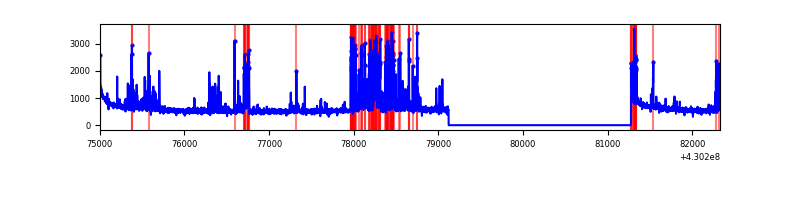 |
| B | 7320 | 5167 | 10 | 10 | 0.14% | 0.19% | 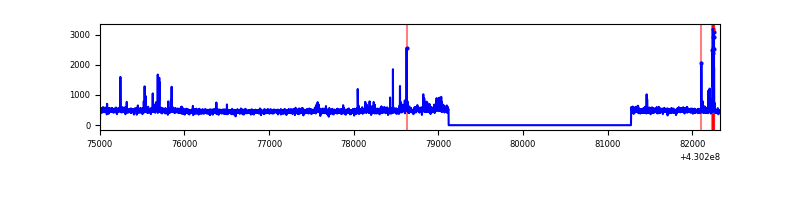 |
| C | 7320 | 5167 | 10 | 10 | 0.14% | 0.19% | 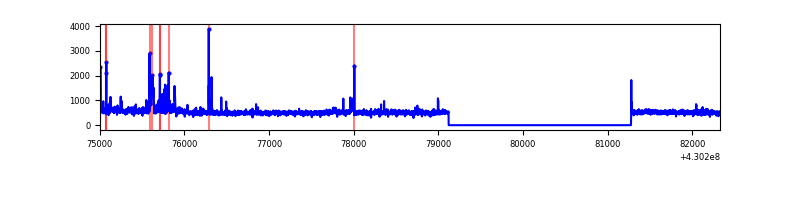 |
| D | 7320 | 5167 | 46 | 46 | 0.63% | 0.89% | 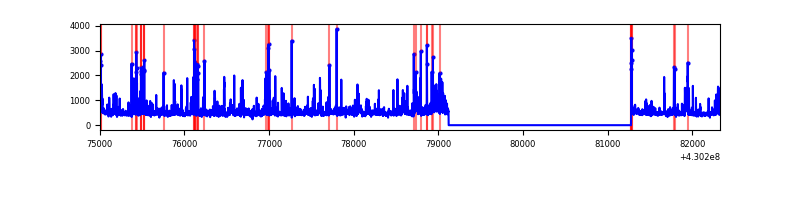 |
Top three noisy pixels from each quadrant. If the there are fewer than three noisy pixels in the level2.evt file, extra rows are filled as -1
| Pixel properties | Quadrant properties | ||||||
|---|---|---|---|---|---|---|---|
| Quadrant | DetID | PixID | Counts | Sigma | Mean | Median | Sigma |
| A | 13 | 248 | 577353 | 4672.04 | 607 | 597 | 123.4 |
| A | 10 | 83 | 528868 | 4279.29 | 607 | 597 | 123.4 |
| A | 7 | 3 | 209636 | 1693.33 | 607 | 597 | 123.4 |
| B | 5 | 172 | 66497 | 561.89 | 610 | 593 | 117.3 |
| B | 0 | 245 | 36976 | 310.2 | 610 | 593 | 117.3 |
| B | 0 | 168 | 14716 | 120.41 | 610 | 593 | 117.3 |
| C | 15 | 214 | 217467 | 1556.1 | 600 | 602 | 139.4 |
| C | 14 | 254 | 199084 | 1424.2 | 600 | 602 | 139.4 |
| C | 3 | 233 | 16471 | 113.87 | 600 | 602 | 139.4 |
| D | 2 | 249 | 287911 | 1981.95 | 595 | 578 | 145.0 |
| D | 1 | 52 | 195716 | 1346.01 | 595 | 578 | 145.0 |
| D | 13 | 249 | 73196 | 500.9 | 595 | 578 | 145.0 |
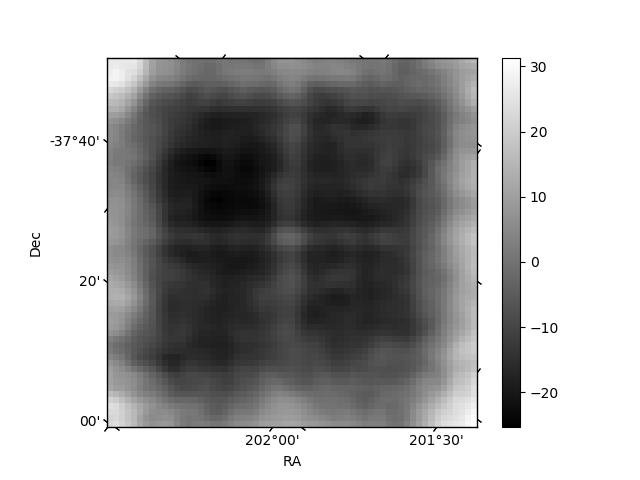
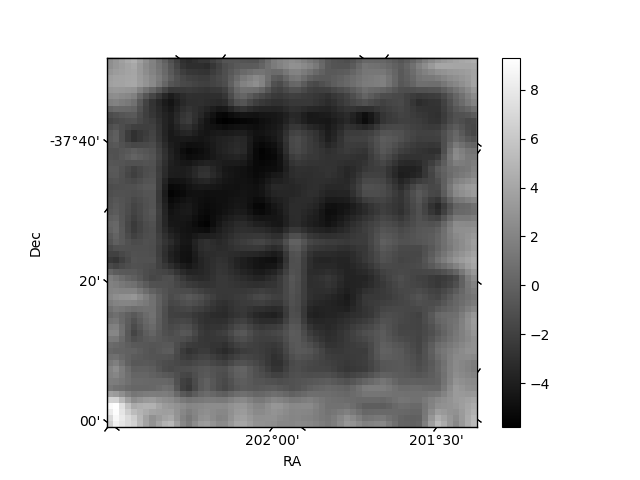
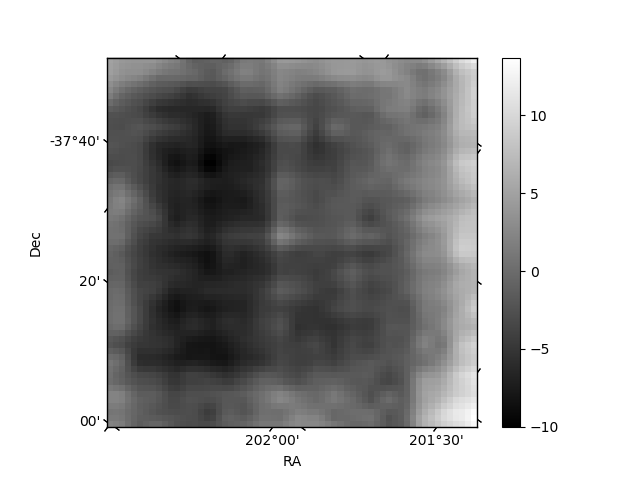
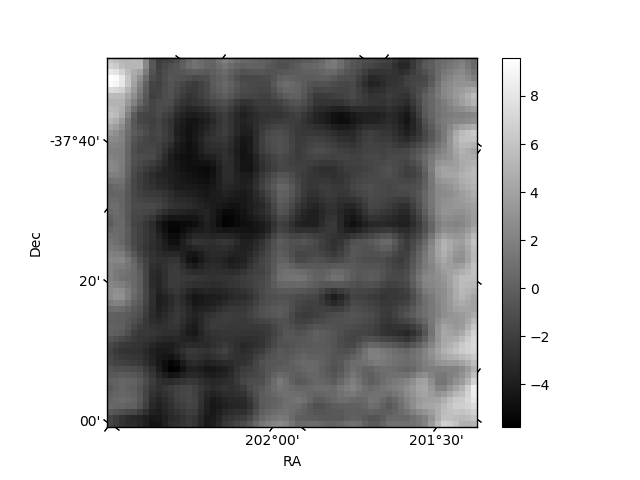
Histogram calculated using DETX and DETY for each event in the final _common_clean file
| Quadrant A | 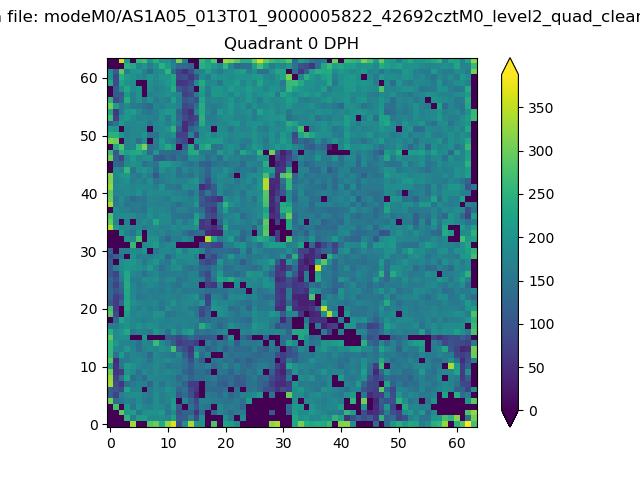 |
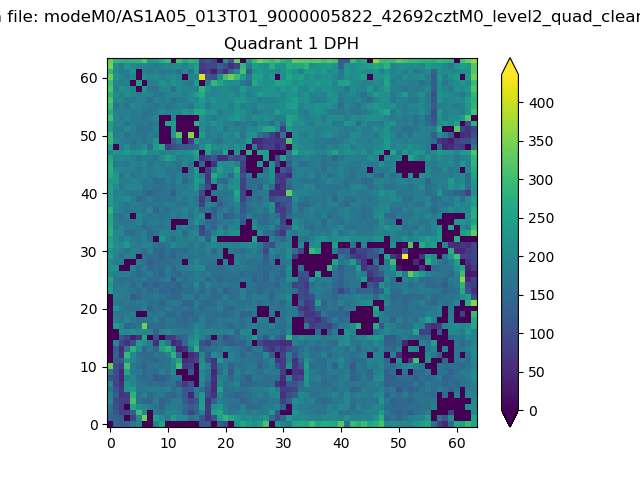 |
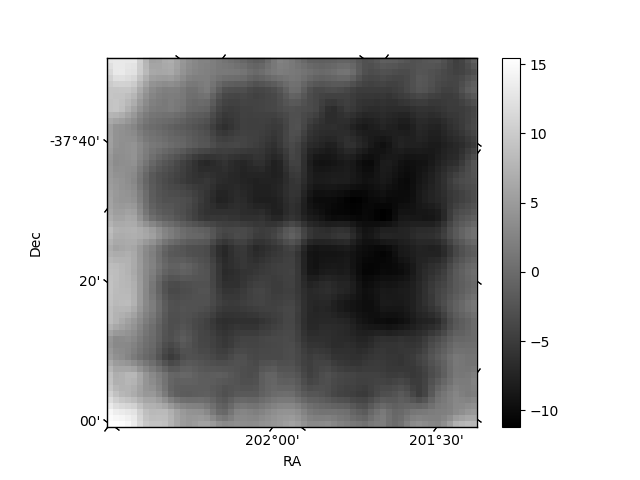
Quadrant B |
|---|---|---|---|
| Quadrant D | 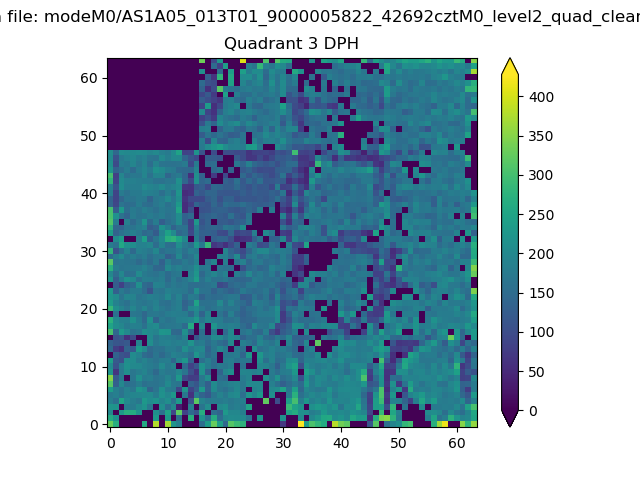 |
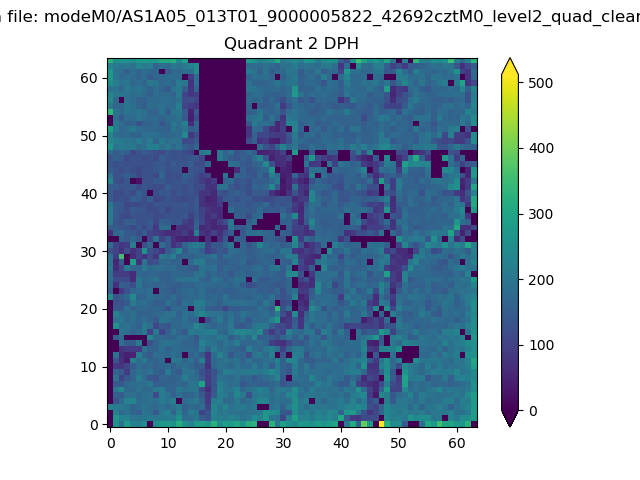 |
Quadrant C |
| Plot type | Count rate plots | Images |
|---|---|---|
| Comparison with Poisson distribution Blue bars denote a histogram of data divided into 1 sec bins. Red curve is a Poisson curve with rate = median count rate of data. |
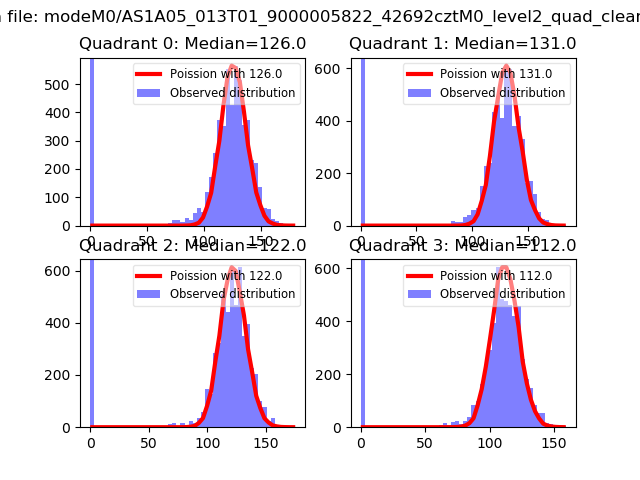 |
 |
| Quadrant-wise count rates Data is divided into 100 sec bins |
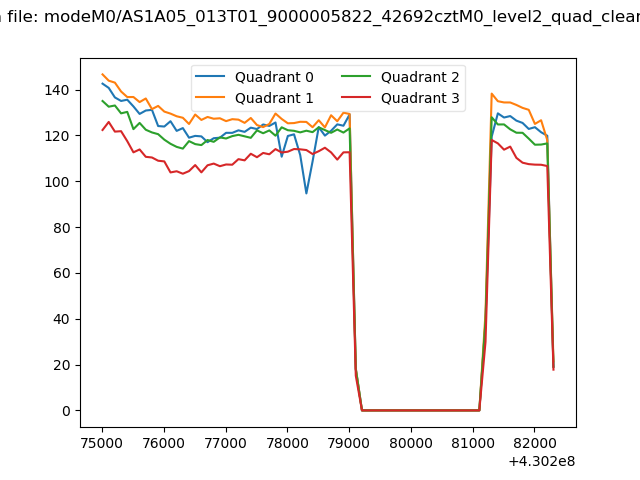 |
|
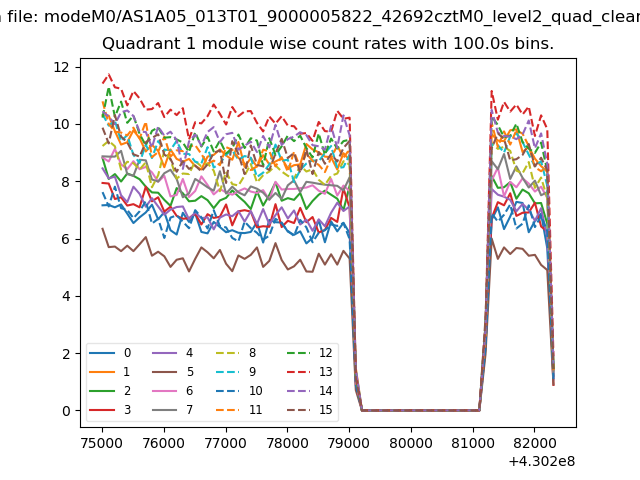
| Module-wise count rates for Quadrant A Data is divided into 100 sec bins |
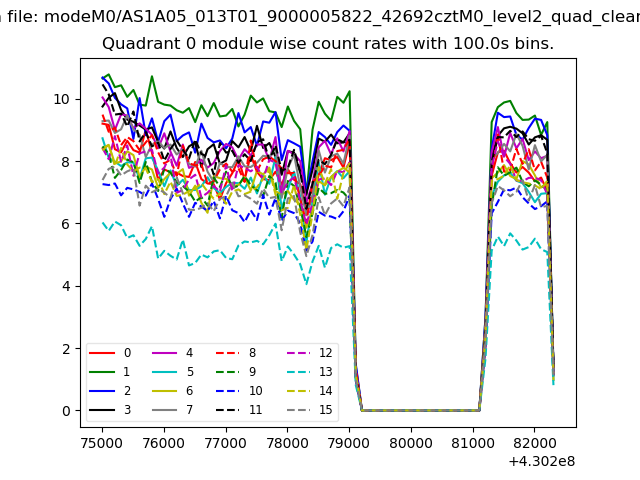 |
 |
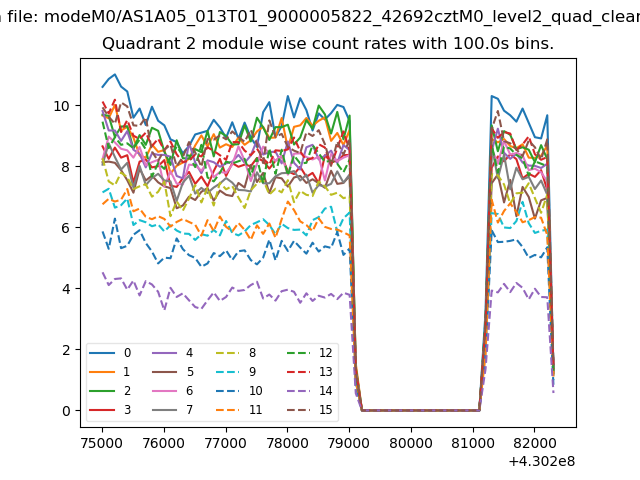
| Module-wise count rates for Quadrant B Data is divided into 100 sec bins |
 |
 |
| Module-wise count rates for Quadrant C Data is divided into 100 sec bins |
 |
 |
| Module-wise count rates for Quadrant D Data is divided into 100 sec bins |
 |
 |
| Parameter | Plot |
|---|---|
| CZT HV Monitor | 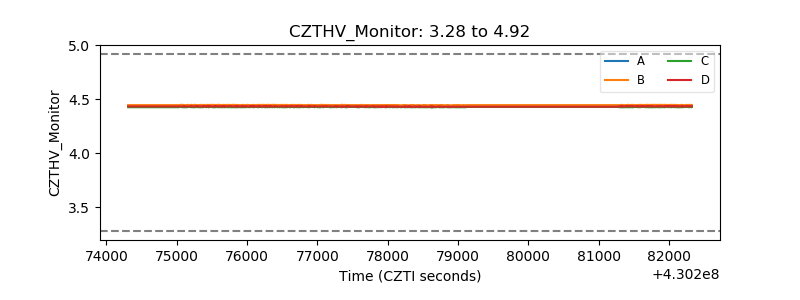 |
| D_VDD | 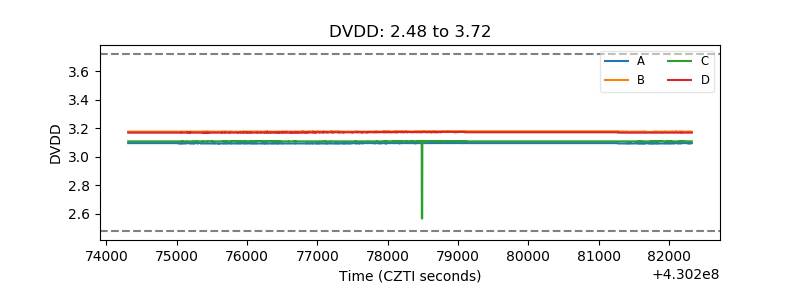 |
| Temperature 1 | 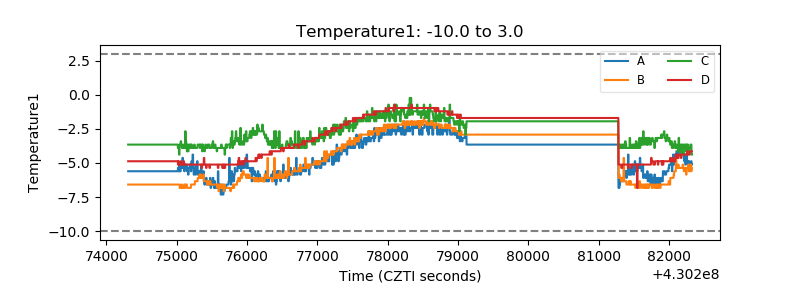 |
| Veto HV Monitor | 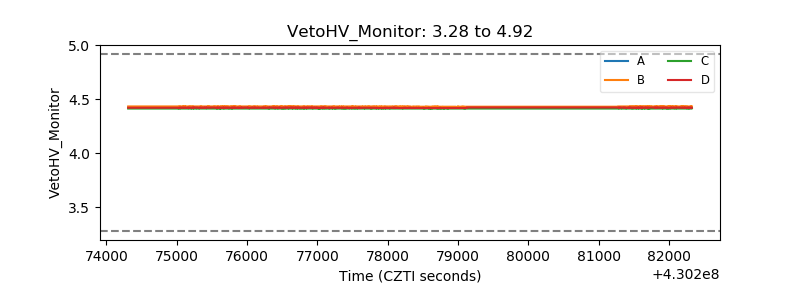 |
| Veto LLD | 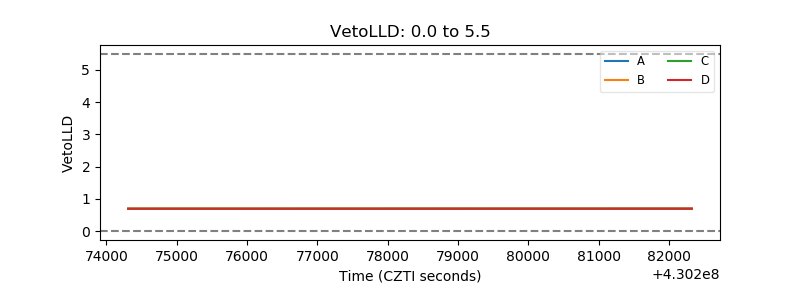 |
| Alpha Counter | 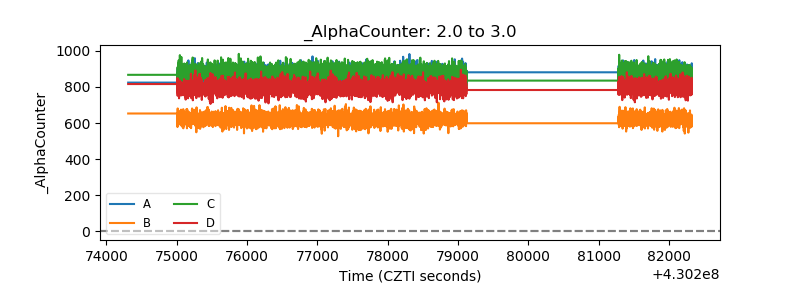 |
| _CPM_Rate | 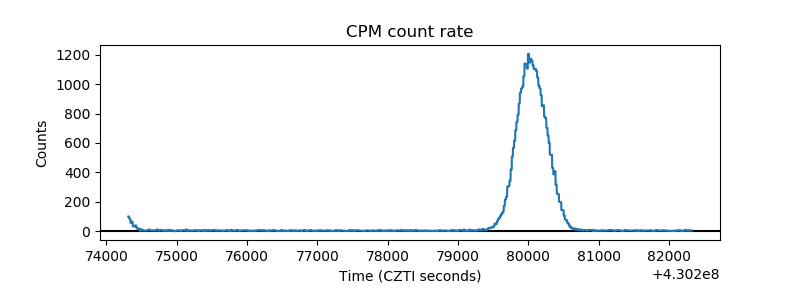 |
| CZT Counter | 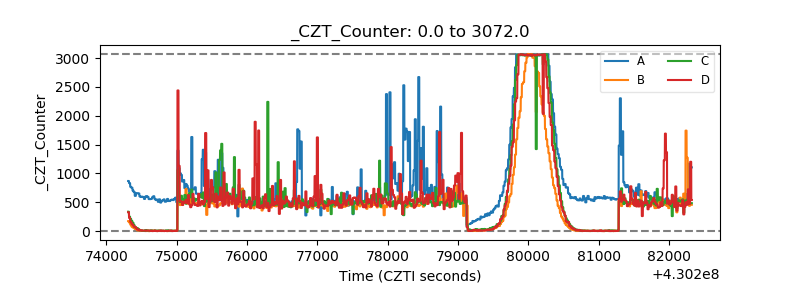 |
| +2.5 Volts monitor | 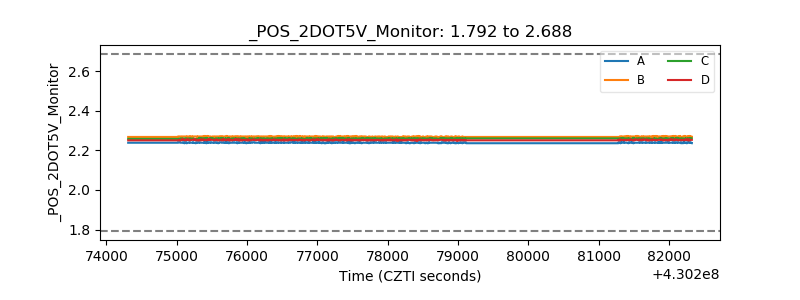 |
| +5 Volts monitor | 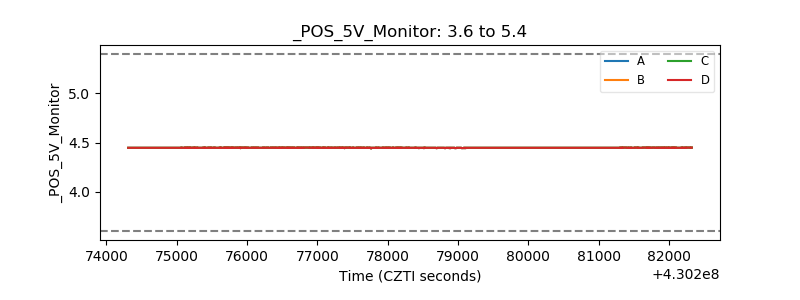 |
| _ROLL_ROT | 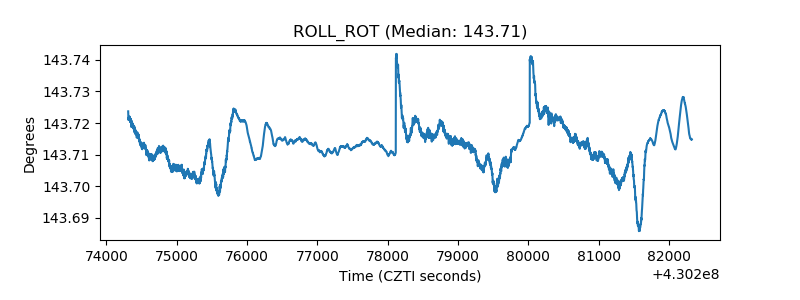 |
| _Roll_DEC | 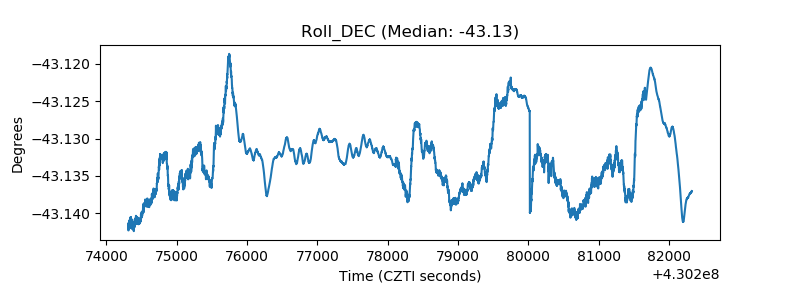 |
| _Roll_RA | 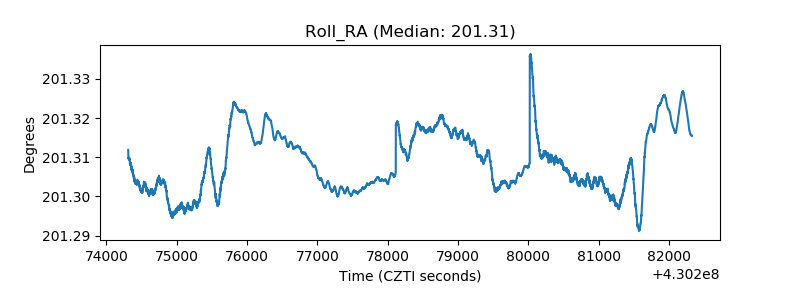 |
| Veto Counter |  |