| Param | Original file | Final file |
|---|---|---|
| Filename | modeM0/AS1A05_013T01_9000005822_42693cztM0_level2.fits | modeM0/AS1A05_013T01_9000005822_42693cztM0_level2_quad_clean.evt |
| Size (bytes) | 325,609,920 | 90,437,760 |
| Size | 310.5 MB | 86.2 MB |
| Events in quadrant A | 3,508,079 | 604,981 |
| Events in quadrant B | 2,613,119 | 634,158 |
| Events in quadrant C | 2,575,444 | 598,639 |
| Events in quadrant D | 2,960,463 | 544,895 |
| Mode M0 | |||
|---|---|---|---|
| Quadrant | BADHDUFLAG | Total packets | Discarded packets |
| A | 0 | 13441 | 2 |
| B | 0 | 11002 | 2 |
| C | 0 | 10513 | 2 |
| D | 0 | 12124 | 2 |
| Mode M9 | |||
|---|---|---|---|
| Quadrant | BADHDUFLAG | Total packets | Discarded packets |
| A | 0 | 29 | 0 |
| B | 0 | 30 | 0 |
| C | 0 | 30 | 0 |
| D | 0 | 30 | 0 |
| Mode SS | |||
|---|---|---|---|
| Quadrant | BADHDUFLAG | Total packets | Discarded packets |
| A | 0 | 102 | 0 |
| B | 0 | 102 | 0 |
| C | 0 | 102 | 0 |
| D | 0 | 102 | 0 |
| Quadrant | Total seconds | Saturated seconds | Saturation percentage |
|---|---|---|---|
| A | 5084 | 143 | 2.812746% |
| B | 5084 | 32 | 0.629426% |
| C | 5083 | 5 | 0.098367% |
| D | 5083 | 95 | 1.868975% |
Noise dominated data is calculated using 1-second bins in cleaned event files. If a bin has >2000 counts, and if more than 50% of those come from <1% of pixels, then it is considered to be noise-dominated and hence unusable.
| Quadrant | # 1 sec bins | Bins with >0 counts | Bins with >2000 counts | High rate bins dominated by noise | Noise dominated (total time) | Noise dominated (detector-on time) | Marked lightcurve |
|---|---|---|---|---|---|---|---|
| A | 7206 | 5085 | 115 | 115 | 1.60% | 2.26% | 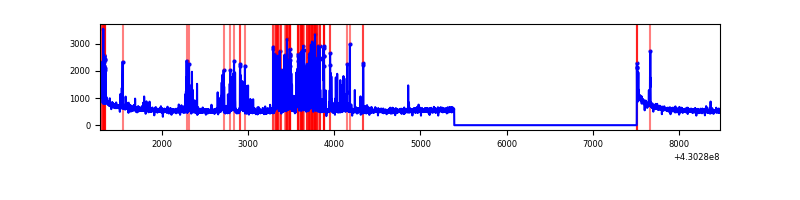 |
| B | 7206 | 5085 | 22 | 22 | 0.31% | 0.43% | 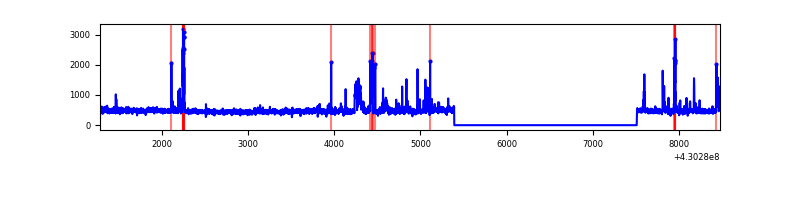 |
| C | 7205 | 5084 | 1 | 1 | 0.01% | 0.02% | 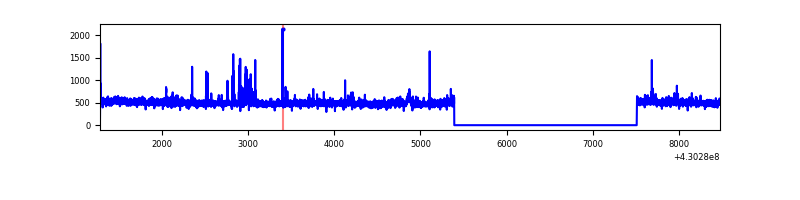 |
| D | 7205 | 5084 | 83 | 83 | 1.15% | 1.63% | 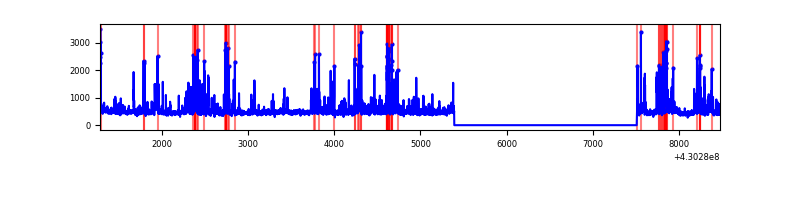 |
Top three noisy pixels from each quadrant. If the there are fewer than three noisy pixels in the level2.evt file, extra rows are filled as -1
| Pixel properties | Quadrant properties | ||||||
|---|---|---|---|---|---|---|---|
| Quadrant | DetID | PixID | Counts | Sigma | Mean | Median | Sigma |
| A | 13 | 248 | 670551 | 5646.76 | 586 | 576 | 118.6 |
| A | 10 | 83 | 548499 | 4618.07 | 586 | 576 | 118.6 |
| A | 15 | 237 | 9217 | 72.83 | 586 | 576 | 118.6 |
| B | 6 | 235 | 87529 | 776.28 | 586 | 571 | 112.0 |
| B | 5 | 172 | 72152 | 639.01 | 586 | 571 | 112.0 |
| B | 0 | 229 | 68979 | 610.68 | 586 | 571 | 112.0 |
| C | 15 | 214 | 216263 | 1609.33 | 577 | 580 | 134.0 |
| C | 2 | 16 | 43857 | 322.91 | 577 | 580 | 134.0 |
| C | 4 | 254 | 15496 | 111.3 | 577 | 580 | 134.0 |
| D | 2 | 249 | 236624 | 1681.01 | 573 | 556 | 140.4 |
| D | 13 | 249 | 184185 | 1307.6 | 573 | 556 | 140.4 |
| D | 1 | 47 | 151187 | 1072.62 | 573 | 556 | 140.4 |
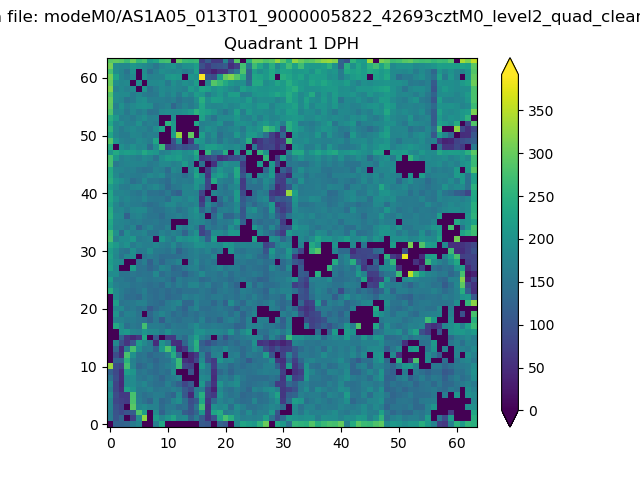
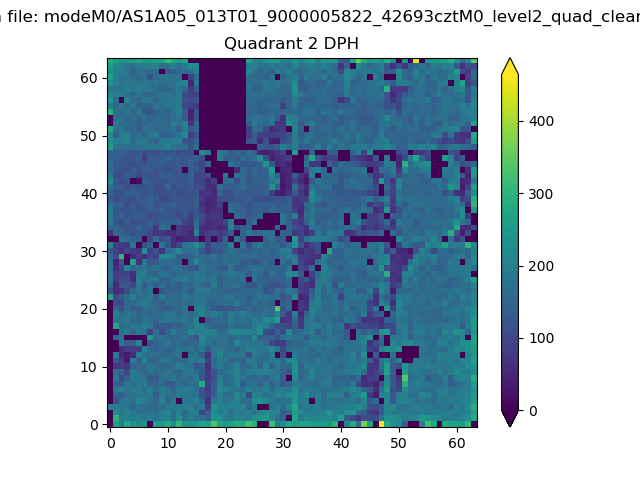
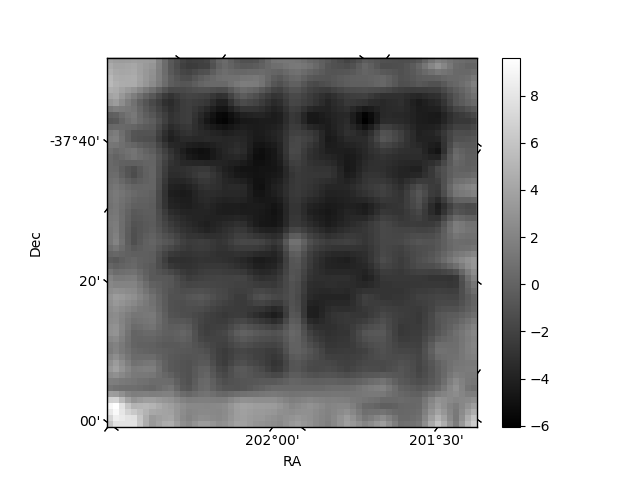
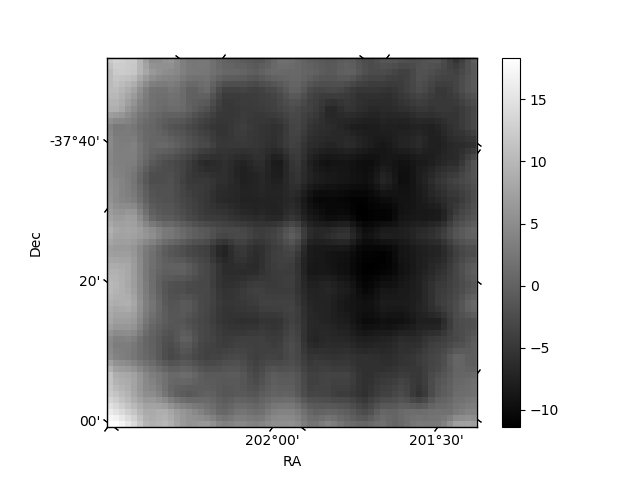
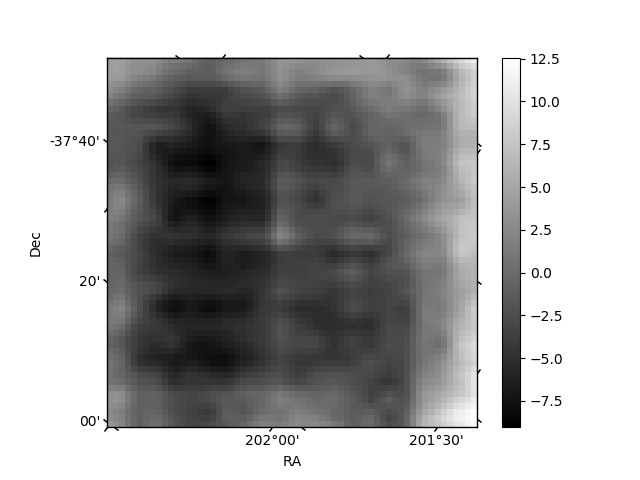
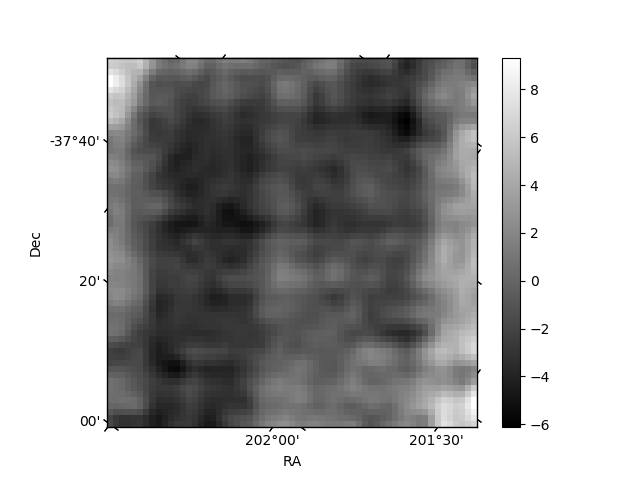
Histogram calculated using DETX and DETY for each event in the final _common_clean file
| Quadrant A |  |
 |
Quadrant B |
|---|---|---|---|
| Quadrant D |  |
 |
Quadrant C |
| Plot type | Count rate plots | Images |
|---|---|---|
| Comparison with Poisson distribution Blue bars denote a histogram of data divided into 1 sec bins. Red curve is a Poisson curve with rate = median count rate of data. |
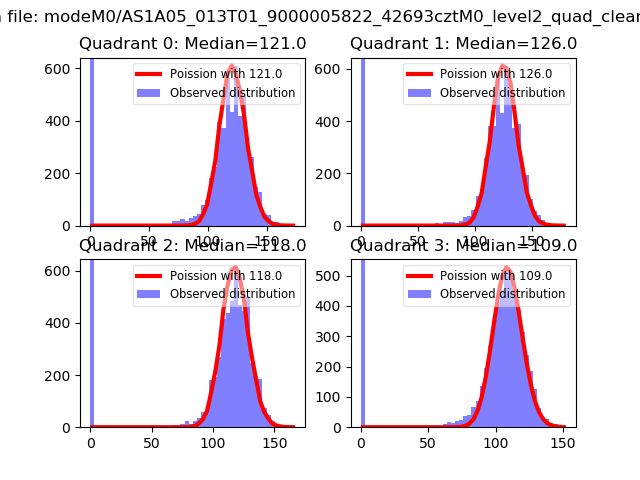 |
 |
| Quadrant-wise count rates Data is divided into 100 sec bins |
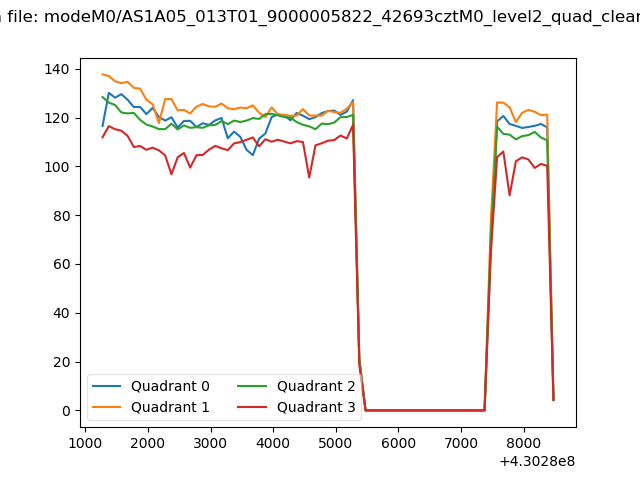 |
|
| Module-wise count rates for Quadrant A Data is divided into 100 sec bins |
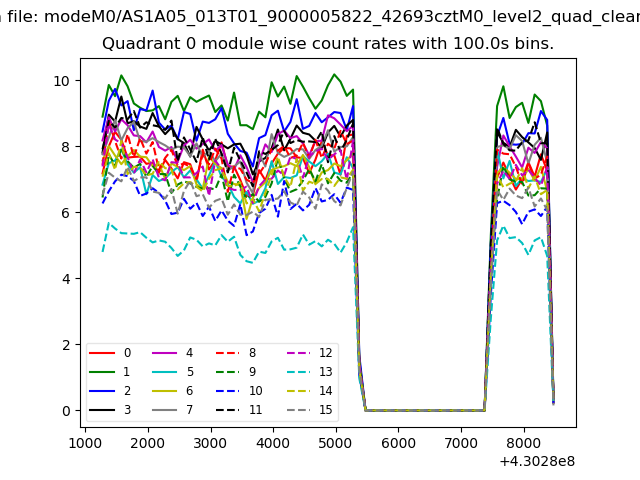 |
 |
| Module-wise count rates for Quadrant B Data is divided into 100 sec bins |
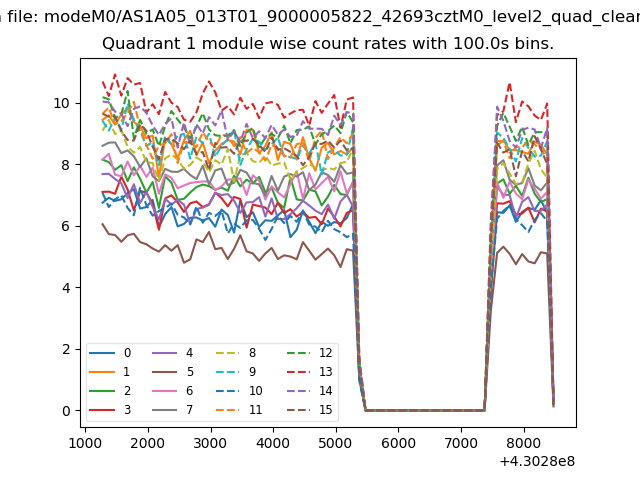 |
 |
| Module-wise count rates for Quadrant C Data is divided into 100 sec bins |
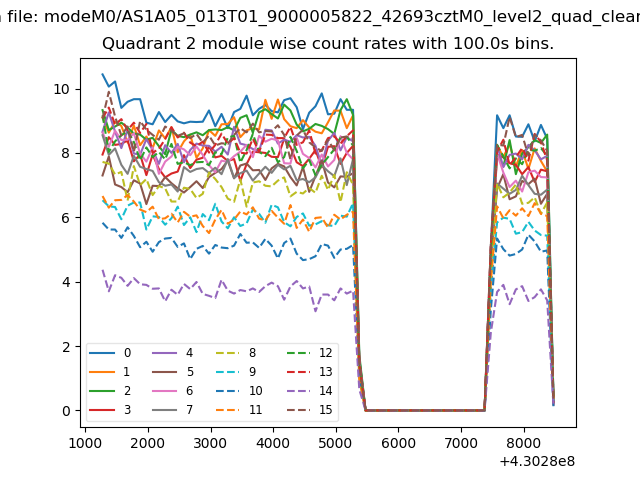 |
 |
| Module-wise count rates for Quadrant D Data is divided into 100 sec bins |
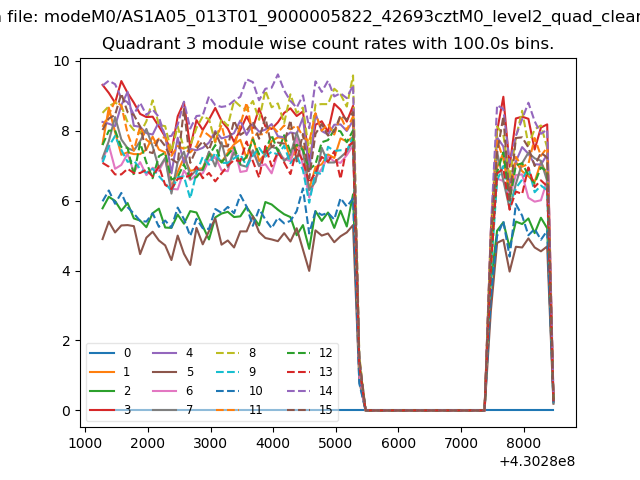 |
 |
| Parameter | Plot |
|---|---|
| CZT HV Monitor | 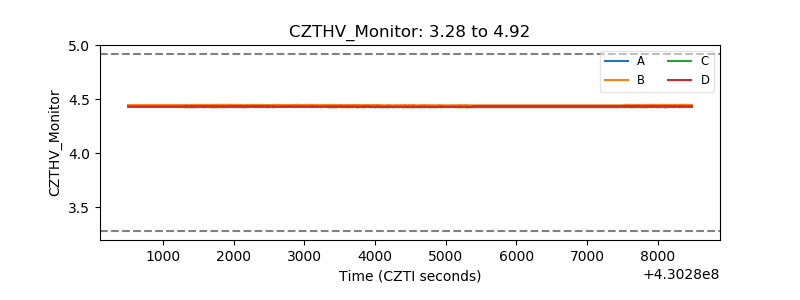 |
| D_VDD | 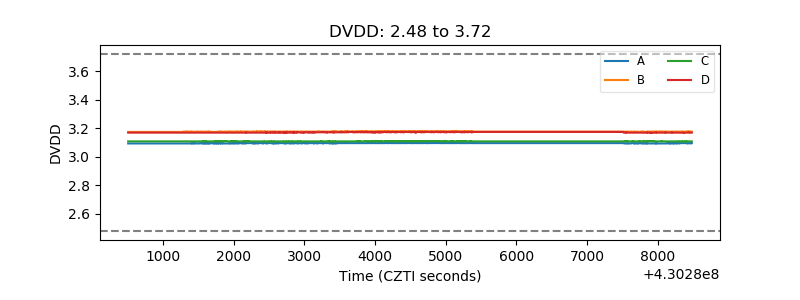 |
| Temperature 1 | 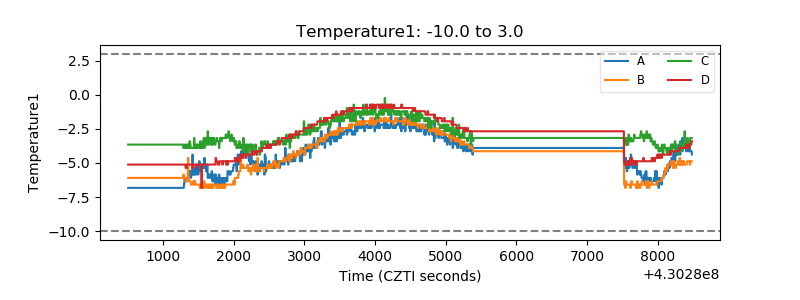 |
| Veto HV Monitor | 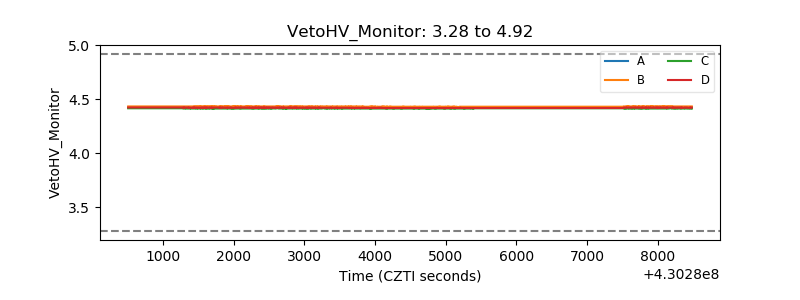 |
| Veto LLD | 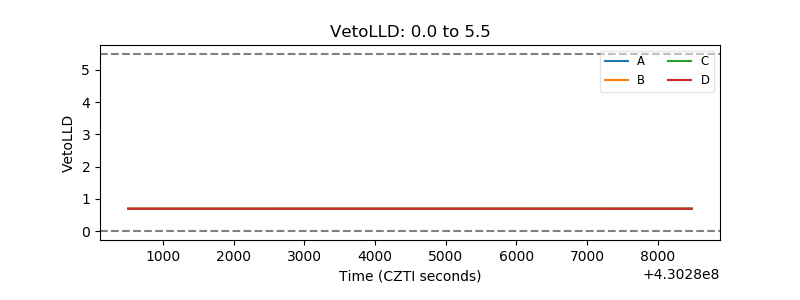 |
| Alpha Counter | 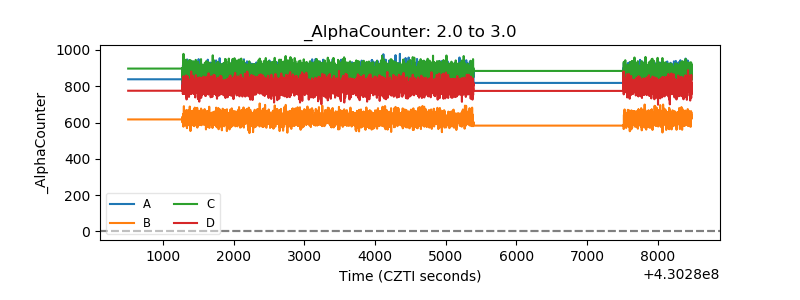 |
| _CPM_Rate | 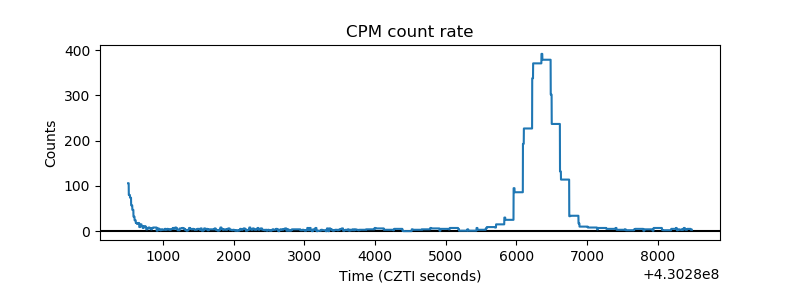 |
| CZT Counter | 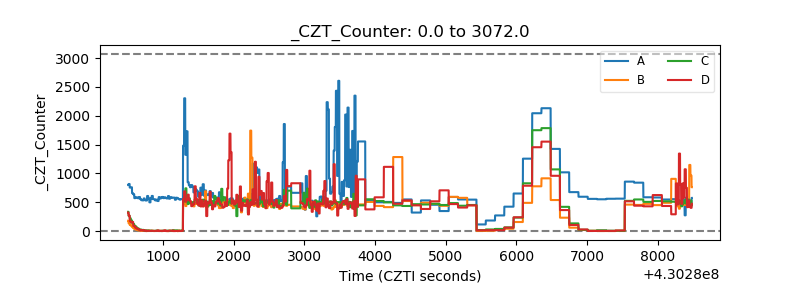 |
| +2.5 Volts monitor | 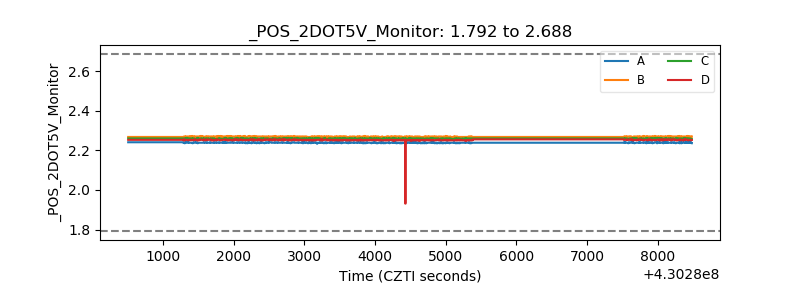 |
| +5 Volts monitor | 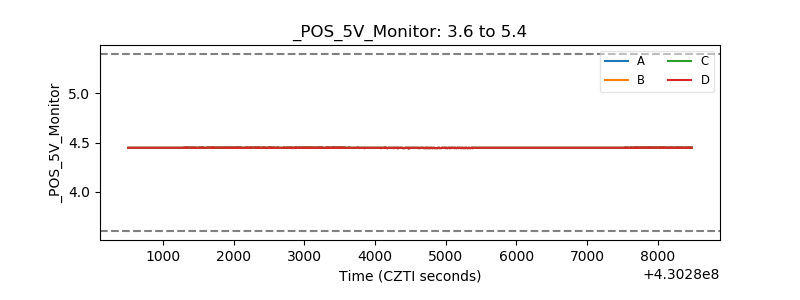 |
| _ROLL_ROT | 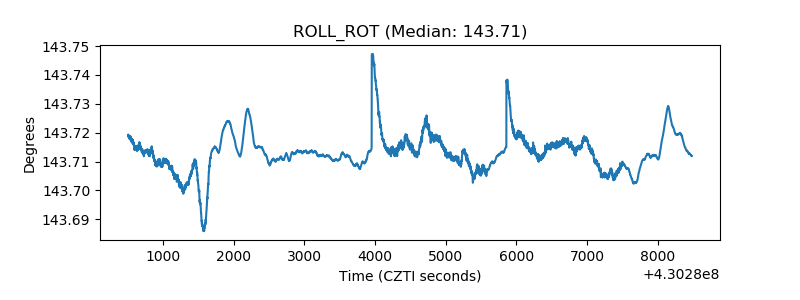 |
| _Roll_DEC | 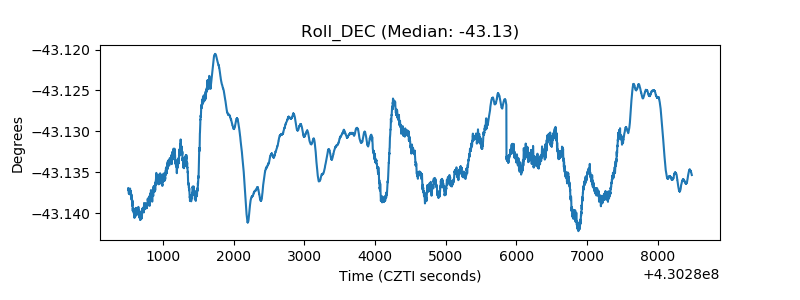 |
| _Roll_RA | 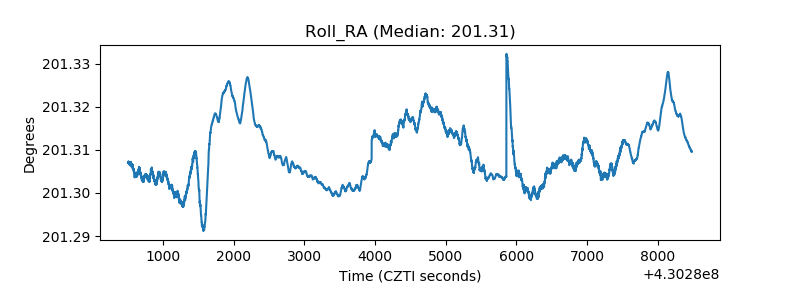 |
| Veto Counter | 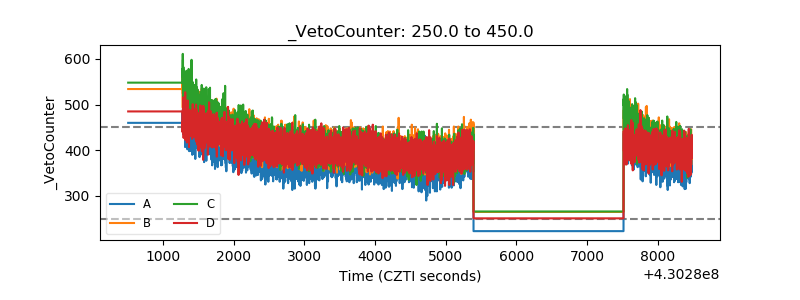 |