| Param | Original file | Final file |
|---|---|---|
| Filename | modeM0/AS1A05_013T01_9000005822_42694cztM0_level2.fits | modeM0/AS1A05_013T01_9000005822_42694cztM0_level2_quad_clean.evt |
| Size (bytes) | 332,959,680 | 86,117,760 |
| Size | 317.5 MB | 82.1 MB |
| Events in quadrant A | 3,050,450 | 581,277 |
| Events in quadrant B | 2,917,416 | 594,439 |
| Events in quadrant C | 2,496,119 | 569,214 |
| Events in quadrant D | 3,467,108 | 508,419 |
| Mode M0 | |||
|---|---|---|---|
| Quadrant | BADHDUFLAG | Total packets | Discarded packets |
| A | 0 | 11960 | 2 |
| B | 0 | 12045 | 2 |
| C | 0 | 10396 | 2 |
| D | 0 | 13747 | 2 |
| Mode M9 | |||
|---|---|---|---|
| Quadrant | BADHDUFLAG | Total packets | Discarded packets |
| A | 0 | 21 | 0 |
| B | 0 | 22 | 0 |
| C | 0 | 22 | 0 |
| D | 0 | 22 | 0 |
| Mode SS | |||
|---|---|---|---|
| Quadrant | BADHDUFLAG | Total packets | Discarded packets |
| A | 0 | 102 | 0 |
| B | 0 | 102 | 0 |
| C | 0 | 102 | 0 |
| D | 0 | 102 | 0 |
| Quadrant | Total seconds | Saturated seconds | Saturation percentage |
|---|---|---|---|
| A | 5059 | 49 | 0.968571% |
| B | 5059 | 61 | 1.205772% |
| C | 5059 | 11 | 0.217434% |
| D | 5059 | 212 | 4.190551% |
Noise dominated data is calculated using 1-second bins in cleaned event files. If a bin has >2000 counts, and if more than 50% of those come from <1% of pixels, then it is considered to be noise-dominated and hence unusable.
| Quadrant | # 1 sec bins | Bins with >0 counts | Bins with >2000 counts | High rate bins dominated by noise | Noise dominated (total time) | Noise dominated (detector-on time) | Marked lightcurve |
|---|---|---|---|---|---|---|---|
| A | 7062 | 5060 | 25 | 25 | 0.35% | 0.49% | 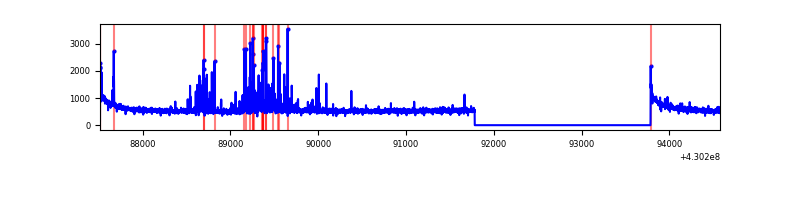 |
| B | 7062 | 5060 | 38 | 38 | 0.54% | 0.75% | 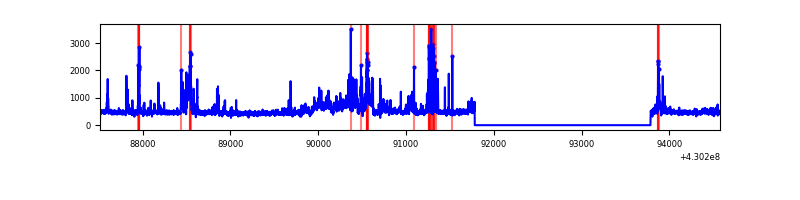 |
| C | 7062 | 5060 | 7 | 7 | 0.10% | 0.14% | 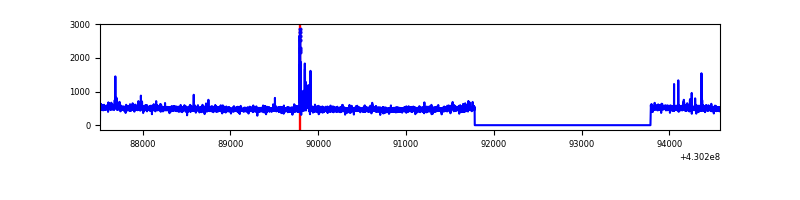 |
| D | 7062 | 5060 | 210 | 210 | 2.97% | 4.15% | 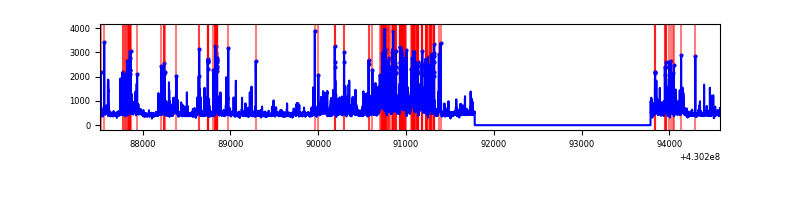 |
Top three noisy pixels from each quadrant. If the there are fewer than three noisy pixels in the level2.evt file, extra rows are filled as -1
| Pixel properties | Quadrant properties | ||||||
|---|---|---|---|---|---|---|---|
| Quadrant | DetID | PixID | Counts | Sigma | Mean | Median | Sigma |
| A | 10 | 83 | 572253 | 4845.43 | 571 | 560 | 118.0 |
| A | 13 | 248 | 260094 | 2199.7 | 571 | 560 | 118.0 |
| A | 13 | 254 | 7951 | 62.64 | 571 | 560 | 118.0 |
| B | 0 | 229 | 250628 | 2310.76 | 563 | 547 | 108.2 |
| B | 0 | 168 | 134210 | 1235.05 | 563 | 547 | 108.2 |
| B | 5 | 172 | 132405 | 1218.38 | 563 | 547 | 108.2 |
| C | 15 | 214 | 216884 | 1685.45 | 555 | 559 | 128.3 |
| C | 14 | 254 | 69016 | 533.37 | 555 | 559 | 128.3 |
| C | 4 | 254 | 14167 | 106.02 | 555 | 559 | 128.3 |
| D | 1 | 47 | 570169 | 4235.59 | 548 | 532 | 134.5 |
| D | 2 | 249 | 287669 | 2135.03 | 548 | 532 | 134.5 |
| D | 13 | 249 | 185737 | 1377.11 | 548 | 532 | 134.5 |
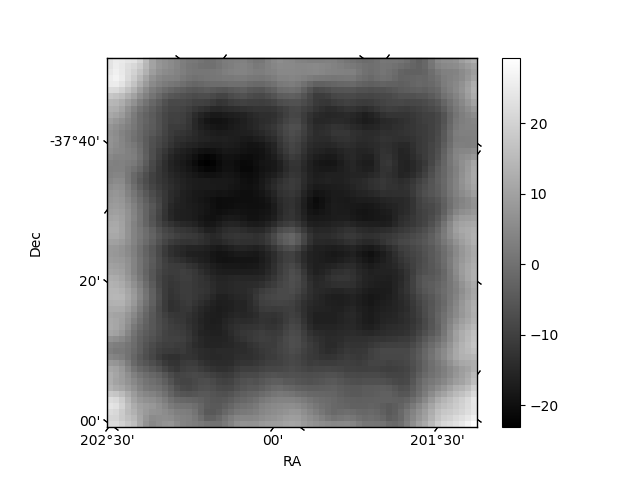
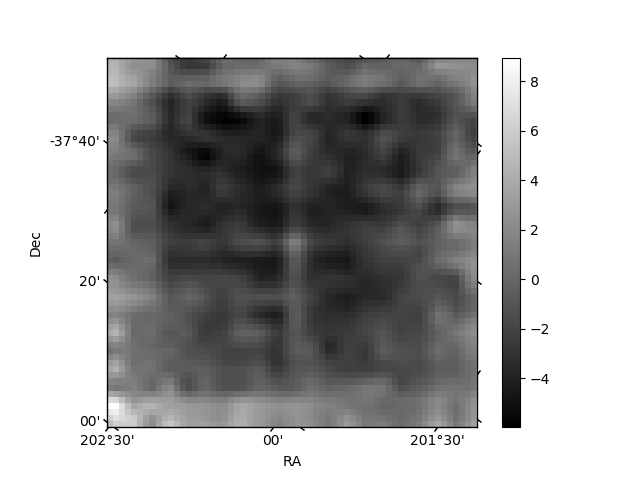
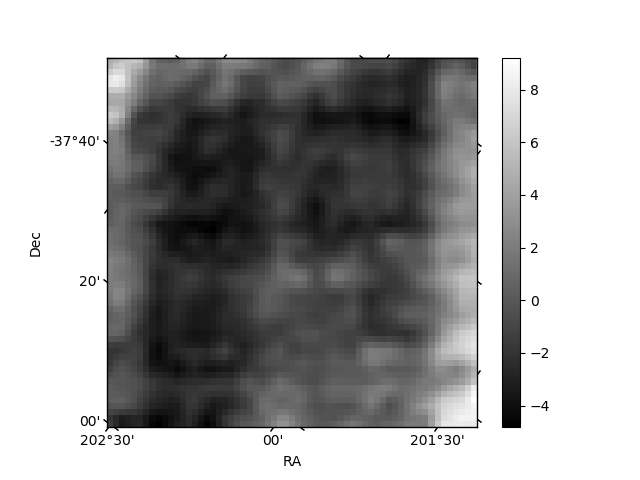
Histogram calculated using DETX and DETY for each event in the final _common_clean file
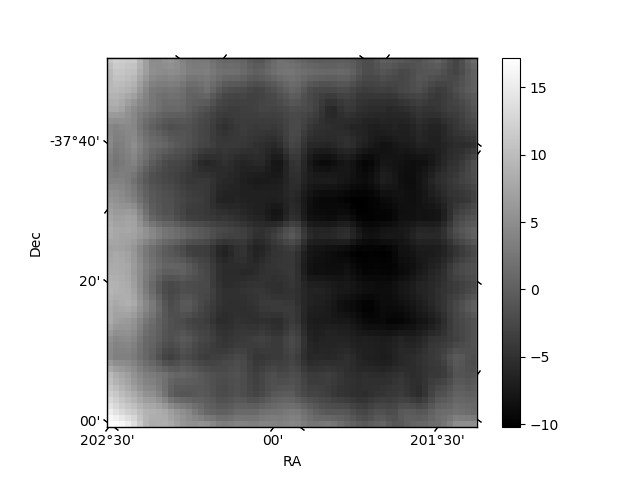
| Quadrant A | 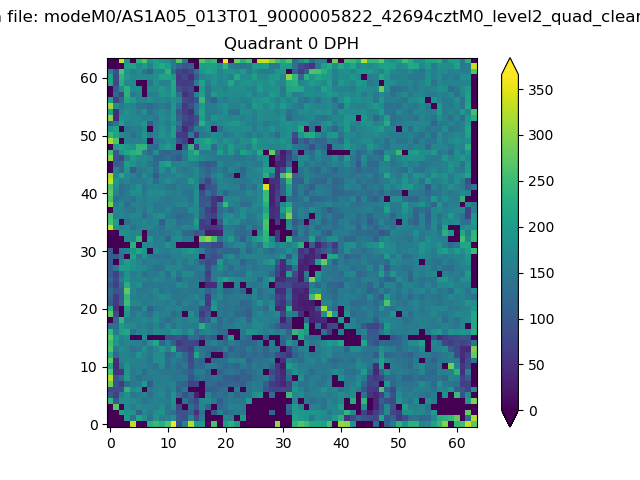 |
 |
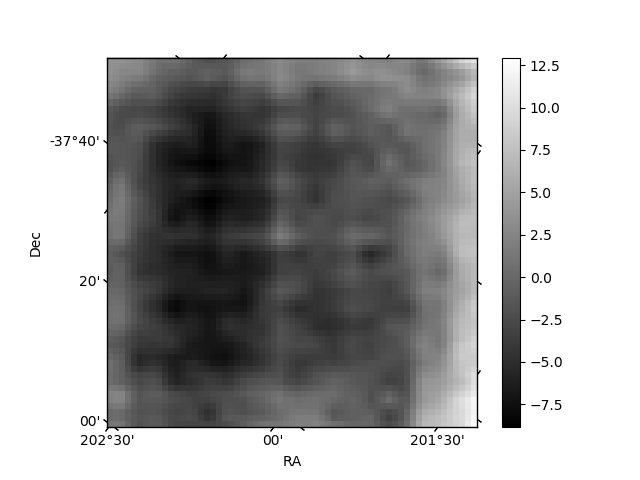
Quadrant B |
|---|---|---|---|
| Quadrant D | 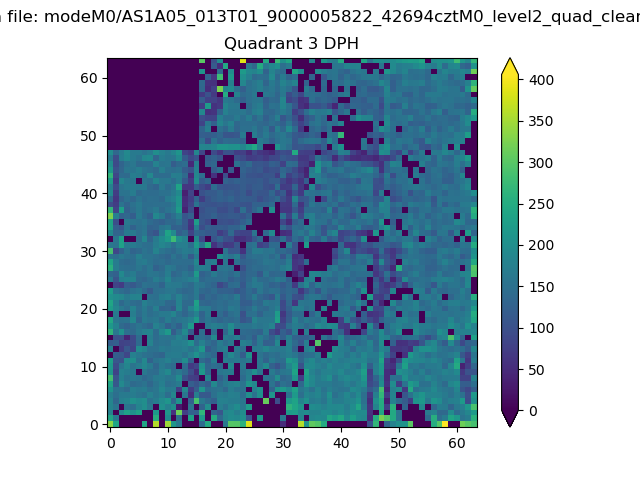 |
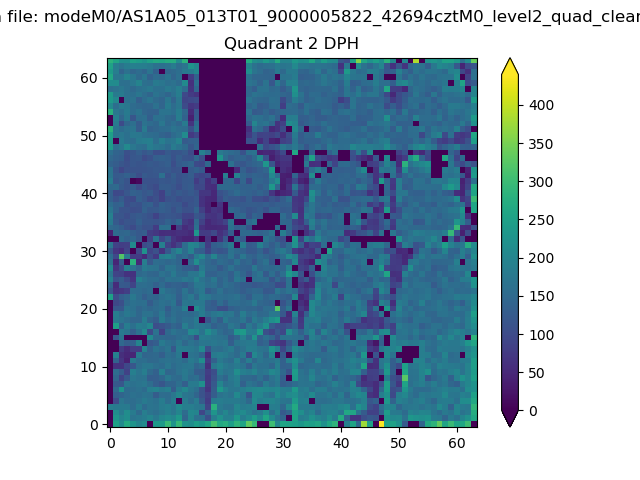 |
Quadrant C |
| Plot type | Count rate plots | Images |
|---|---|---|
| Comparison with Poisson distribution Blue bars denote a histogram of data divided into 1 sec bins. Red curve is a Poisson curve with rate = median count rate of data. |
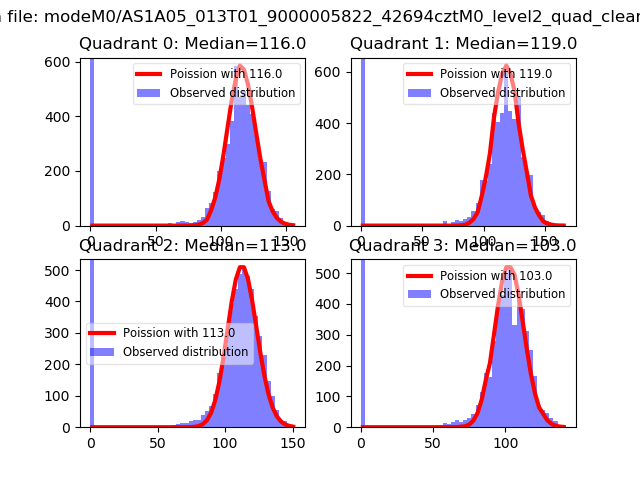 |
 |
| Quadrant-wise count rates Data is divided into 100 sec bins |
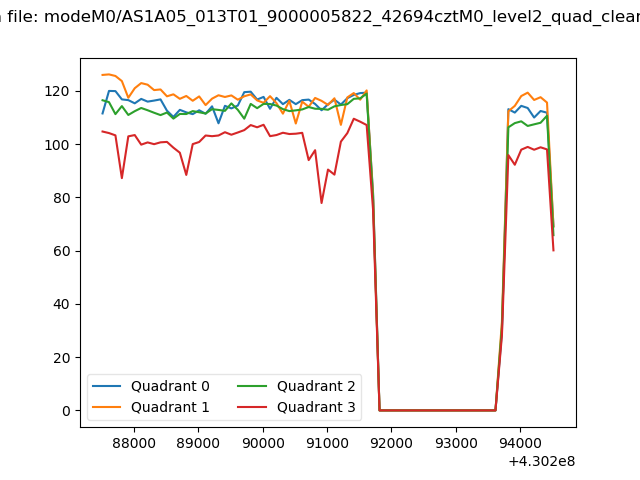 |
|
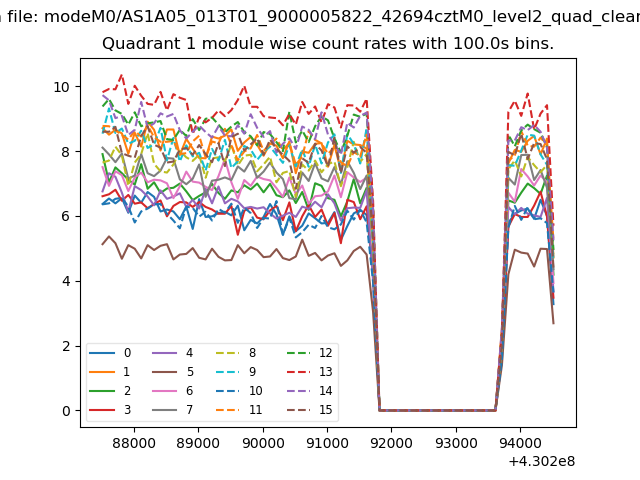
| Module-wise count rates for Quadrant A Data is divided into 100 sec bins |
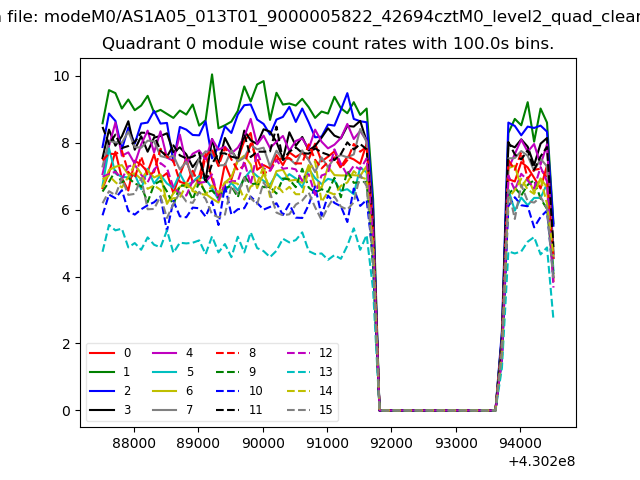 |
 |
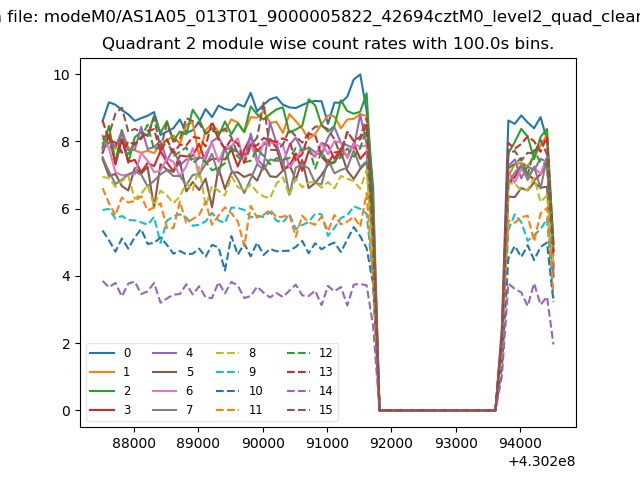
| Module-wise count rates for Quadrant B Data is divided into 100 sec bins |
 |
 |
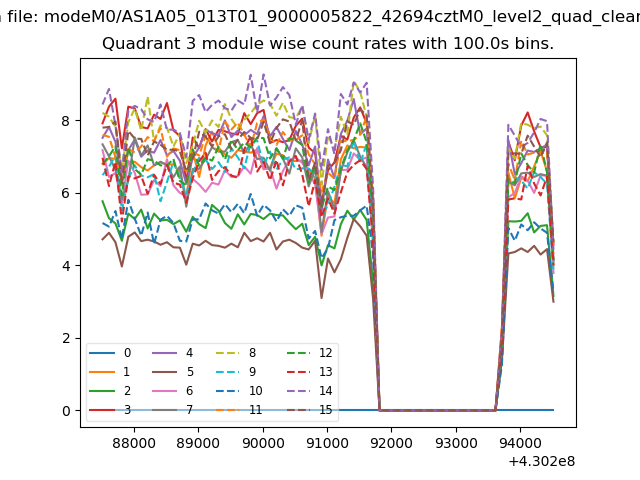
| Module-wise count rates for Quadrant C Data is divided into 100 sec bins |
 |
 |
| Module-wise count rates for Quadrant D Data is divided into 100 sec bins |
 |
 |
| Parameter | Plot |
|---|---|
| CZT HV Monitor |  |
| D_VDD | 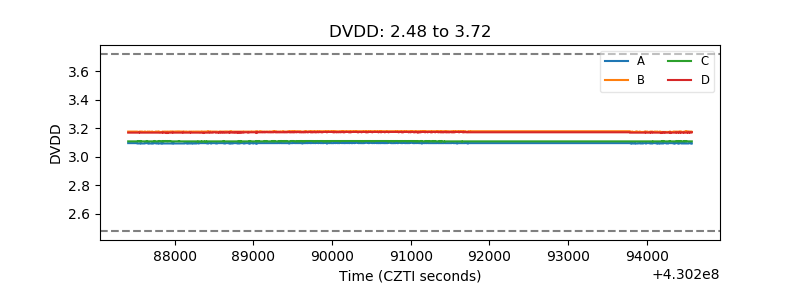 |
| Temperature 1 | 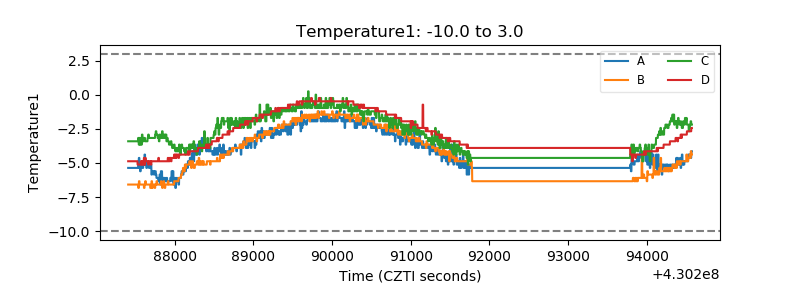 |
| Veto HV Monitor | 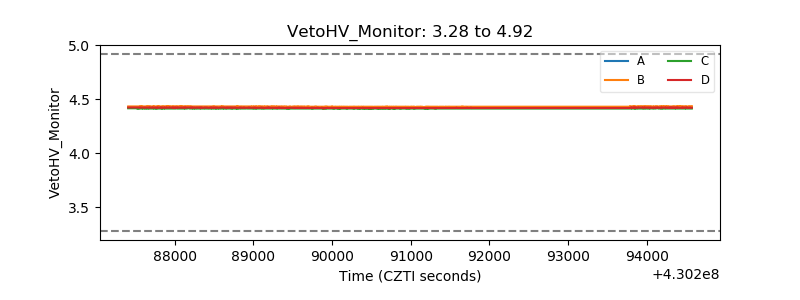 |
| Veto LLD | 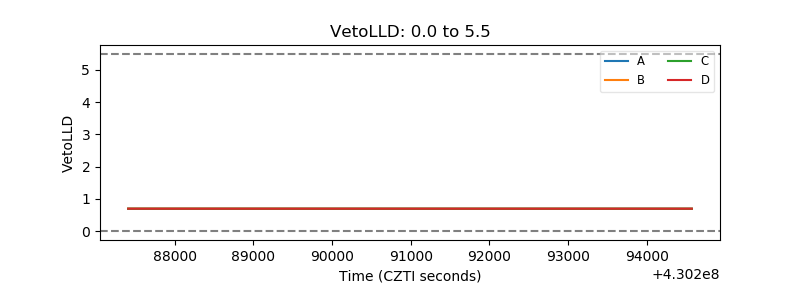 |
| Alpha Counter | 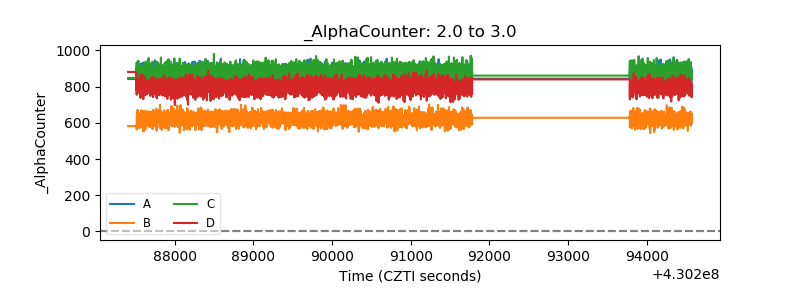 |
| _CPM_Rate | 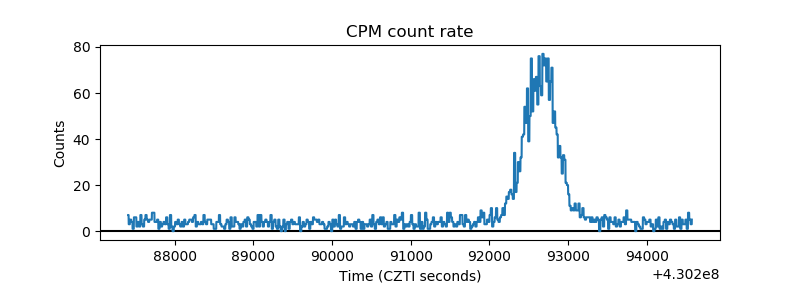 |
| CZT Counter | 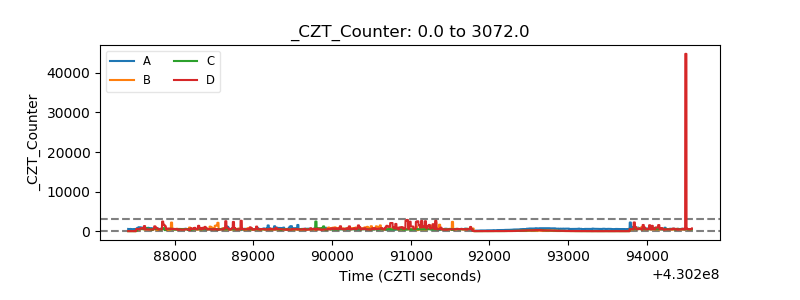 |
| +2.5 Volts monitor | 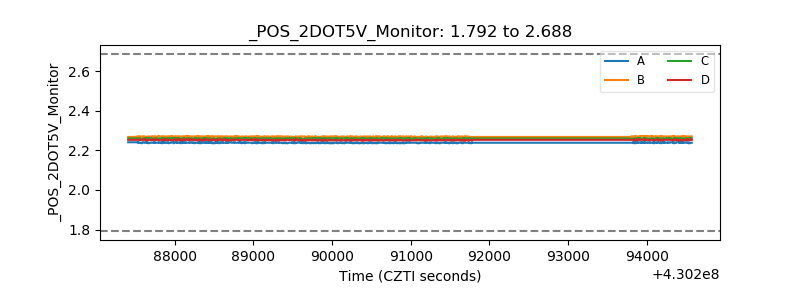 |
| +5 Volts monitor | 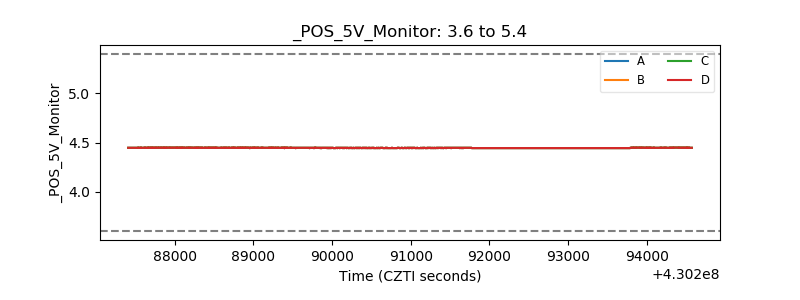 |
| _ROLL_ROT | 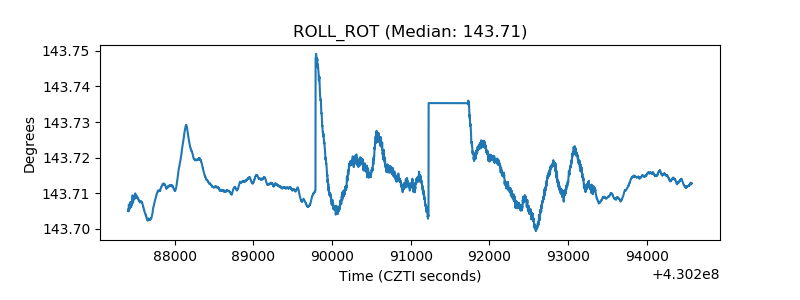 |
| _Roll_DEC | 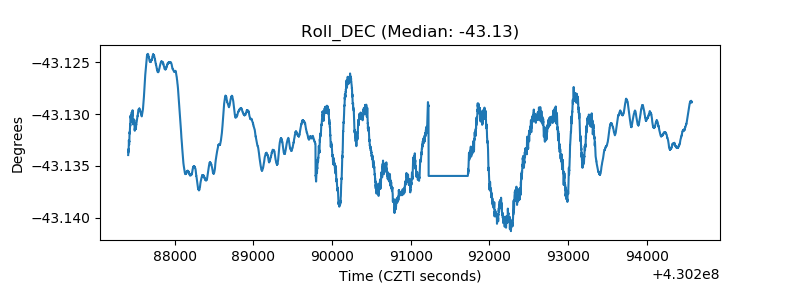 |
| _Roll_RA | 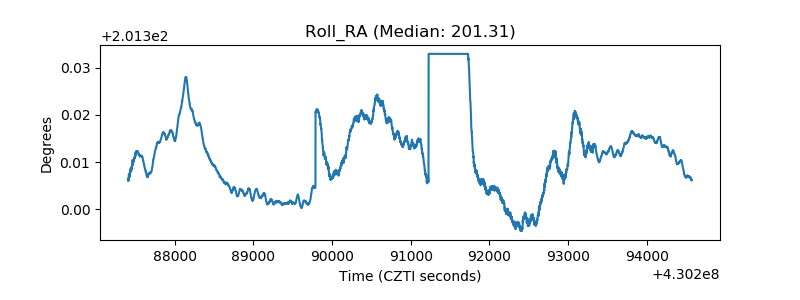 |
| Veto Counter | 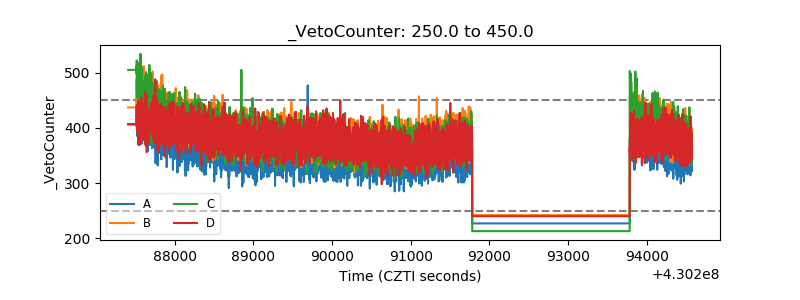 |