| Param | Original file | Final file |
|---|---|---|
| Filename | modeM0/AS1A05_013T01_9000005822_42695cztM0_level2.fits | modeM0/AS1A05_013T01_9000005822_42695cztM0_level2_quad_clean.evt |
| Size (bytes) | 338,204,160 | 90,095,040 |
| Size | 322.5 MB | 85.9 MB |
| Events in quadrant A | 3,315,529 | 603,126 |
| Events in quadrant B | 2,808,011 | 612,800 |
| Events in quadrant C | 2,618,312 | 590,769 |
| Events in quadrant D | 3,356,516 | 542,999 |
| Mode M0 | |||
|---|---|---|---|
| Quadrant | BADHDUFLAG | Total packets | Discarded packets |
| A | 0 | 13037 | 2 |
| B | 0 | 11755 | 2 |
| C | 0 | 11045 | 2 |
| D | 0 | 13632 | 2 |
| Mode M9 | |||
|---|---|---|---|
| Quadrant | BADHDUFLAG | Total packets | Discarded packets |
| A | 0 | 37 | 0 |
| B | 0 | 37 | 0 |
| C | 0 | 37 | 0 |
| D | 0 | 37 | 0 |
| Mode SS | |||
|---|---|---|---|
| Quadrant | BADHDUFLAG | Total packets | Discarded packets |
| A | 0 | 112 | 0 |
| B | 0 | 112 | 0 |
| C | 0 | 112 | 0 |
| D | 0 | 112 | 0 |
| Quadrant | Total seconds | Saturated seconds | Saturation percentage |
|---|---|---|---|
| A | 5404 | 77 | 1.424870% |
| B | 5404 | 39 | 0.721688% |
| C | 5404 | 8 | 0.148038% |
| D | 5405 | 118 | 2.183164% |
Noise dominated data is calculated using 1-second bins in cleaned event files. If a bin has >2000 counts, and if more than 50% of those come from <1% of pixels, then it is considered to be noise-dominated and hence unusable.
| Quadrant | # 1 sec bins | Bins with >0 counts | Bins with >2000 counts | High rate bins dominated by noise | Noise dominated (total time) | Noise dominated (detector-on time) | Marked lightcurve |
|---|---|---|---|---|---|---|---|
| A | 9111 | 5406 | 58 | 58 | 0.64% | 1.07% | 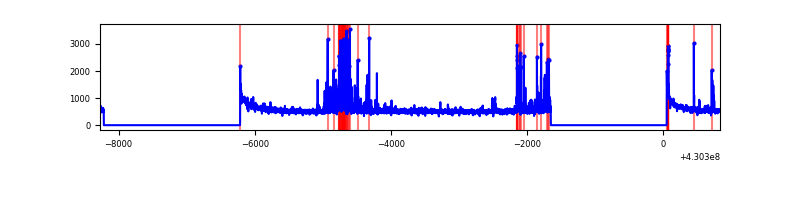 |
| B | 9111 | 5406 | 21 | 21 | 0.23% | 0.39% | 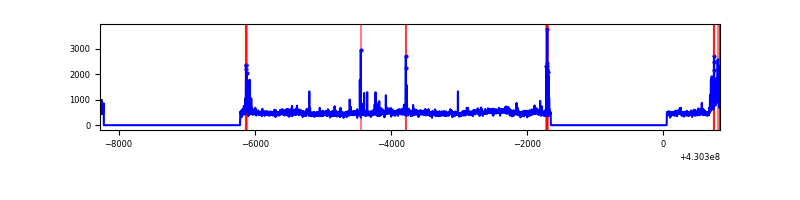 |
| C | 9111 | 5406 | 1 | 1 | 0.01% | 0.02% | 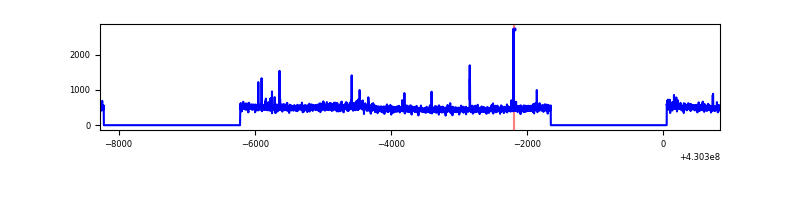 |
| D | 9112 | 5407 | 116 | 116 | 1.27% | 2.15% | 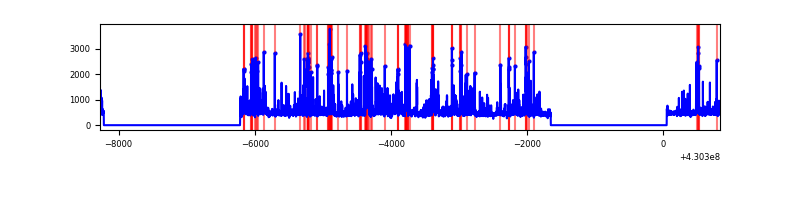 |
Top three noisy pixels from each quadrant. If the there are fewer than three noisy pixels in the level2.evt file, extra rows are filled as -1
| Pixel properties | Quadrant properties | ||||||
|---|---|---|---|---|---|---|---|
| Quadrant | DetID | PixID | Counts | Sigma | Mean | Median | Sigma |
| A | 10 | 83 | 590717 | 4863.7 | 597 | 587 | 121.3 |
| A | 13 | 248 | 354241 | 2914.73 | 597 | 587 | 121.3 |
| A | 15 | 237 | 35039 | 283.94 | 597 | 587 | 121.3 |
| B | 0 | 229 | 340793 | 2983.26 | 588 | 573 | 114.0 |
| B | 5 | 172 | 64823 | 563.38 | 588 | 573 | 114.0 |
| B | 0 | 245 | 26540 | 227.69 | 588 | 573 | 114.0 |
| C | 15 | 214 | 230526 | 1693.31 | 581 | 584 | 135.8 |
| C | 8 | 79 | 48208 | 350.71 | 581 | 584 | 135.8 |
| C | 14 | 254 | 23911 | 171.78 | 581 | 584 | 135.8 |
| D | 12 | 233 | 372229 | 2585.93 | 580 | 563 | 143.7 |
| D | 2 | 249 | 279503 | 1940.77 | 580 | 563 | 143.7 |
| D | 1 | 47 | 246341 | 1710.04 | 580 | 563 | 143.7 |
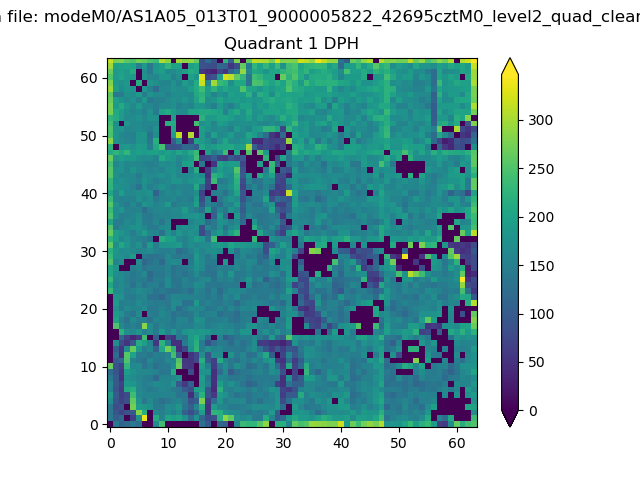
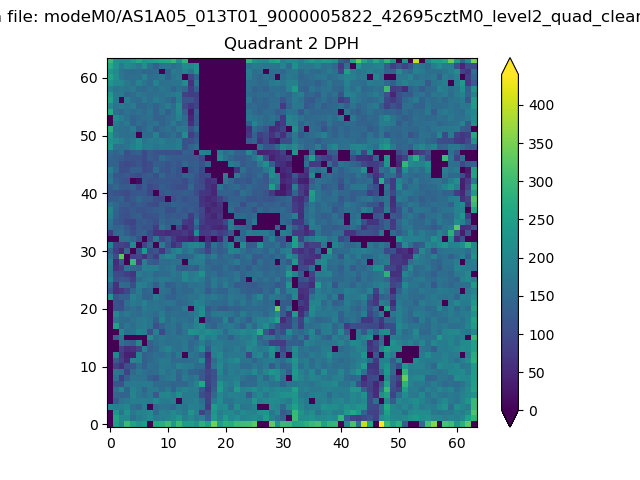
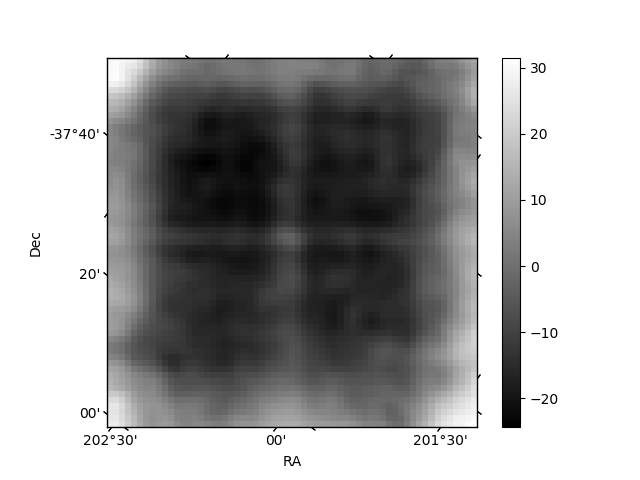
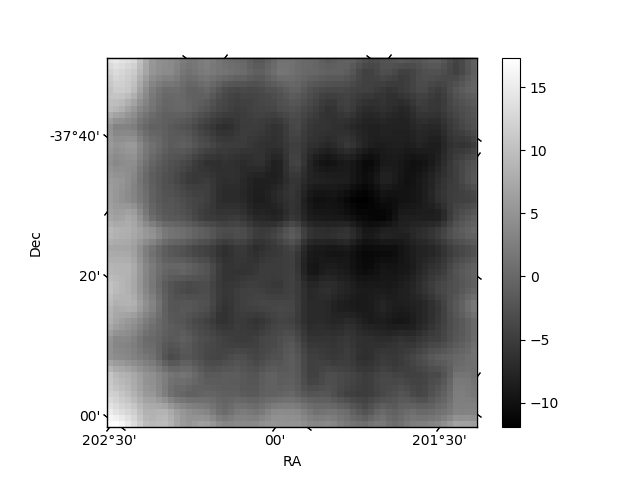
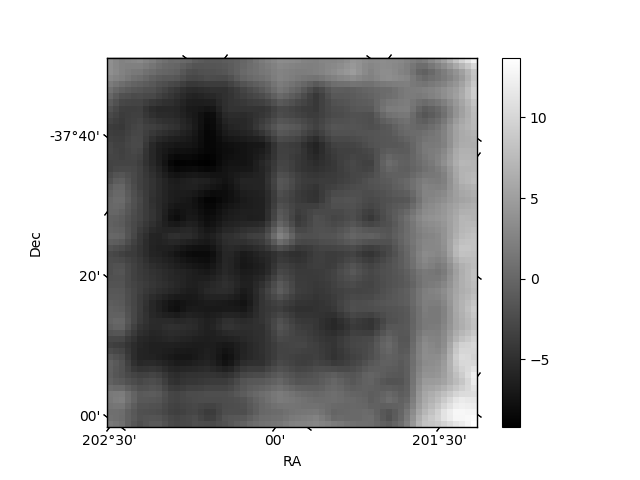
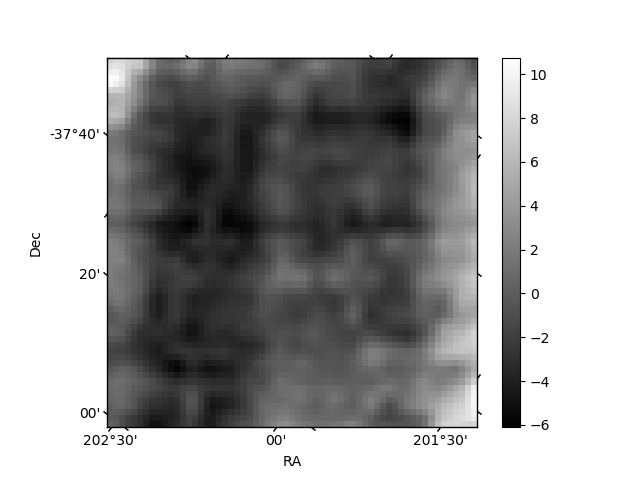
Histogram calculated using DETX and DETY for each event in the final _common_clean file
| Quadrant A |  |
 |
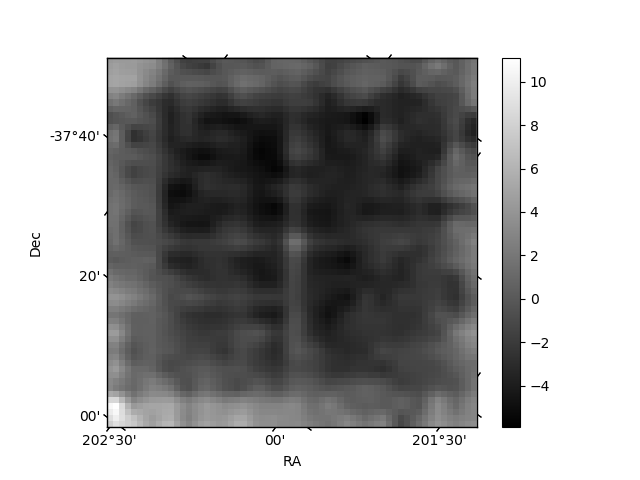
Quadrant B |
|---|---|---|---|
| Quadrant D | 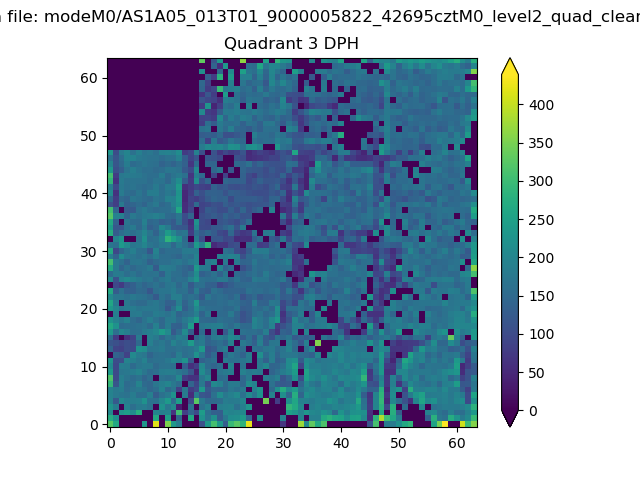 |
 |
Quadrant C |
| Plot type | Count rate plots | Images |
|---|---|---|
| Comparison with Poisson distribution Blue bars denote a histogram of data divided into 1 sec bins. Red curve is a Poisson curve with rate = median count rate of data. |
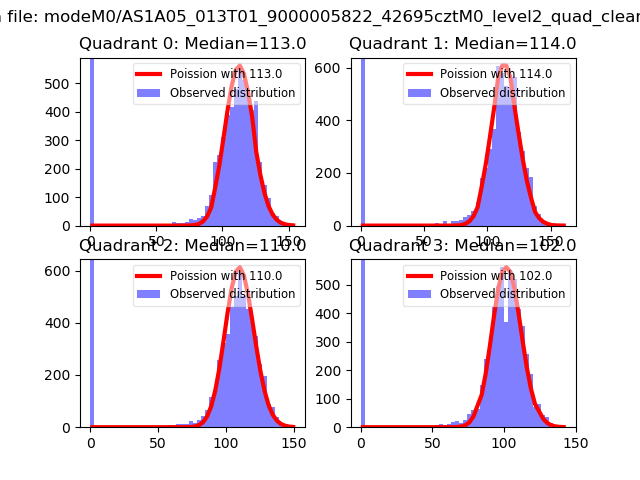 |
 |
| Quadrant-wise count rates Data is divided into 100 sec bins |
 |
|
| Module-wise count rates for Quadrant A Data is divided into 100 sec bins |
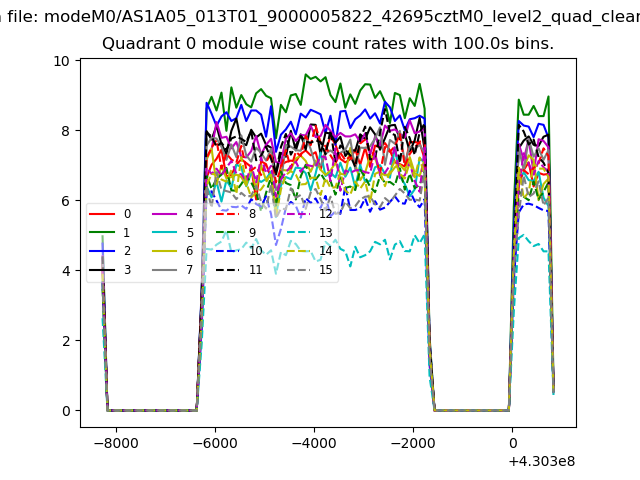 |
 |
| Module-wise count rates for Quadrant B Data is divided into 100 sec bins |
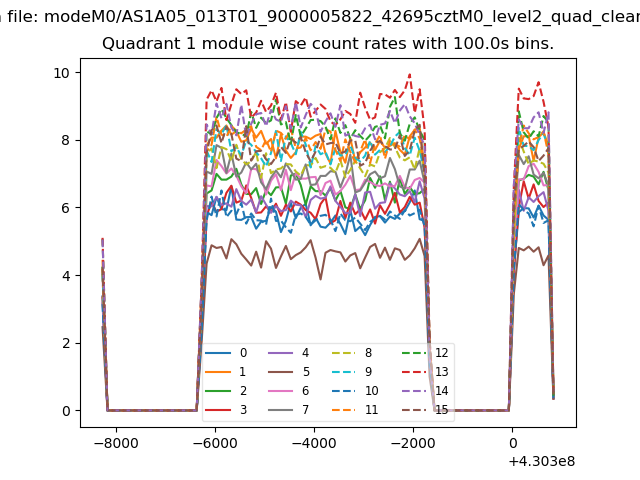 |
 |
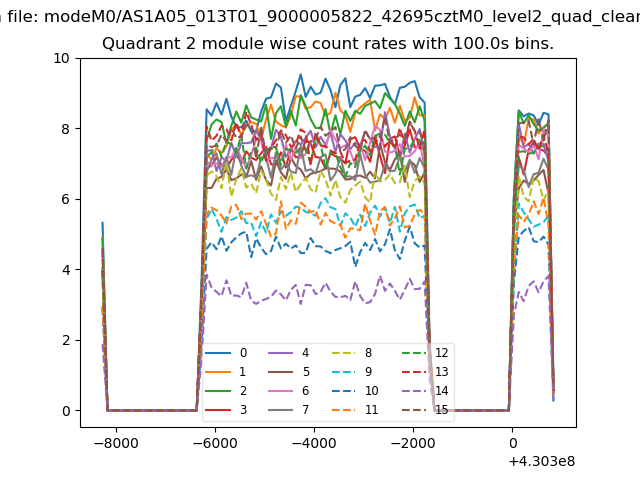
| Module-wise count rates for Quadrant C Data is divided into 100 sec bins |
 |
 |
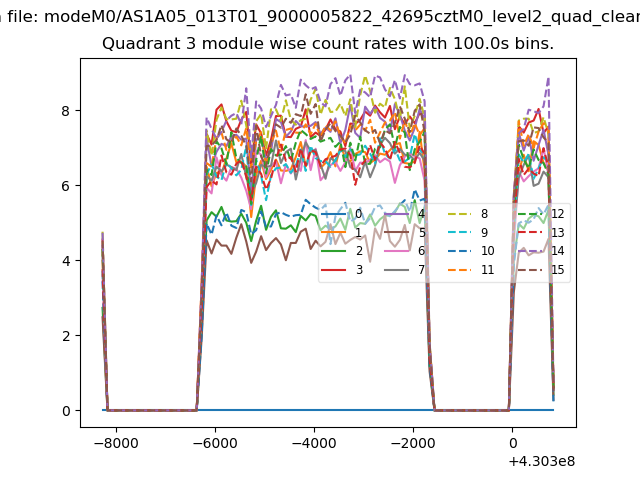
| Module-wise count rates for Quadrant D Data is divided into 100 sec bins |
 |
 |
| Parameter | Plot |
|---|---|
| CZT HV Monitor | 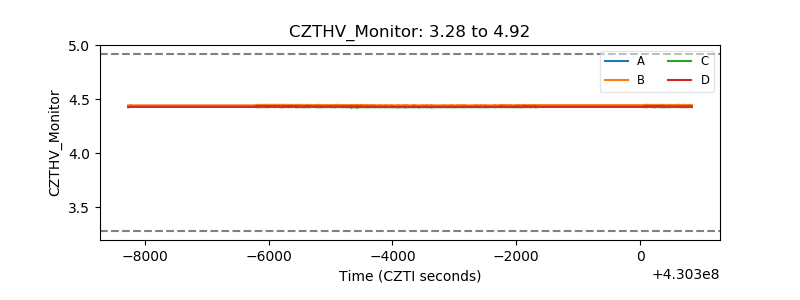 |
| D_VDD | 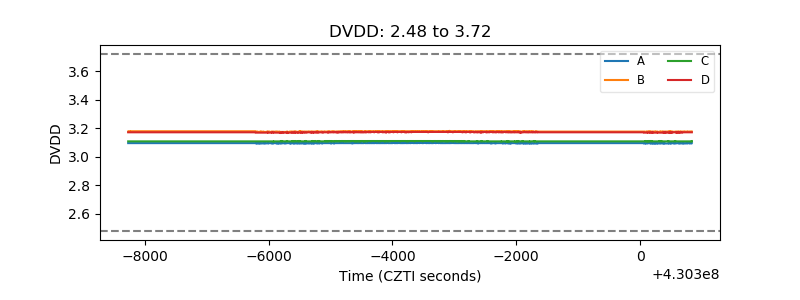 |
| Temperature 1 | 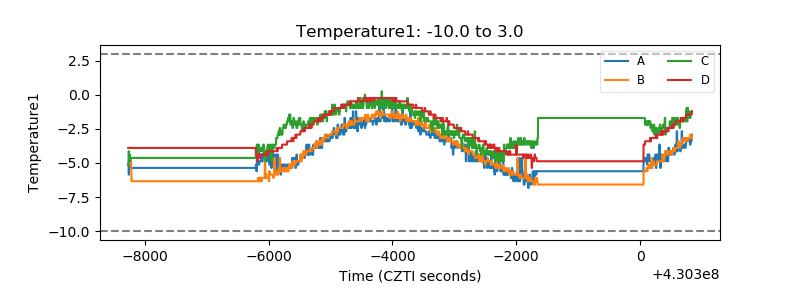 |
| Veto HV Monitor |  |
| Veto LLD | 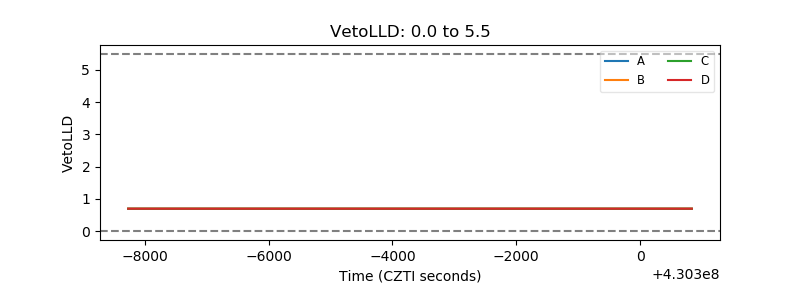 |
| Alpha Counter | 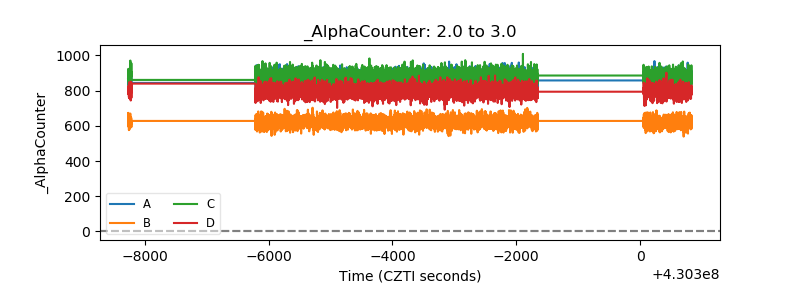 |
| _CPM_Rate | 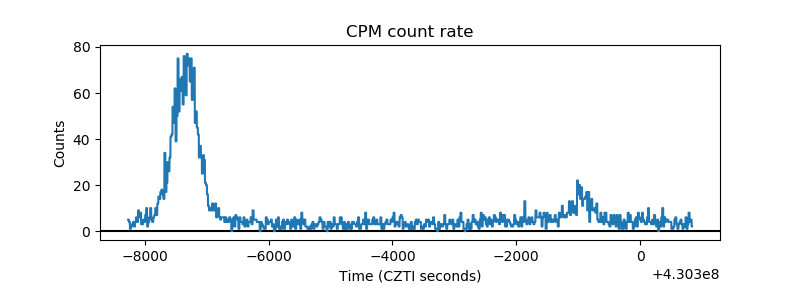 |
| CZT Counter | 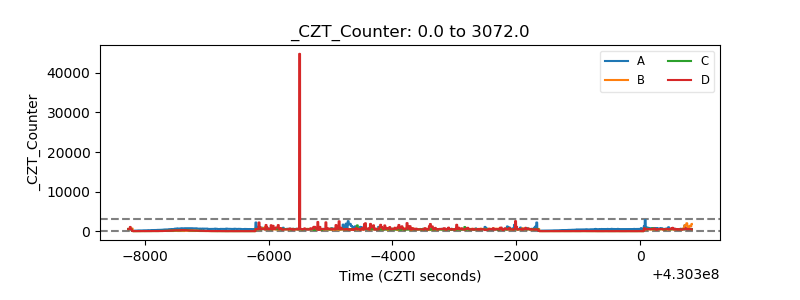 |
| +2.5 Volts monitor | 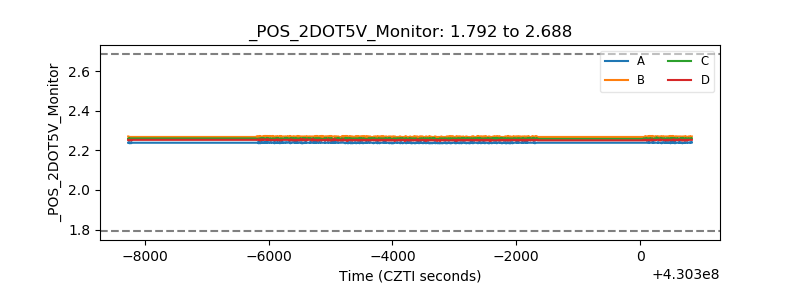 |
| +5 Volts monitor | 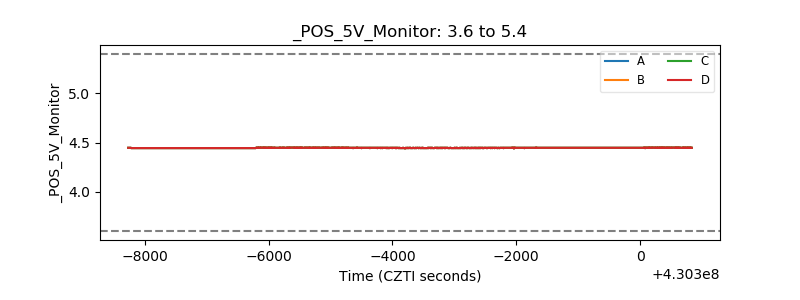 |
| _ROLL_ROT | 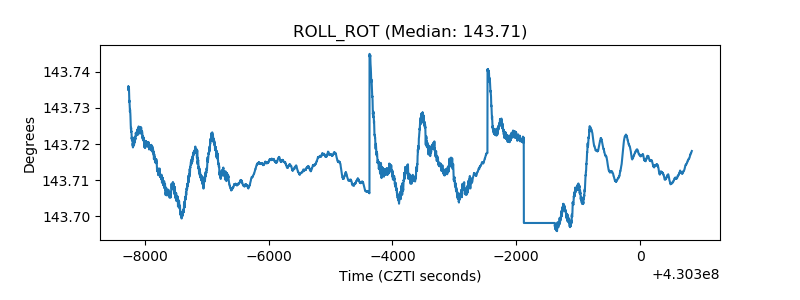 |
| _Roll_DEC | 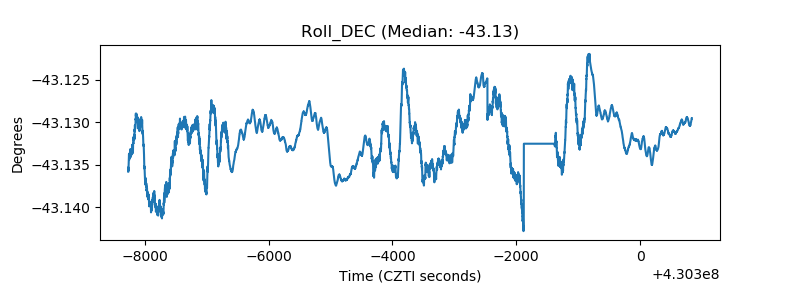 |
| _Roll_RA | 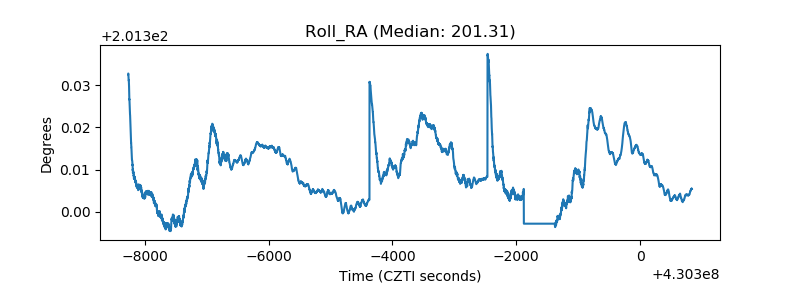 |
| Veto Counter | 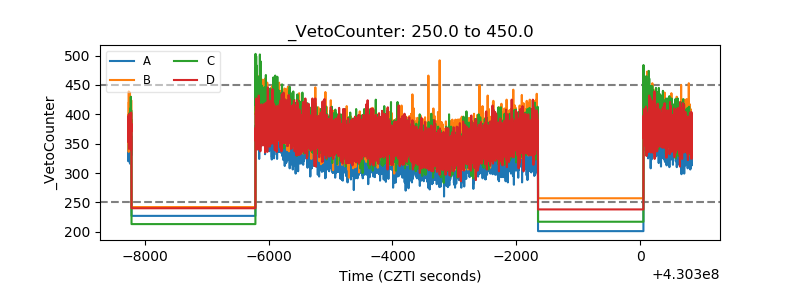 |