| Param | Original file | Final file |
|---|---|---|
| Filename | modeM0/AS1A05_013T01_9000005822_42696cztM0_level2.fits | modeM0/AS1A05_013T01_9000005822_42696cztM0_level2_quad_clean.evt |
| Size (bytes) | 395,363,520 | 94,452,480 |
| Size | 377.0 MB | 90.1 MB |
| Events in quadrant A | 3,266,238 | 646,257 |
| Events in quadrant B | 3,143,830 | 643,231 |
| Events in quadrant C | 2,798,956 | 633,407 |
| Events in quadrant D | 4,970,607 | 527,875 |
| Mode M0 | |||
|---|---|---|---|
| Quadrant | BADHDUFLAG | Total packets | Discarded packets |
| A | 0 | 13074 | 2 |
| B | 0 | 13422 | 2 |
| C | 0 | 11921 | 2 |
| D | 0 | 18692 | 2 |
| Mode M9 | |||
|---|---|---|---|
| Quadrant | BADHDUFLAG | Total packets | Discarded packets |
| A | 0 | 27 | 0 |
| B | 0 | 28 | 0 |
| C | 0 | 28 | 0 |
| D | 0 | 28 | 0 |
| Mode SS | |||
|---|---|---|---|
| Quadrant | BADHDUFLAG | Total packets | Discarded packets |
| A | 0 | 120 | 0 |
| B | 0 | 120 | 0 |
| C | 0 | 120 | 0 |
| D | 0 | 120 | 0 |
| Quadrant | Total seconds | Saturated seconds | Saturation percentage |
|---|---|---|---|
| A | 5850 | 29 | 0.495726% |
| B | 5850 | 144 | 2.461538% |
| C | 5850 | 4 | 0.068376% |
| D | 5850 | 686 | 11.726496% |
Noise dominated data is calculated using 1-second bins in cleaned event files. If a bin has >2000 counts, and if more than 50% of those come from <1% of pixels, then it is considered to be noise-dominated and hence unusable.
| Quadrant | # 1 sec bins | Bins with >0 counts | Bins with >2000 counts | High rate bins dominated by noise | Noise dominated (total time) | Noise dominated (detector-on time) | Marked lightcurve |
|---|---|---|---|---|---|---|---|
| A | 7254 | 5851 | 19 | 19 | 0.26% | 0.32% | 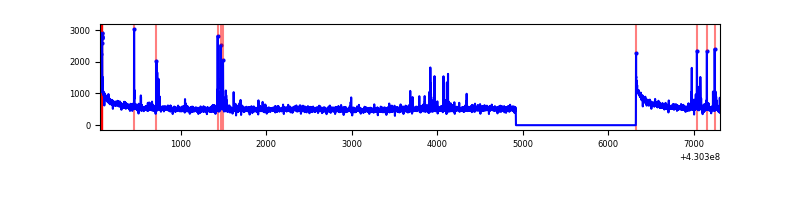 |
| B | 7254 | 5851 | 108 | 108 | 1.49% | 1.85% | 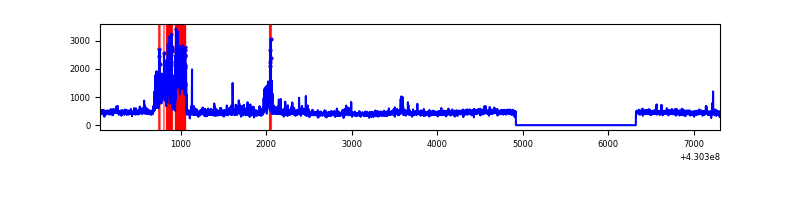 |
| C | 7254 | 5851 | 0 | 0 | 0.00% | 0.00% | 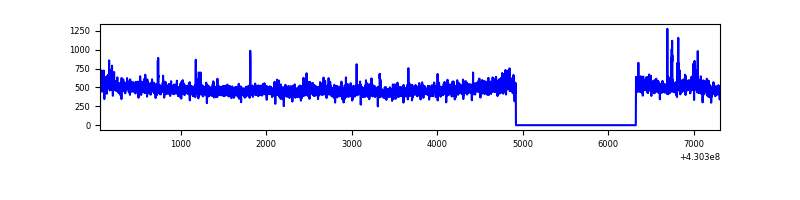 |
| D | 7254 | 5851 | 617 | 617 | 8.51% | 10.55% | 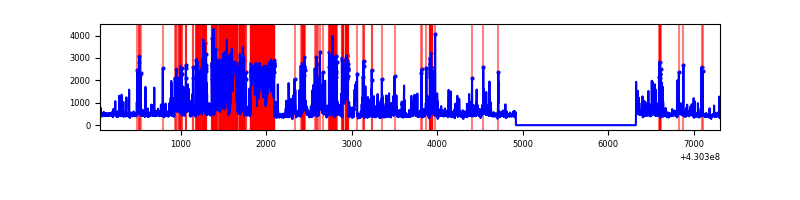 |
Top three noisy pixels from each quadrant. If the there are fewer than three noisy pixels in the level2.evt file, extra rows are filled as -1
| Pixel properties | Quadrant properties | ||||||
|---|---|---|---|---|---|---|---|
| Quadrant | DetID | PixID | Counts | Sigma | Mean | Median | Sigma |
| A | 10 | 83 | 625778 | 4746.27 | 643 | 632 | 131.7 |
| A | 13 | 248 | 135241 | 1021.99 | 643 | 632 | 131.7 |
| A | 13 | 254 | 9825 | 69.8 | 643 | 632 | 131.7 |
| B | 0 | 229 | 606701 | 4903.28 | 631 | 615 | 123.6 |
| B | 5 | 172 | 28457 | 225.24 | 631 | 615 | 123.6 |
| B | 12 | 111 | 15465 | 120.14 | 631 | 615 | 123.6 |
| C | 15 | 214 | 246535 | 1687.47 | 624 | 626 | 145.7 |
| C | 8 | 79 | 48048 | 325.42 | 624 | 626 | 145.7 |
| C | 14 | 254 | 21488 | 143.16 | 624 | 626 | 145.7 |
| D | 1 | 47 | 1297536 | 8917.65 | 588 | 572 | 145.4 |
| D | 1 | 52 | 801629 | 5507.9 | 588 | 572 | 145.4 |
| D | 2 | 249 | 247903 | 1700.6 | 588 | 572 | 145.4 |
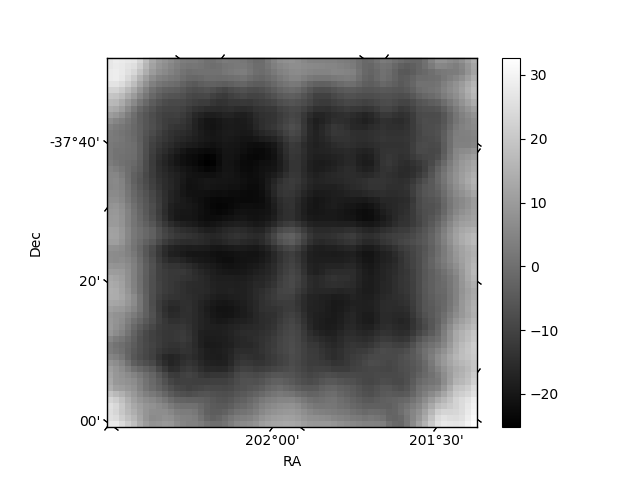
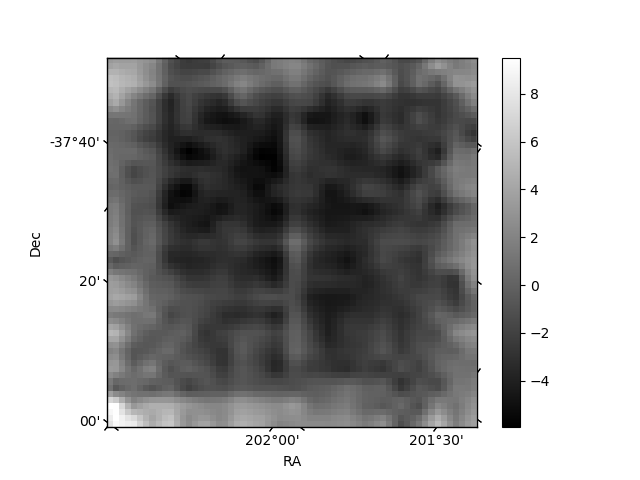
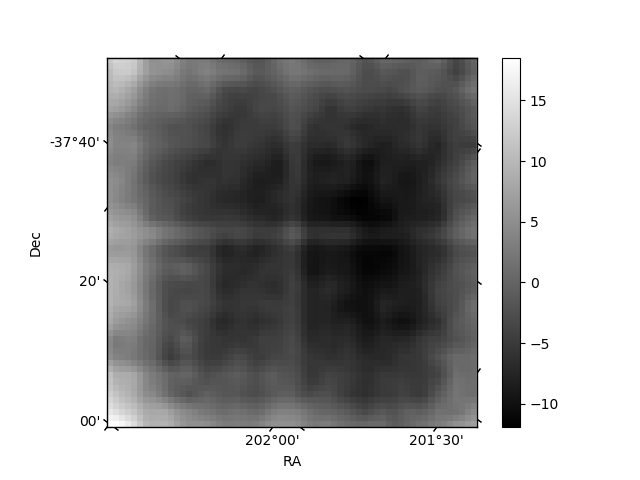
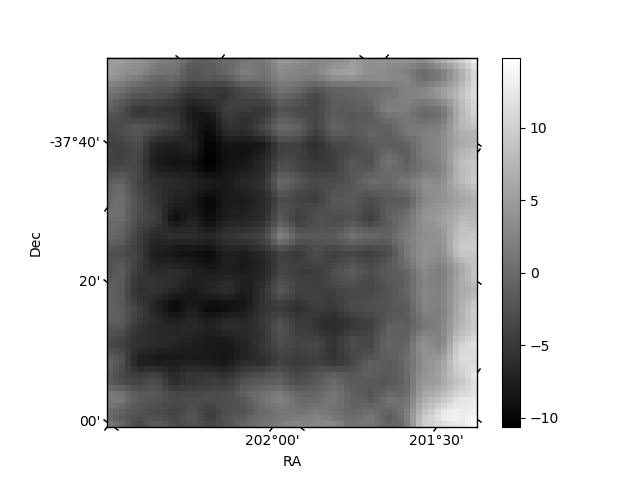
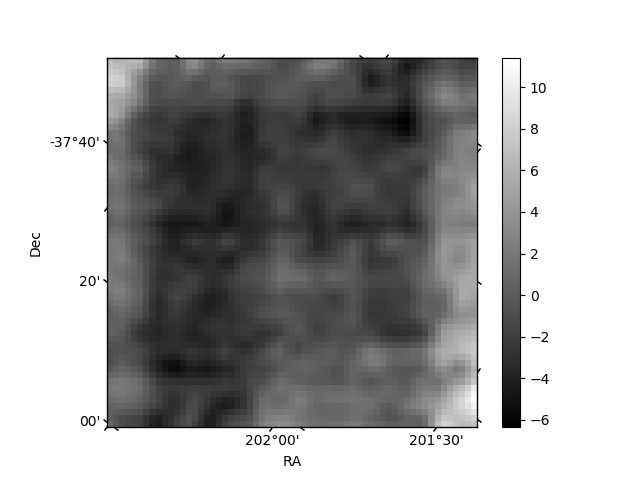
Histogram calculated using DETX and DETY for each event in the final _common_clean file
| Quadrant A | 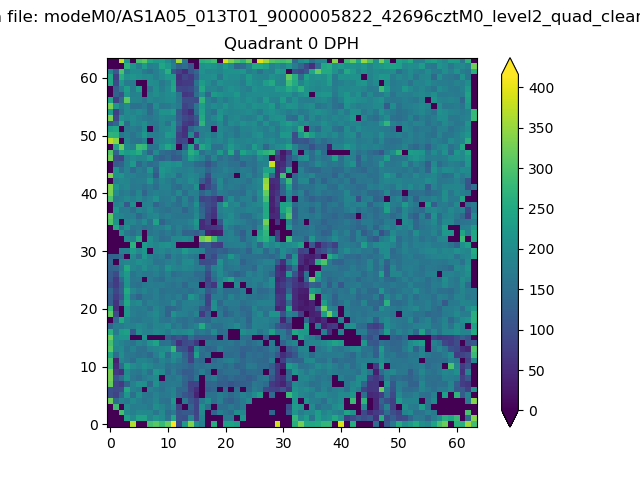 |
 |
Quadrant B |
|---|---|---|---|
| Quadrant D | 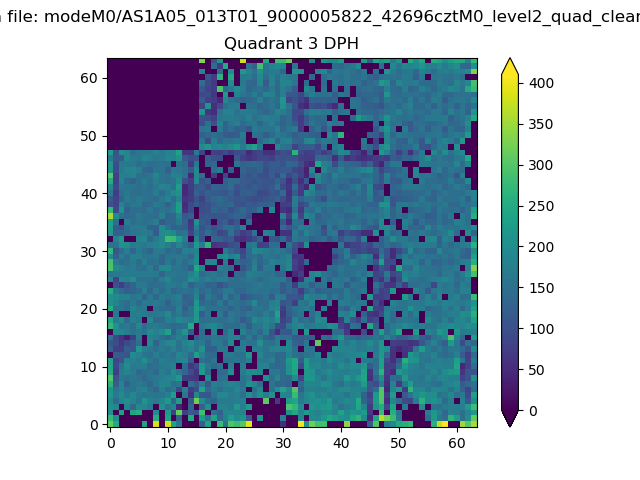 |
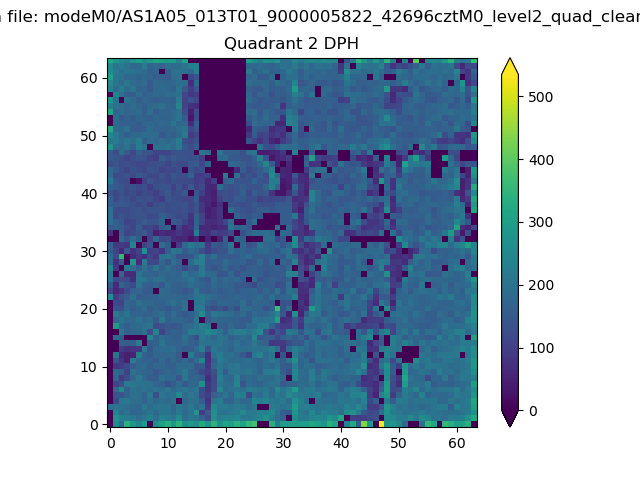 |
Quadrant C |
| Plot type | Count rate plots | Images |
|---|---|---|
| Comparison with Poisson distribution Blue bars denote a histogram of data divided into 1 sec bins. Red curve is a Poisson curve with rate = median count rate of data. |
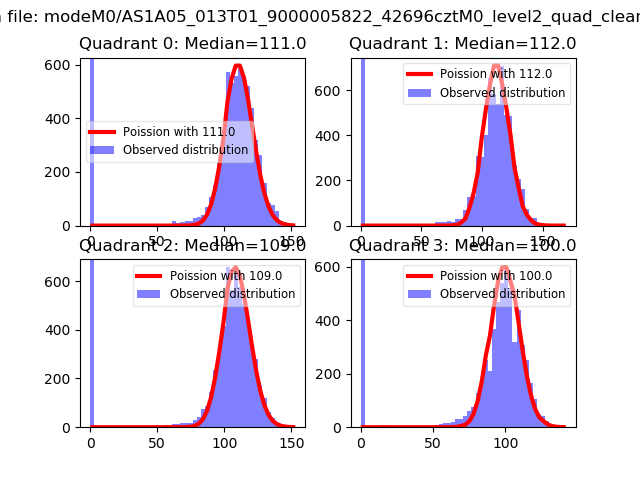 |
 |
| Quadrant-wise count rates Data is divided into 100 sec bins |
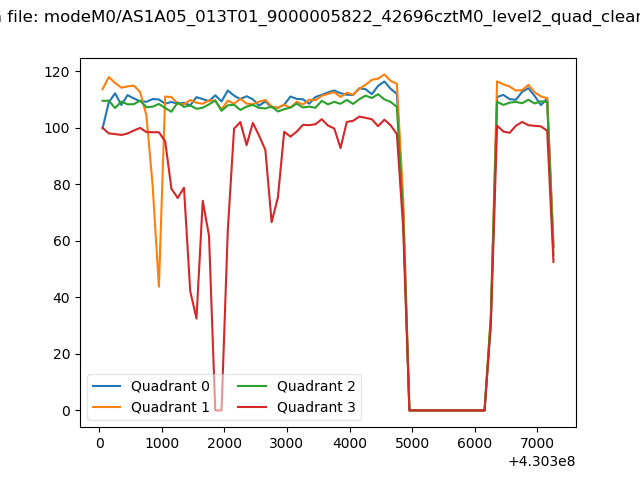 |
|
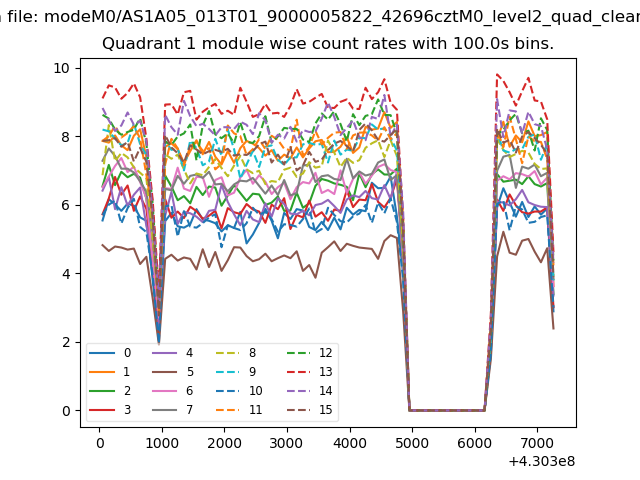
| Module-wise count rates for Quadrant A Data is divided into 100 sec bins |
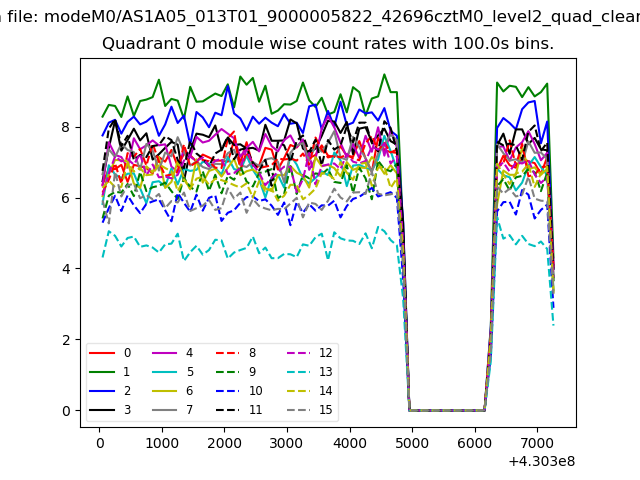 |
 |
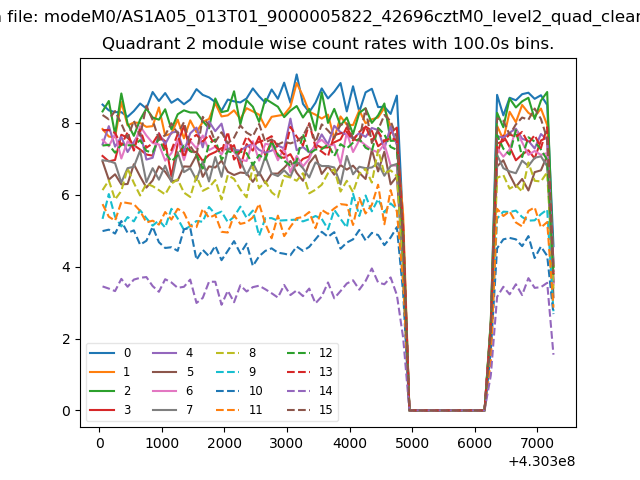
| Module-wise count rates for Quadrant B Data is divided into 100 sec bins |
 |
 |
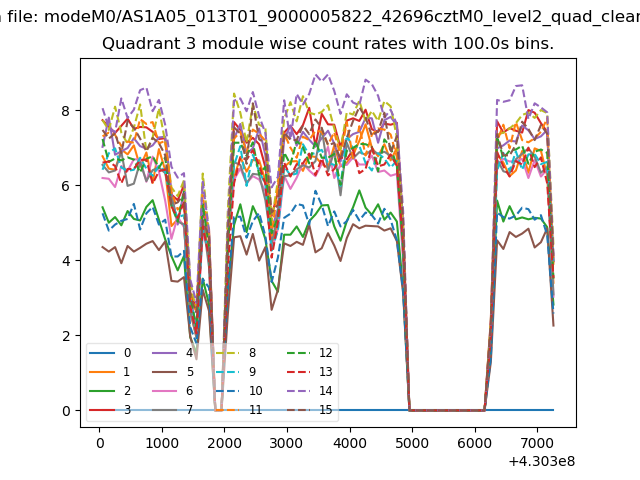
| Module-wise count rates for Quadrant C Data is divided into 100 sec bins |
 |
 |
| Module-wise count rates for Quadrant D Data is divided into 100 sec bins |
 |
 |
| Parameter | Plot |
|---|---|
| CZT HV Monitor | 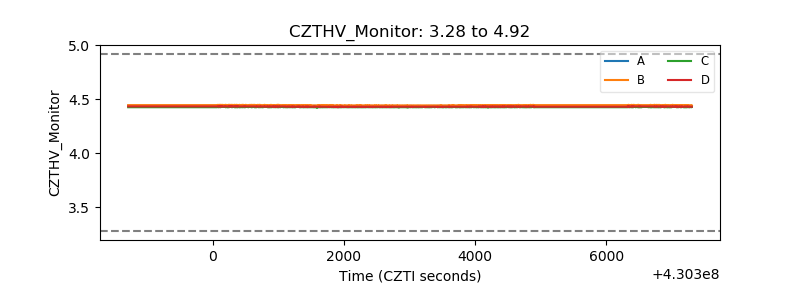 |
| D_VDD | 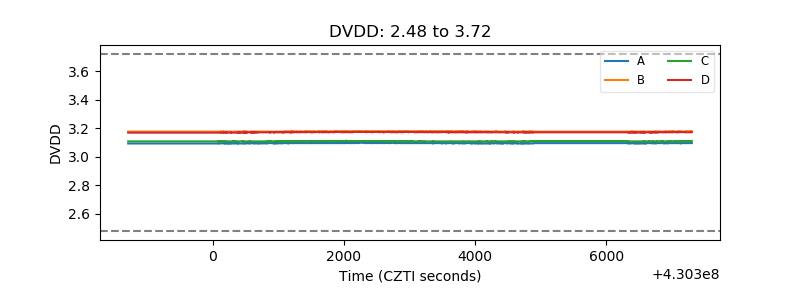 |
| Temperature 1 | 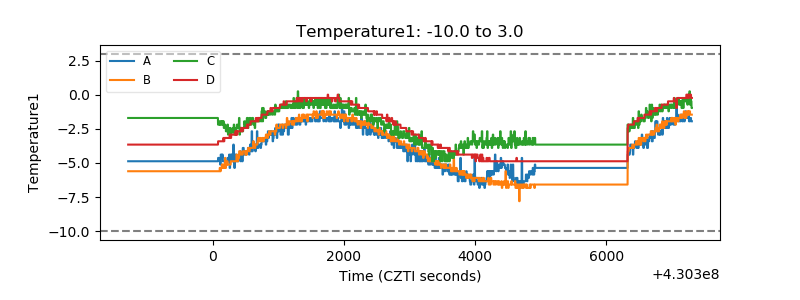 |
| Veto HV Monitor | 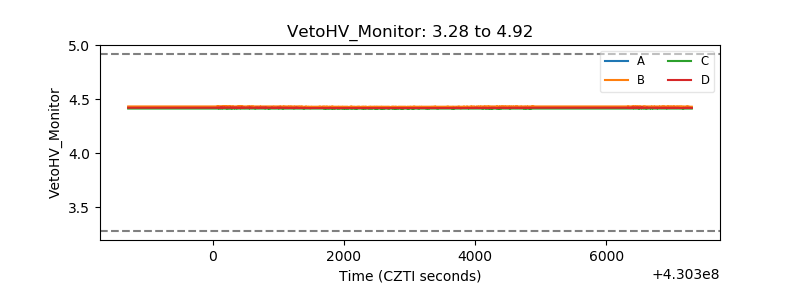 |
| Veto LLD | 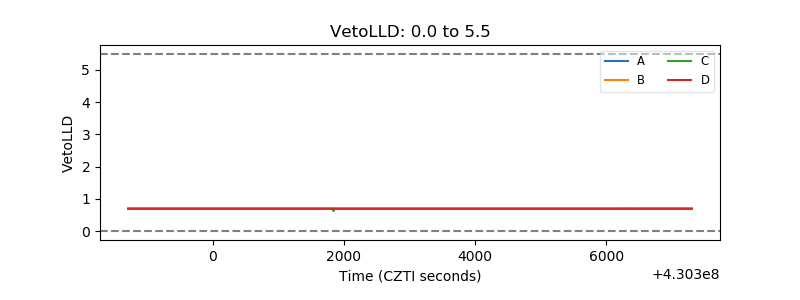 |
| Alpha Counter | 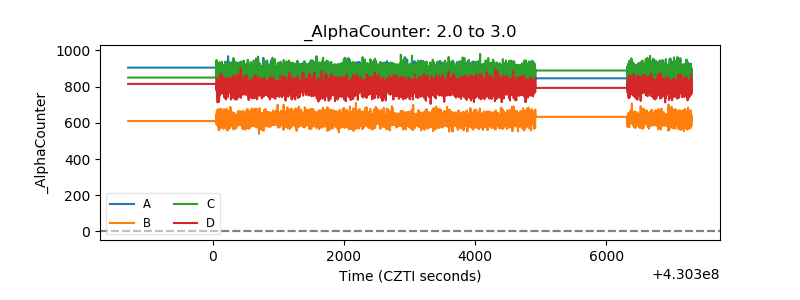 |
| _CPM_Rate | 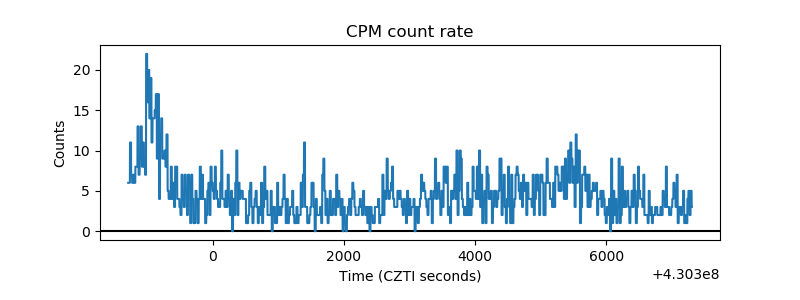 |
| CZT Counter | 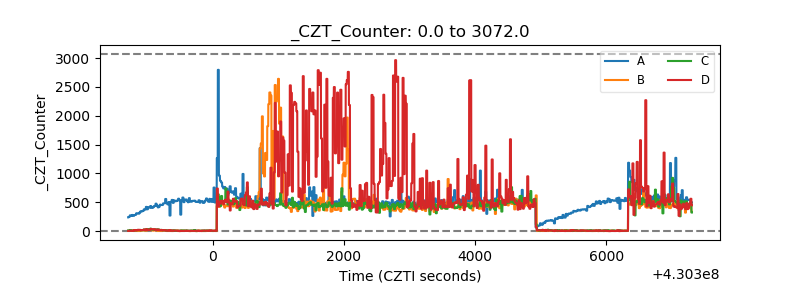 |
| +2.5 Volts monitor | 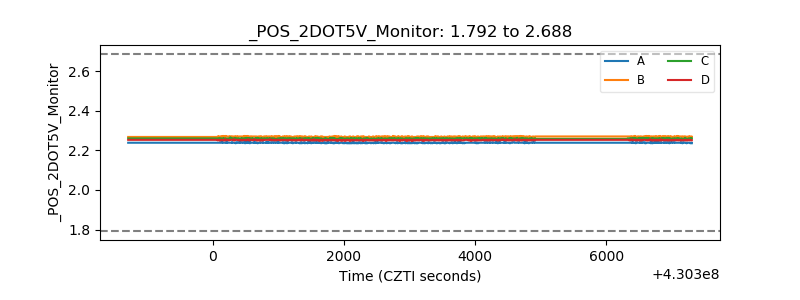 |
| +5 Volts monitor | 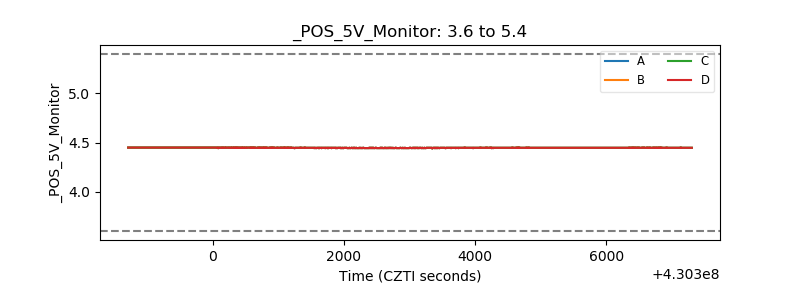 |
| _ROLL_ROT | 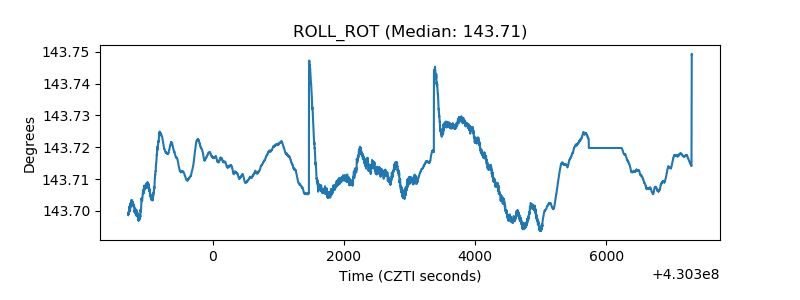 |
| _Roll_DEC | 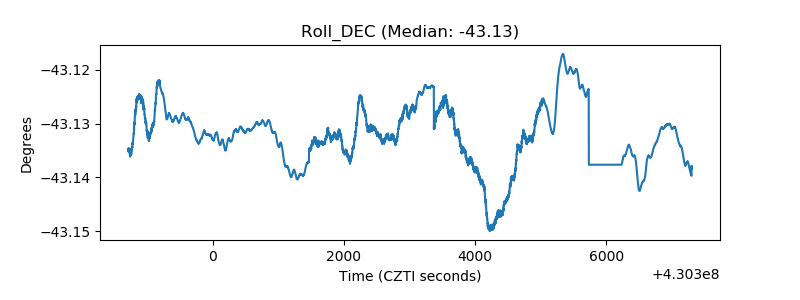 |
| _Roll_RA | 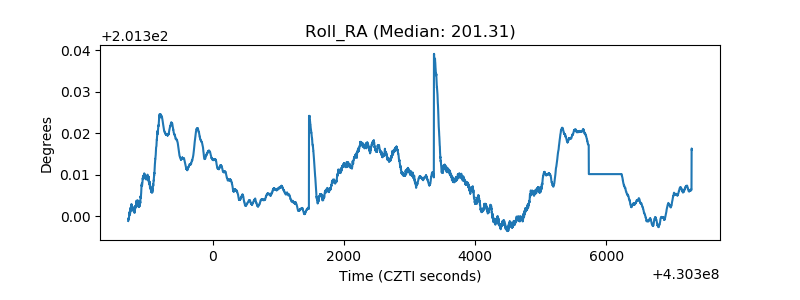 |
| Veto Counter | 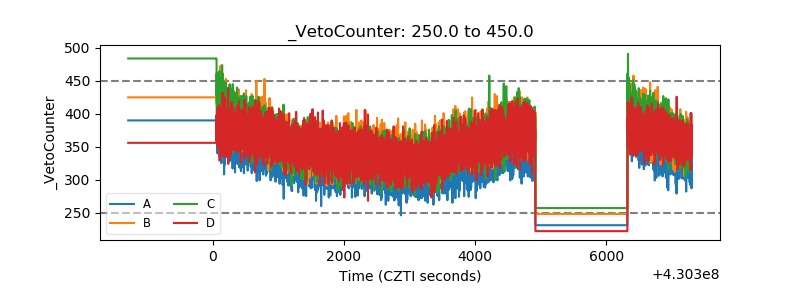 |