| Param | Original file | Final file |
|---|---|---|
| Filename | modeM0/AS1A05_013T01_9000005822_42697cztM0_level2.fits | modeM0/AS1A05_013T01_9000005822_42697cztM0_level2_quad_clean.evt |
| Size (bytes) | 341,208,000 | 97,228,800 |
| Size | 325.4 MB | 92.7 MB |
| Events in quadrant A | 3,302,916 | 651,939 |
| Events in quadrant B | 2,820,153 | 655,159 |
| Events in quadrant C | 2,904,615 | 635,015 |
| Events in quadrant D | 3,142,623 | 589,043 |
| Mode M0 | |||
|---|---|---|---|
| Quadrant | BADHDUFLAG | Total packets | Discarded packets |
| A | 0 | 13211 | 2 |
| B | 0 | 12460 | 2 |
| C | 0 | 12202 | 2 |
| D | 0 | 13429 | 2 |
| Mode M9 | |||
|---|---|---|---|
| Quadrant | BADHDUFLAG | Total packets | Discarded packets |
| A | 0 | 13 | 0 |
| B | 0 | 14 | 0 |
| C | 0 | 14 | 0 |
| D | 0 | 14 | 0 |
| Mode SS | |||
|---|---|---|---|
| Quadrant | BADHDUFLAG | Total packets | Discarded packets |
| A | 0 | 120 | 0 |
| B | 0 | 120 | 0 |
| C | 0 | 120 | 0 |
| D | 0 | 120 | 0 |
| Quadrant | Total seconds | Saturated seconds | Saturation percentage |
|---|---|---|---|
| A | 5908 | 28 | 0.473934% |
| B | 5908 | 56 | 0.947867% |
| C | 5908 | 6 | 0.101557% |
| D | 5908 | 49 | 0.829384% |
Noise dominated data is calculated using 1-second bins in cleaned event files. If a bin has >2000 counts, and if more than 50% of those come from <1% of pixels, then it is considered to be noise-dominated and hence unusable.
| Quadrant | # 1 sec bins | Bins with >0 counts | Bins with >2000 counts | High rate bins dominated by noise | Noise dominated (total time) | Noise dominated (detector-on time) | Marked lightcurve |
|---|---|---|---|---|---|---|---|
| A | 7190 | 5909 | 18 | 18 | 0.25% | 0.30% | 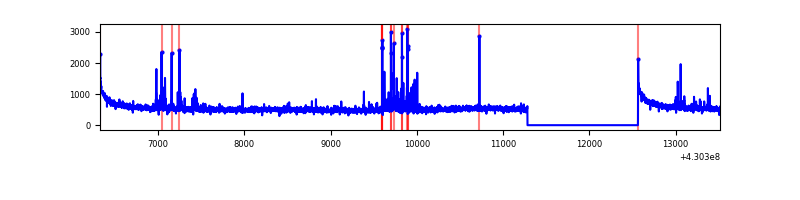 |
| B | 7190 | 5909 | 45 | 45 | 0.63% | 0.76% | 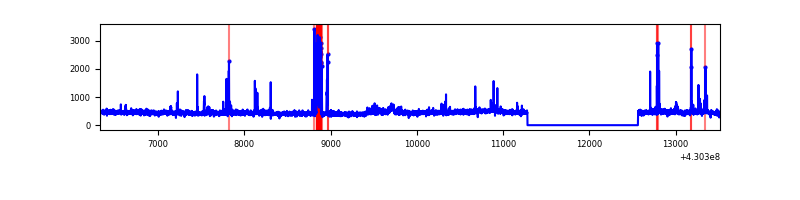 |
| C | 7190 | 5909 | 0 | 0 | 0.00% | 0.00% | 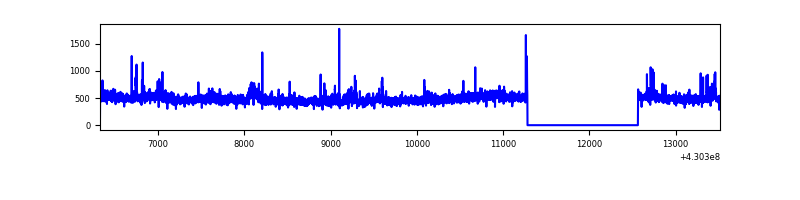 |
| D | 7190 | 5909 | 40 | 40 | 0.56% | 0.68% | 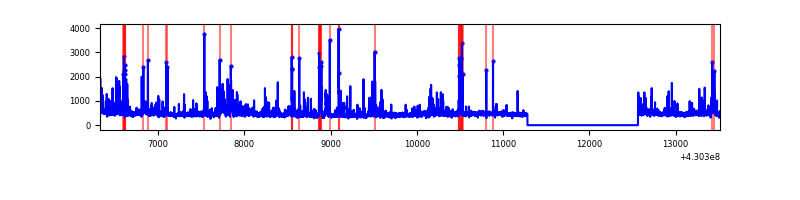 |
Top three noisy pixels from each quadrant. If the there are fewer than three noisy pixels in the level2.evt file, extra rows are filled as -1
| Pixel properties | Quadrant properties | ||||||
|---|---|---|---|---|---|---|---|
| Quadrant | DetID | PixID | Counts | Sigma | Mean | Median | Sigma |
| A | 10 | 83 | 638877 | 4786.65 | 647 | 634 | 133.3 |
| A | 13 | 248 | 127932 | 954.7 | 647 | 634 | 133.3 |
| A | 13 | 6 | 15041 | 108.05 | 647 | 634 | 133.3 |
| B | 5 | 172 | 177882 | 1423.87 | 638 | 620 | 124.5 |
| B | 0 | 229 | 64330 | 511.75 | 638 | 620 | 124.5 |
| B | 0 | 245 | 21300 | 166.11 | 638 | 620 | 124.5 |
| C | 15 | 214 | 248332 | 1683.93 | 628 | 630 | 147.1 |
| C | 8 | 79 | 114146 | 771.7 | 628 | 630 | 147.1 |
| C | 14 | 254 | 42788 | 286.6 | 628 | 630 | 147.1 |
| D | 1 | 52 | 243165 | 1559.78 | 633 | 616 | 155.5 |
| D | 12 | 233 | 188629 | 1209.07 | 633 | 616 | 155.5 |
| D | 2 | 249 | 71673 | 456.95 | 633 | 616 | 155.5 |
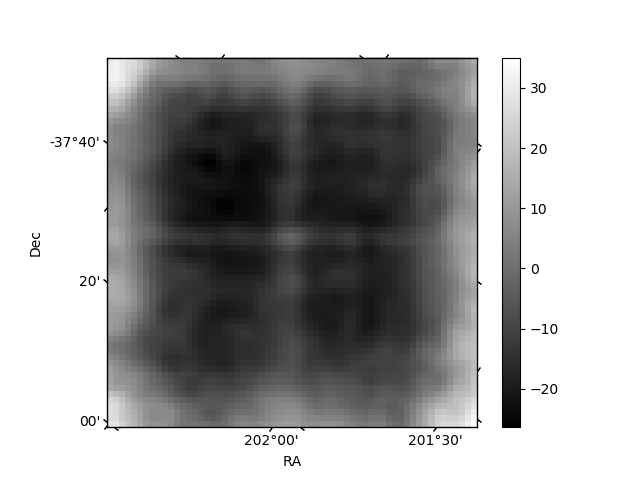
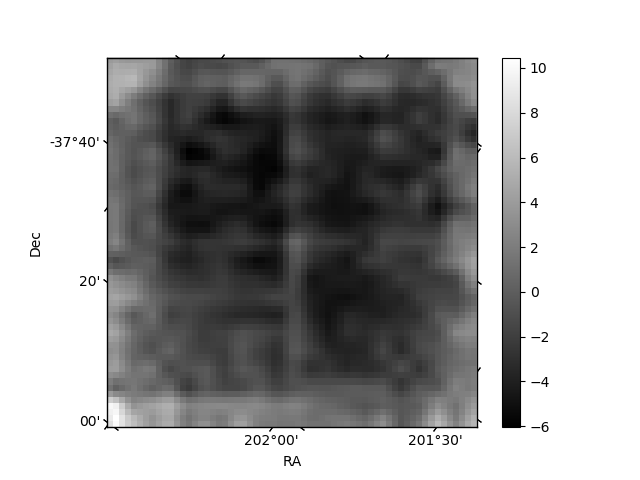
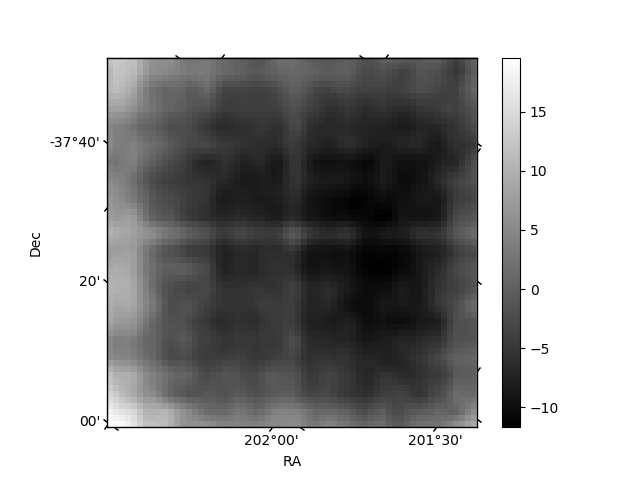
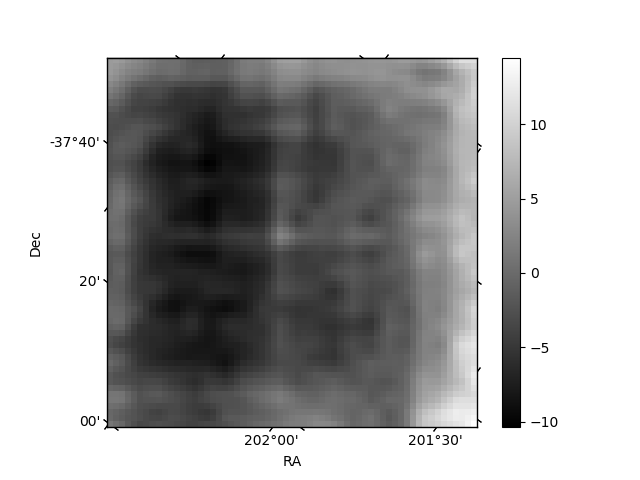
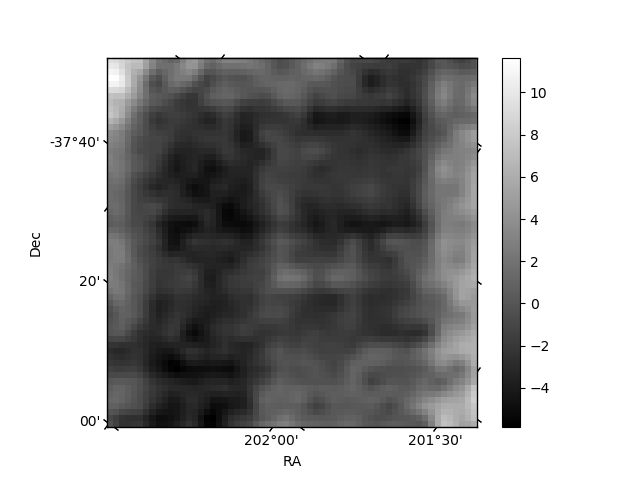
Histogram calculated using DETX and DETY for each event in the final _common_clean file
| Quadrant A | 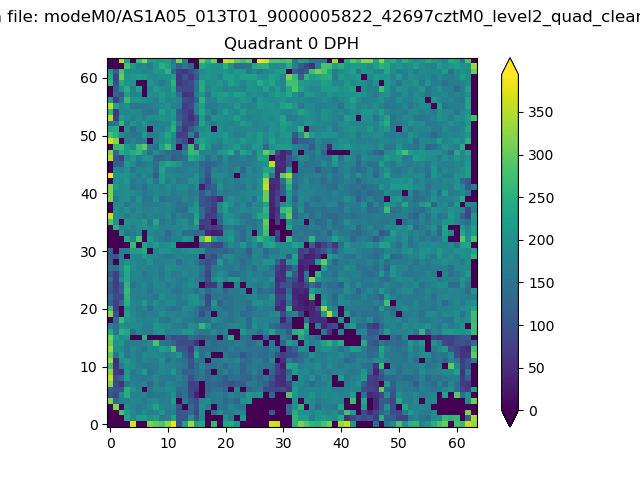 |
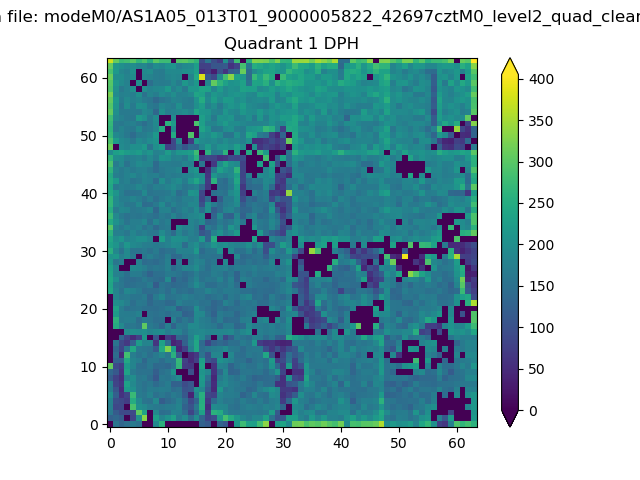 |
Quadrant B |
|---|---|---|---|
| Quadrant D | 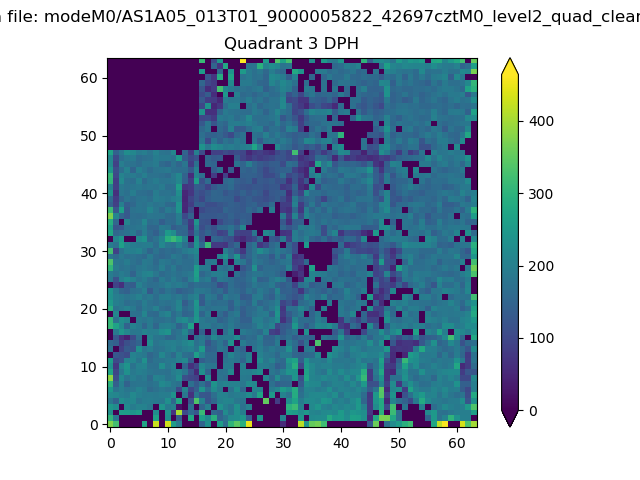 |
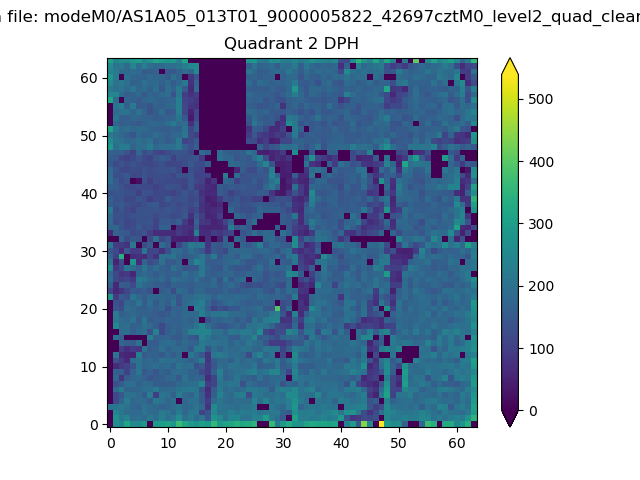 |
Quadrant C |
| Plot type | Count rate plots | Images |
|---|---|---|
| Comparison with Poisson distribution Blue bars denote a histogram of data divided into 1 sec bins. Red curve is a Poisson curve with rate = median count rate of data. |
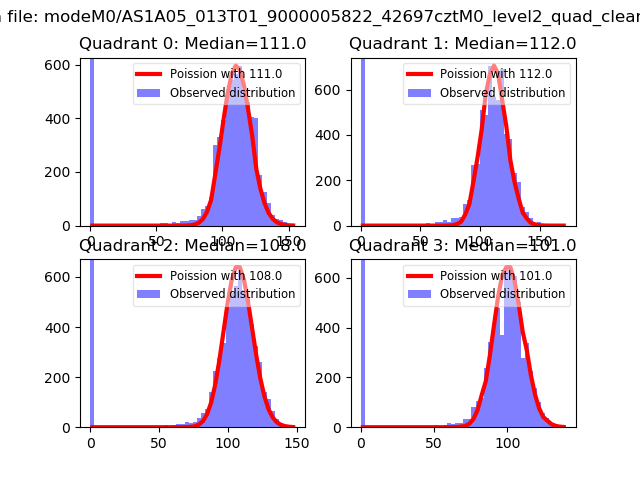 |
 |
| Quadrant-wise count rates Data is divided into 100 sec bins |
 |
|
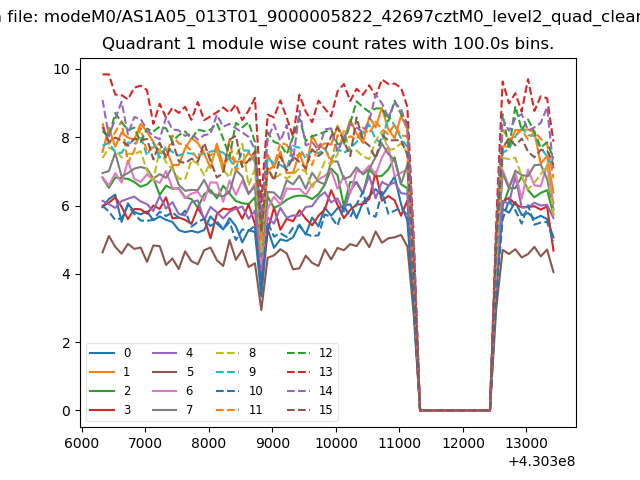
| Module-wise count rates for Quadrant A Data is divided into 100 sec bins |
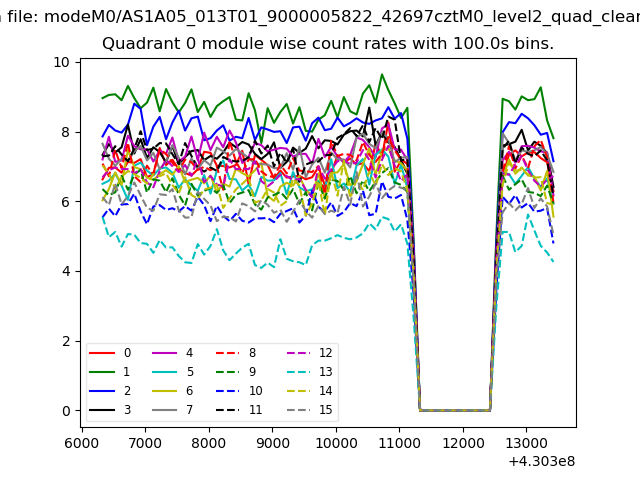 |
 |
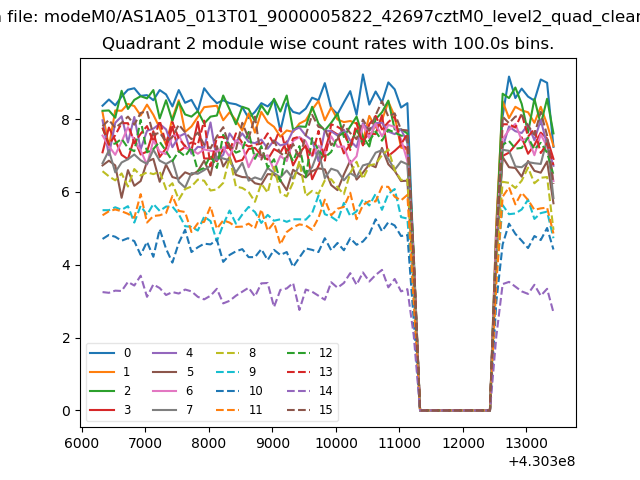
| Module-wise count rates for Quadrant B Data is divided into 100 sec bins |
 |
 |
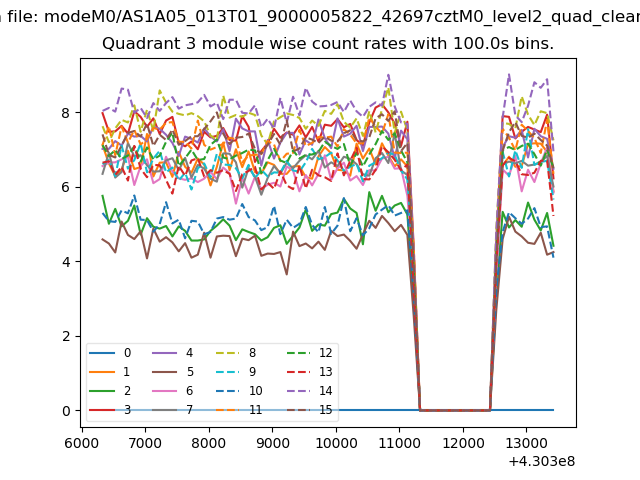
| Module-wise count rates for Quadrant C Data is divided into 100 sec bins |
 |
 |
| Module-wise count rates for Quadrant D Data is divided into 100 sec bins |
 |
 |
| Parameter | Plot |
|---|---|
| CZT HV Monitor | 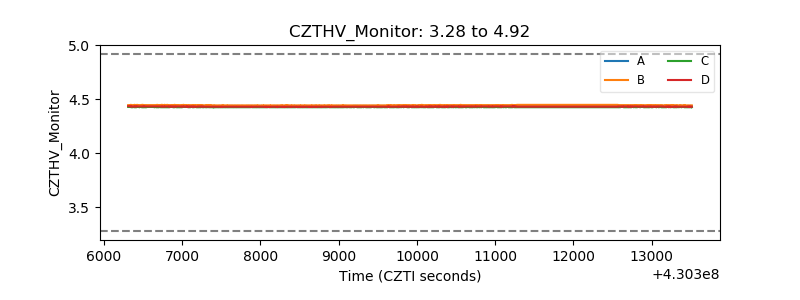 |
| D_VDD | 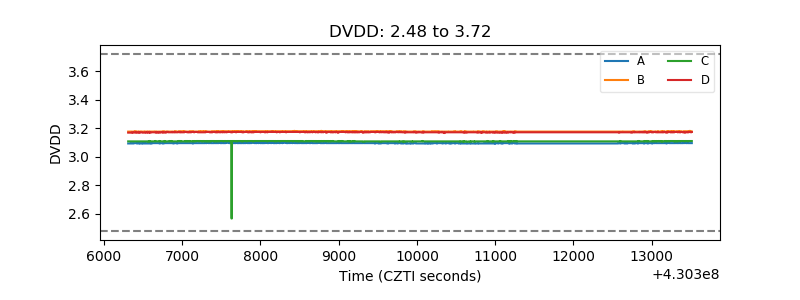 |
| Temperature 1 | 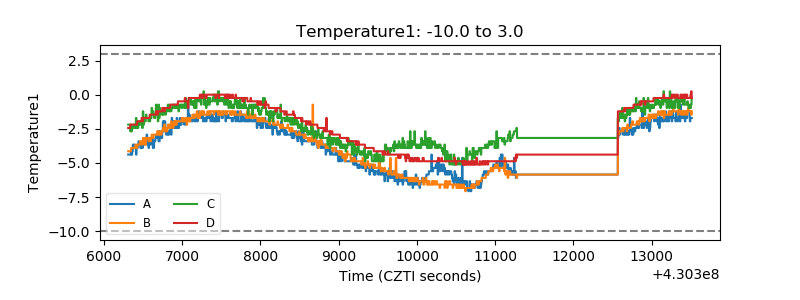 |
| Veto HV Monitor | 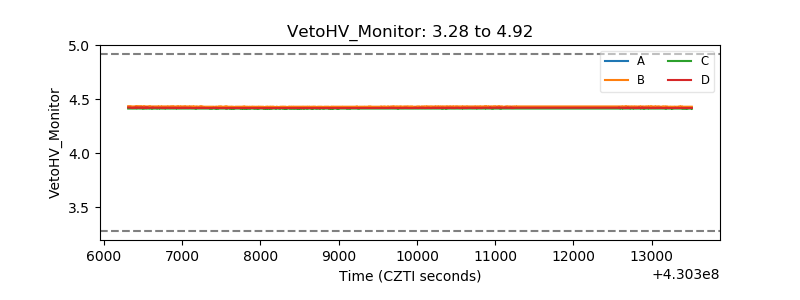 |
| Veto LLD | 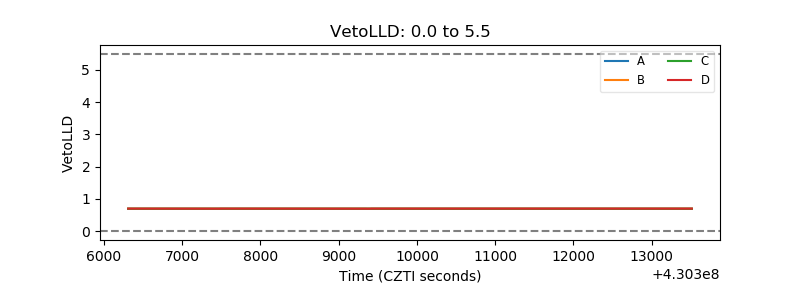 |
| Alpha Counter | 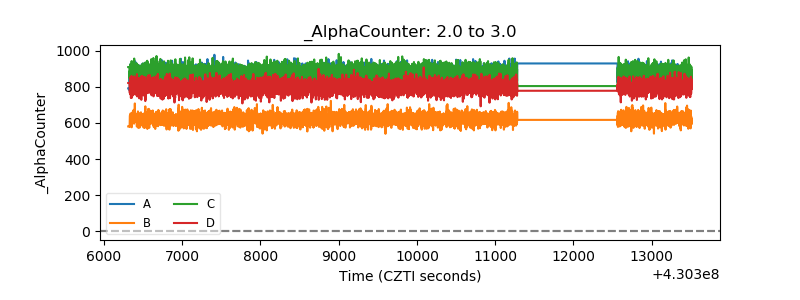 |
| _CPM_Rate | 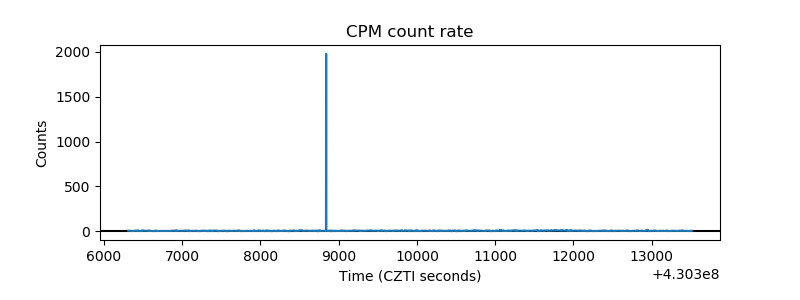 |
| CZT Counter | 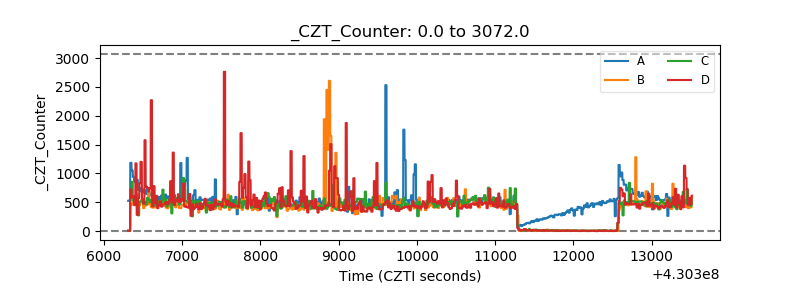 |
| +2.5 Volts monitor | 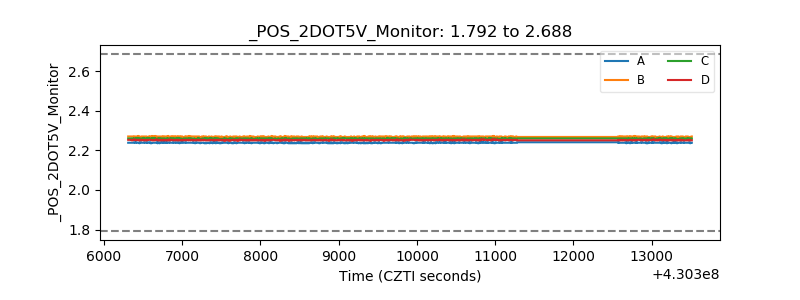 |
| +5 Volts monitor | 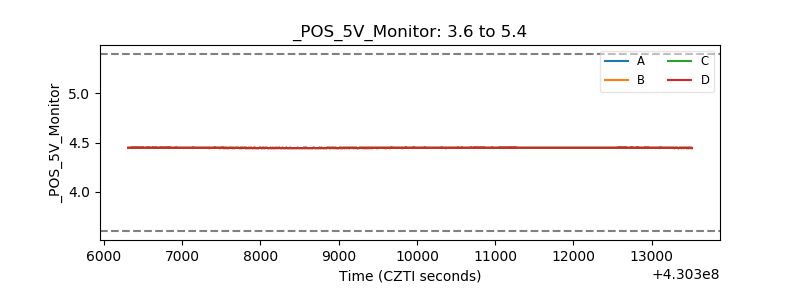 |
| _ROLL_ROT | 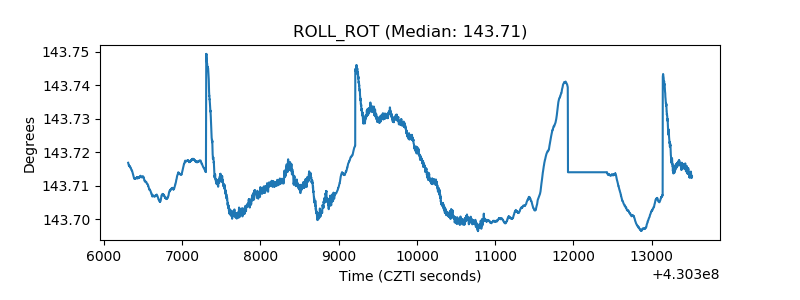 |
| _Roll_DEC | 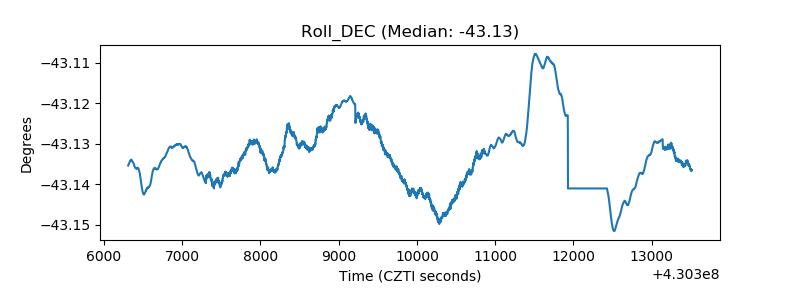 |
| _Roll_RA |  |
| Veto Counter | 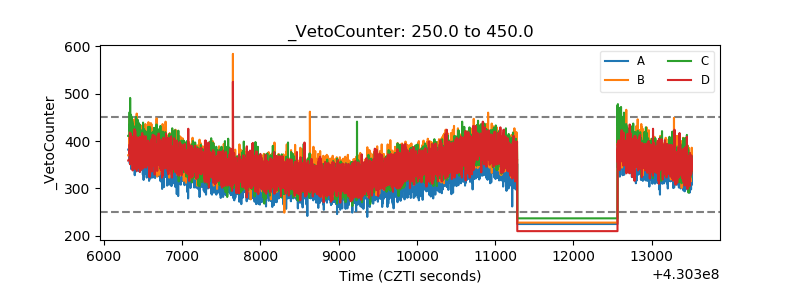 |