| Param | Original file | Final file |
|---|---|---|
| Filename | modeM0/AS1A05_013T01_9000005822_42700cztM0_level2.fits | modeM0/AS1A05_013T01_9000005822_42700cztM0_level2_quad_clean.evt |
| Size (bytes) | 871,824,960 | 251,452,800 |
| Size | 831.4 MB | 239.8 MB |
| Events in quadrant A | 8,427,612 | 1,675,316 |
| Events in quadrant B | 7,059,622 | 1,706,100 |
| Events in quadrant C | 7,396,352 | 1,638,096 |
| Events in quadrant D | 8,178,050 | 1,516,409 |
| Mode M0 | |||
|---|---|---|---|
| Quadrant | BADHDUFLAG | Total packets | Discarded packets |
| A | 0 | 34180 | 4 |
| B | 0 | 31992 | 4 |
| C | 0 | 32087 | 4 |
| D | 0 | 35338 | 4 |
| Mode M9 | |||
|---|---|---|---|
| Quadrant | BADHDUFLAG | Total packets | Discarded packets |
| A | 0 | 42 | 0 |
| B | 0 | 43 | 0 |
| C | 0 | 43 | 0 |
| D | 0 | 43 | 0 |
| Mode SS | |||
|---|---|---|---|
| Quadrant | BADHDUFLAG | Total packets | Discarded packets |
| A | 0 | 318 | 0 |
| B | 0 | 318 | 0 |
| C | 0 | 318 | 0 |
| D | 0 | 318 | 0 |
| Quadrant | Total seconds | Saturated seconds | Saturation percentage |
|---|---|---|---|
| A | 15614 | 53 | 0.339439% |
| B | 15614 | 47 | 0.301012% |
| C | 15614 | 30 | 0.192135% |
| D | 15614 | 143 | 0.915845% |
Noise dominated data is calculated using 1-second bins in cleaned event files. If a bin has >2000 counts, and if more than 50% of those come from <1% of pixels, then it is considered to be noise-dominated and hence unusable.
| Quadrant | # 1 sec bins | Bins with >0 counts | Bins with >2000 counts | High rate bins dominated by noise | Noise dominated (total time) | Noise dominated (detector-on time) | Marked lightcurve |
|---|---|---|---|---|---|---|---|
| A | 19822 | 15617 | 22 | 22 | 0.11% | 0.14% | 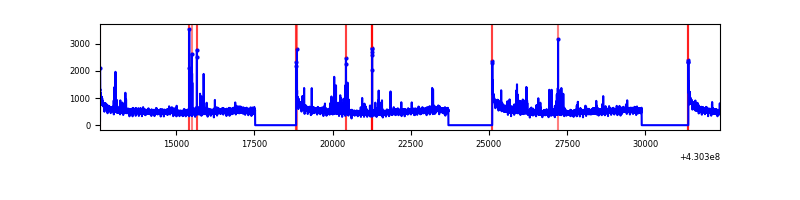 |
| B | 19822 | 15617 | 30 | 30 | 0.15% | 0.19% | 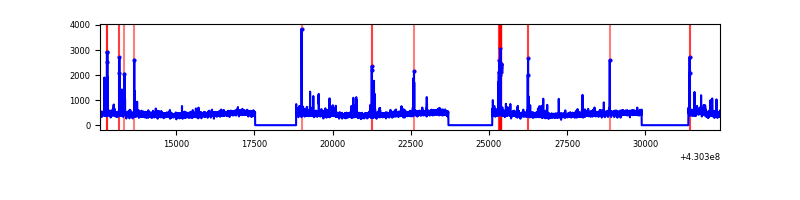 |
| C | 19822 | 15617 | 21 | 21 | 0.11% | 0.13% | 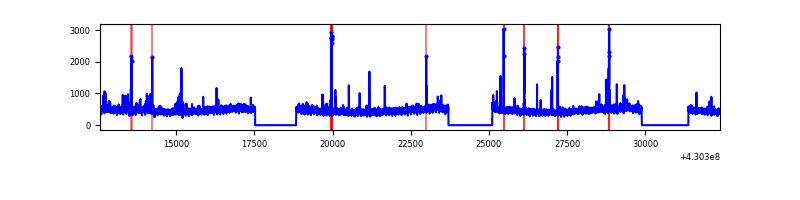 |
| D | 19822 | 15617 | 146 | 146 | 0.74% | 0.93% | 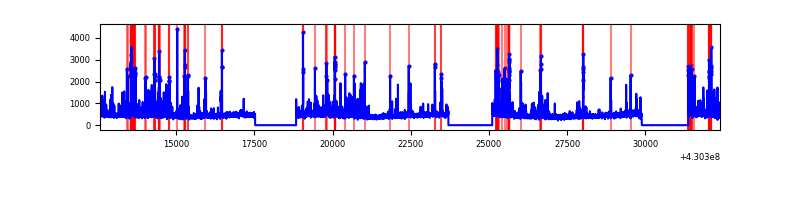 |
Top three noisy pixels from each quadrant. If the there are fewer than three noisy pixels in the level2.evt file, extra rows are filled as -1
| Pixel properties | Quadrant properties | ||||||
|---|---|---|---|---|---|---|---|
| Quadrant | DetID | PixID | Counts | Sigma | Mean | Median | Sigma |
| A | 10 | 83 | 1550394 | 4458.84 | 1700 | 1665 | 347.3 |
| A | 2 | 79 | 122031 | 346.54 | 1700 | 1665 | 347.3 |
| A | 15 | 237 | 59348 | 166.07 | 1700 | 1665 | 347.3 |
| B | 5 | 172 | 75523 | 225.78 | 1688 | 1641 | 327.2 |
| B | 0 | 229 | 70890 | 211.62 | 1688 | 1641 | 327.2 |
| B | 5 | 255 | 64221 | 191.24 | 1688 | 1641 | 327.2 |
| C | 15 | 214 | 646830 | 1674.84 | 1649 | 1656 | 385.2 |
| C | 14 | 254 | 111403 | 284.9 | 1649 | 1656 | 385.2 |
| C | 8 | 79 | 60470 | 152.68 | 1649 | 1656 | 385.2 |
| D | 1 | 52 | 649062 | 1626.34 | 1648 | 1604 | 398.1 |
| D | 12 | 233 | 329223 | 822.94 | 1648 | 1604 | 398.1 |
| D | 10 | 199 | 213593 | 532.49 | 1648 | 1604 | 398.1 |
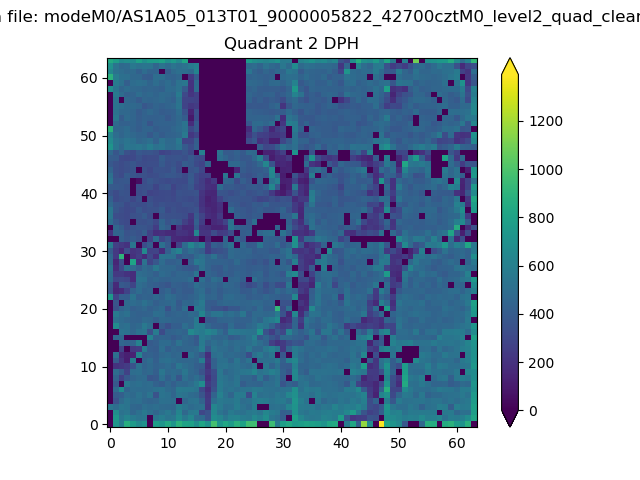
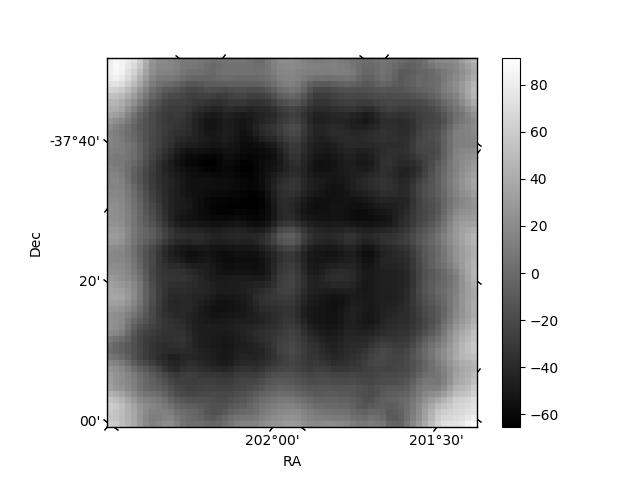
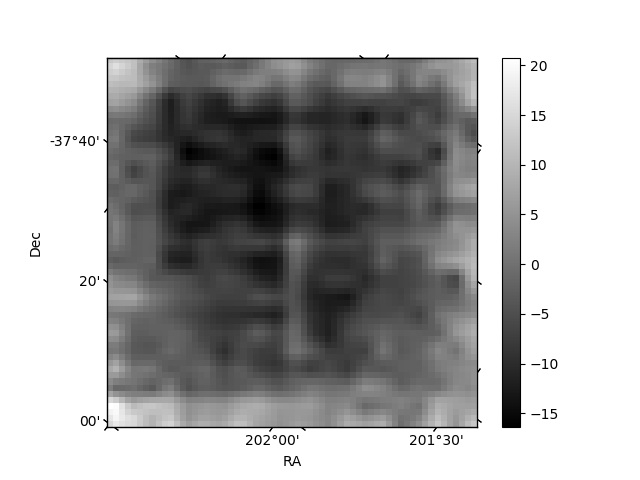
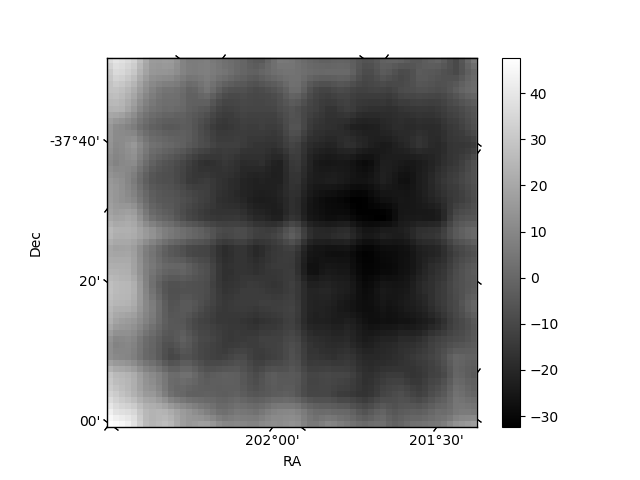
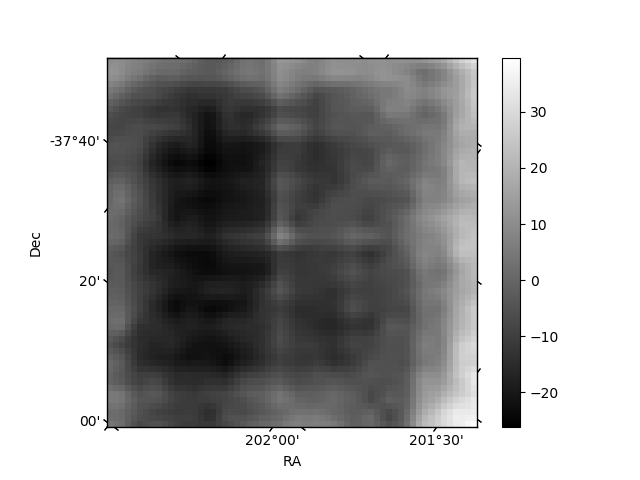
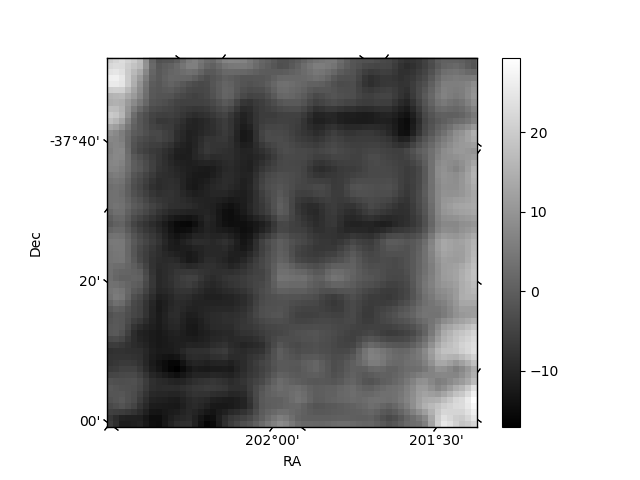
Histogram calculated using DETX and DETY for each event in the final _common_clean file
| Quadrant A | 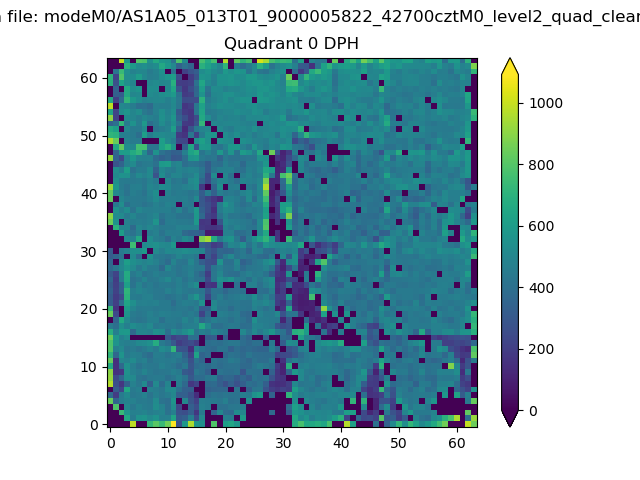 |
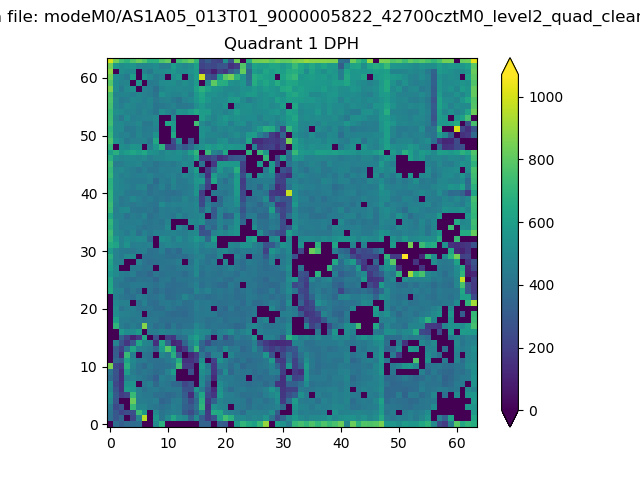 |
Quadrant B |
|---|---|---|---|
| Quadrant D | 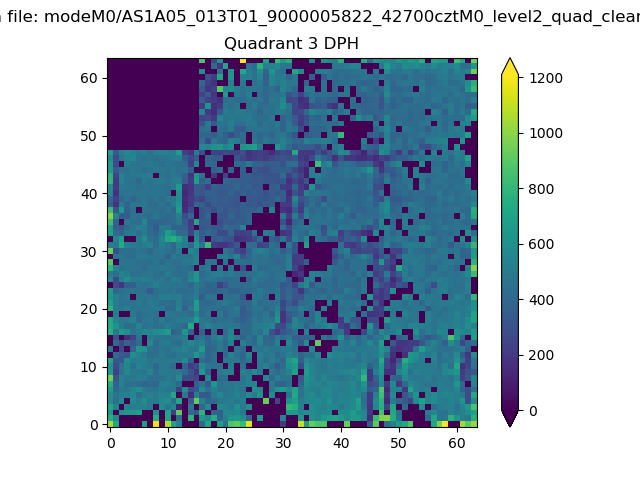 |
 |
Quadrant C |
| Plot type | Count rate plots | Images |
|---|---|---|
| Comparison with Poisson distribution Blue bars denote a histogram of data divided into 1 sec bins. Red curve is a Poisson curve with rate = median count rate of data. |
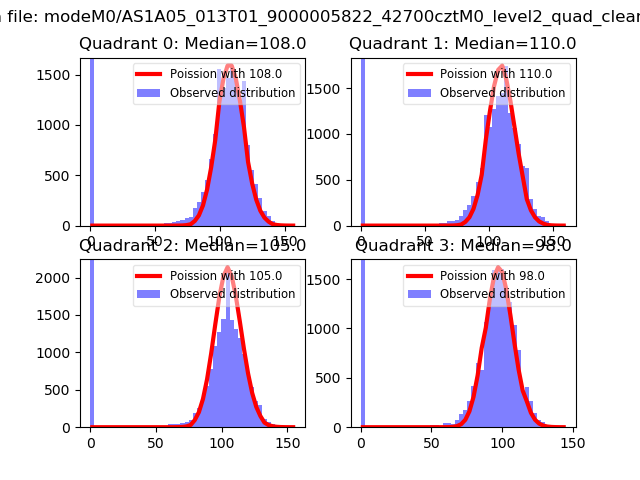 |
 |
| Quadrant-wise count rates Data is divided into 100 sec bins |
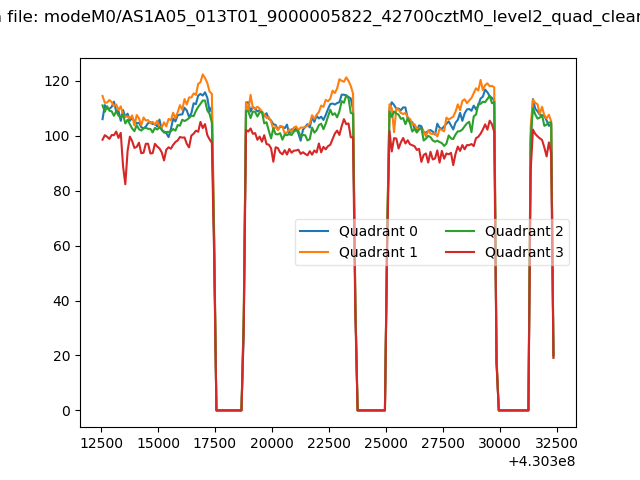 |
|
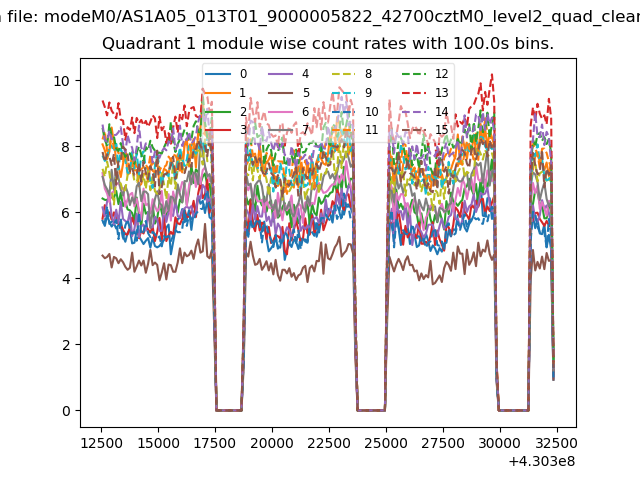
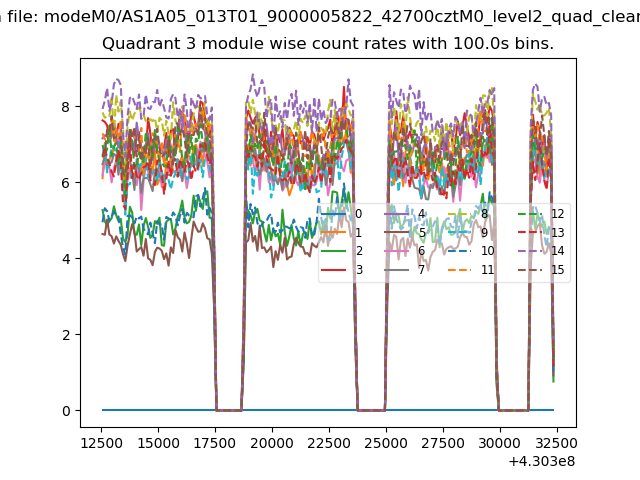
| Module-wise count rates for Quadrant A Data is divided into 100 sec bins |
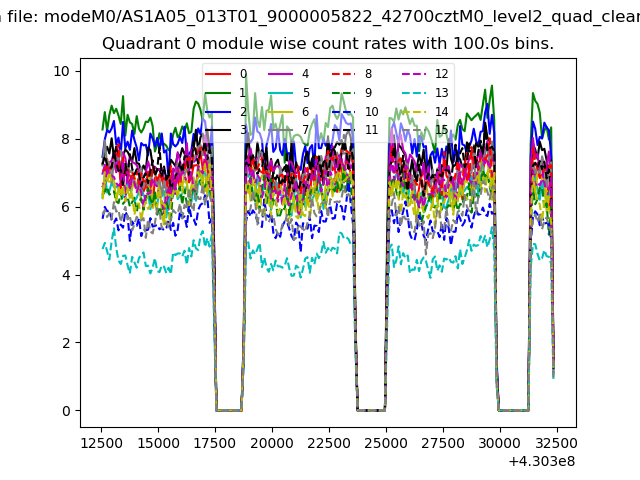 |
 |
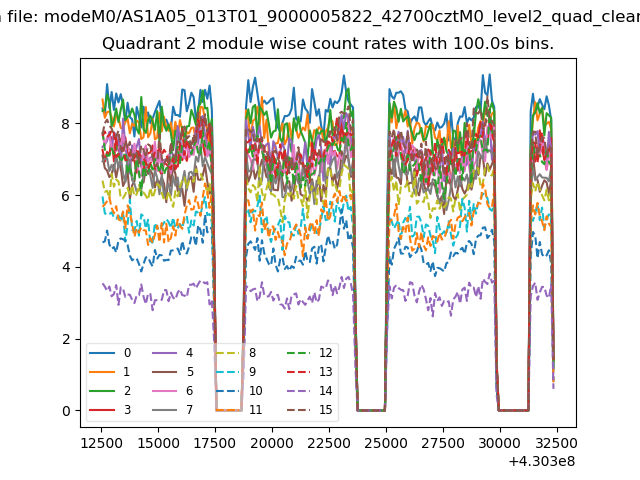
| Module-wise count rates for Quadrant B Data is divided into 100 sec bins |
 |
 |
| Module-wise count rates for Quadrant C Data is divided into 100 sec bins |
 |
 |
| Module-wise count rates for Quadrant D Data is divided into 100 sec bins |
 |
 |
| Parameter | Plot |
|---|---|
| CZT HV Monitor | 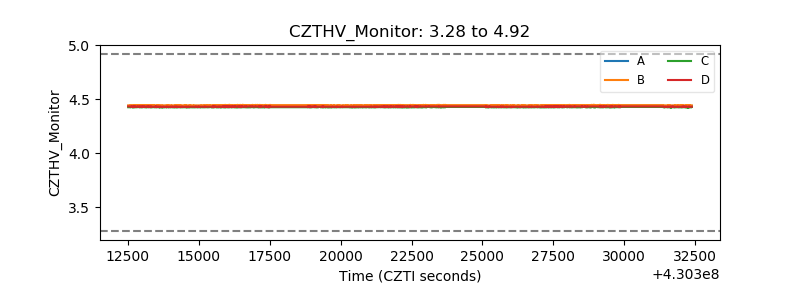 |
| D_VDD | 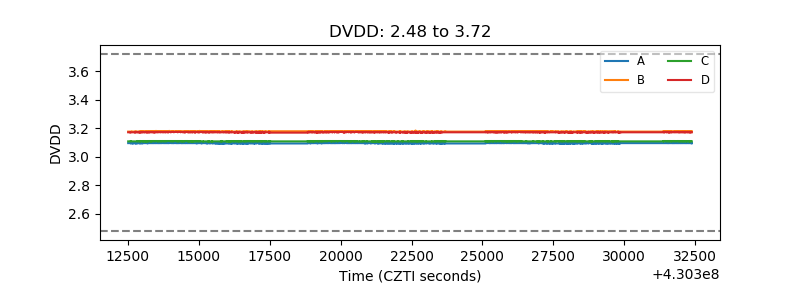 |
| Temperature 1 | 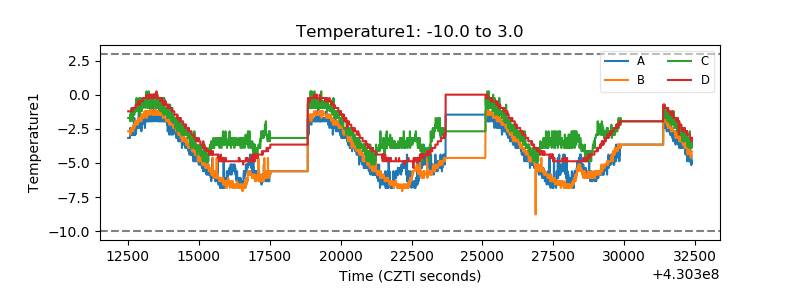 |
| Veto HV Monitor | 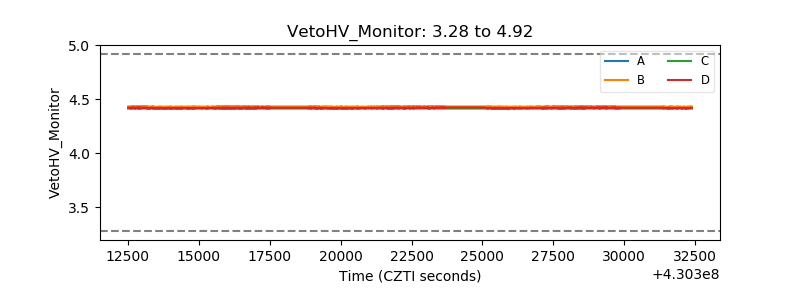 |
| Veto LLD | 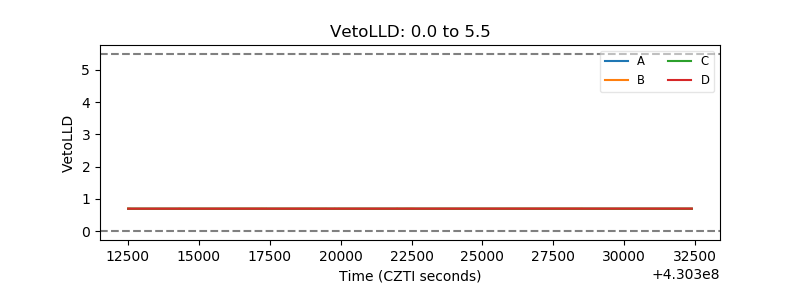 |
| Alpha Counter | 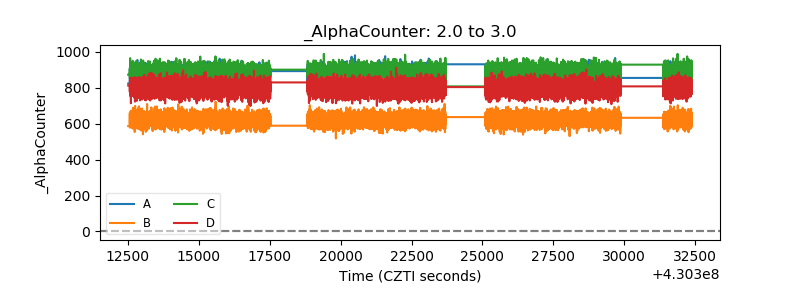 |
| _CPM_Rate | 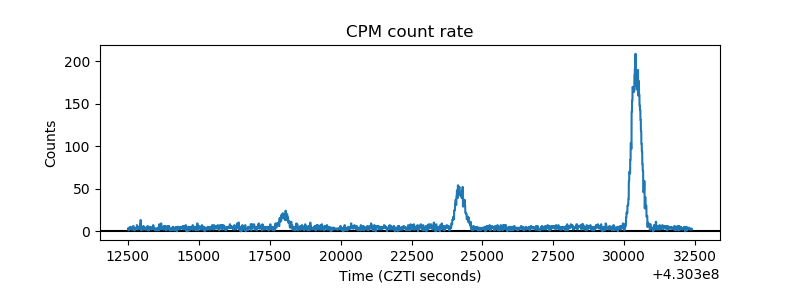 |
| CZT Counter | 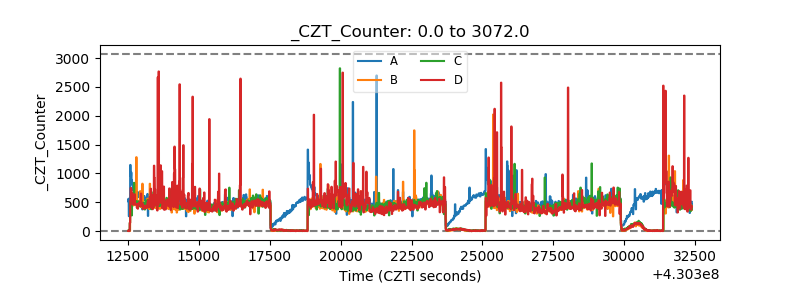 |
| +2.5 Volts monitor | 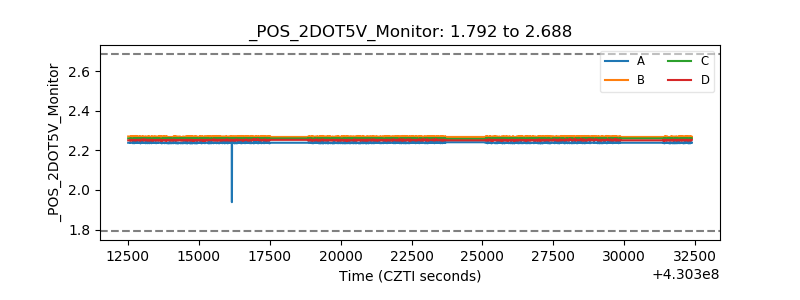 |
| +5 Volts monitor | 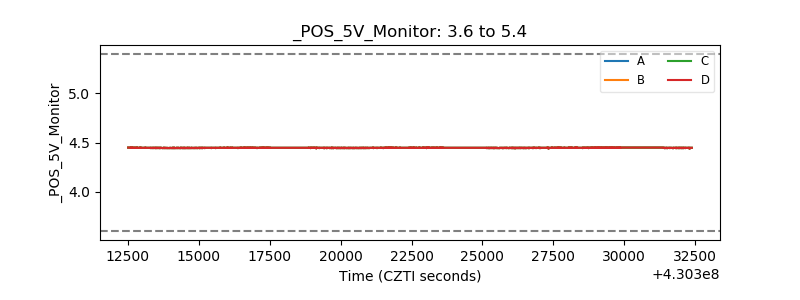 |
| _ROLL_ROT | 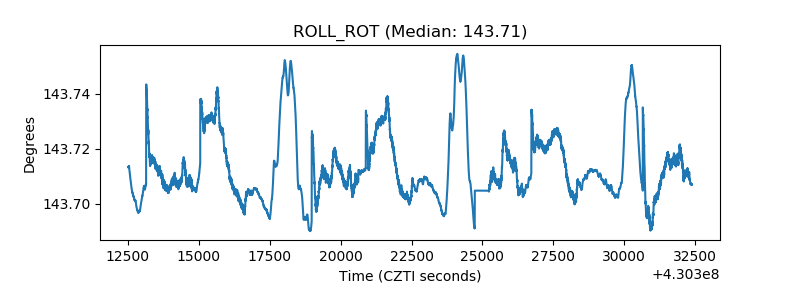 |
| _Roll_DEC | 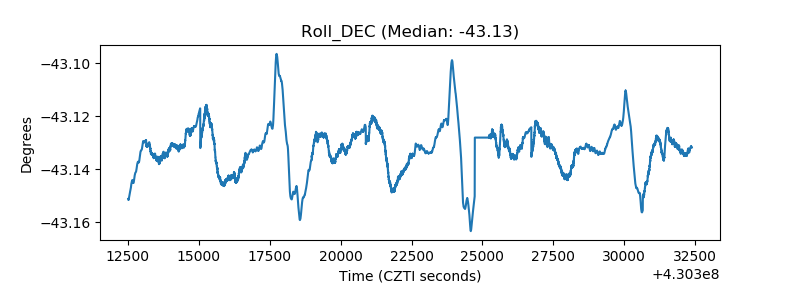 |
| _Roll_RA | 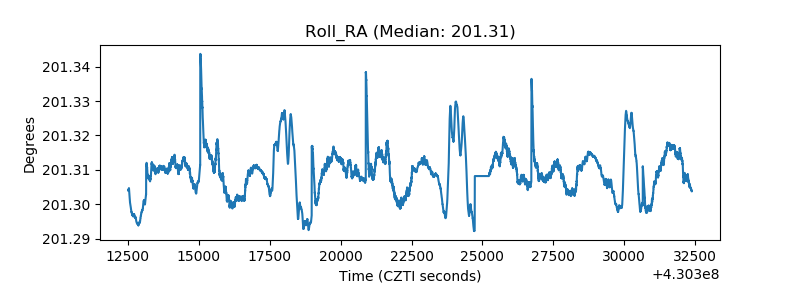 |
| Veto Counter | 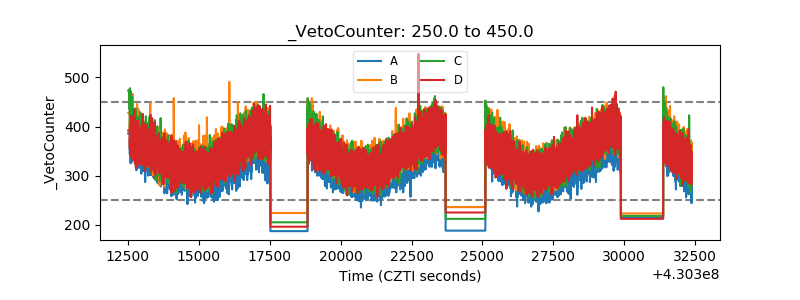 |