| Param | Original file | Final file |
|---|---|---|
| Filename | modeM0/AS1A05_013T01_9000005822_42701cztM0_level2.fits | modeM0/AS1A05_013T01_9000005822_42701cztM0_level2_quad_clean.evt |
| Size (bytes) | 309,902,400 | 89,533,440 |
| Size | 295.5 MB | 85.4 MB |
| Events in quadrant A | 2,947,984 | 599,270 |
| Events in quadrant B | 2,451,148 | 611,183 |
| Events in quadrant C | 2,557,130 | 582,026 |
| Events in quadrant D | 3,084,459 | 531,980 |
| Mode M0 | |||
|---|---|---|---|
| Quadrant | BADHDUFLAG | Total packets | Discarded packets |
| A | 0 | 12029 | 2 |
| B | 0 | 11243 | 3 |
| C | 0 | 11184 | 2 |
| D | 0 | 13217 | 2 |
| Mode M9 | |||
|---|---|---|---|
| Quadrant | BADHDUFLAG | Total packets | Discarded packets |
| A | 0 | 18 | 0 |
| B | 0 | 19 | 0 |
| C | 0 | 19 | 0 |
| D | 0 | 19 | 0 |
| Mode SS | |||
|---|---|---|---|
| Quadrant | BADHDUFLAG | Total packets | Discarded packets |
| A | 0 | 112 | 0 |
| B | 0 | 112 | 0 |
| C | 0 | 112 | 0 |
| D | 0 | 112 | 0 |
| Quadrant | Total seconds | Saturated seconds | Saturation percentage |
|---|---|---|---|
| A | 5524 | 16 | 0.289645% |
| B | 5523 | 10 | 0.181061% |
| C | 5523 | 3 | 0.054318% |
| D | 5523 | 142 | 2.571066% |
Noise dominated data is calculated using 1-second bins in cleaned event files. If a bin has >2000 counts, and if more than 50% of those come from <1% of pixels, then it is considered to be noise-dominated and hence unusable.
| Quadrant | # 1 sec bins | Bins with >0 counts | Bins with >2000 counts | High rate bins dominated by noise | Noise dominated (total time) | Noise dominated (detector-on time) | Marked lightcurve |
|---|---|---|---|---|---|---|---|
| A | 7165 | 5525 | 6 | 6 | 0.08% | 0.11% | 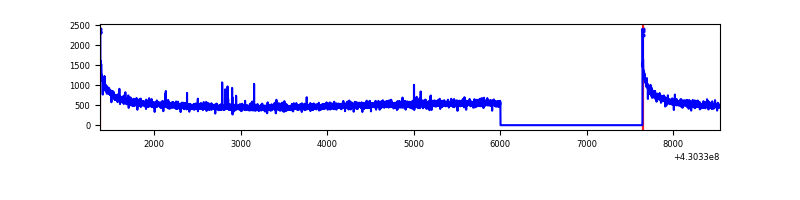 |
| B | 7164 | 5524 | 3 | 3 | 0.04% | 0.05% | 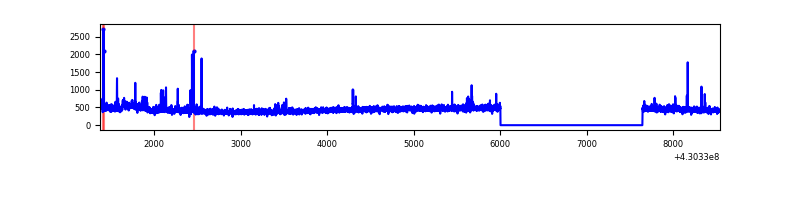 |
| C | 7164 | 5524 | 1 | 1 | 0.01% | 0.02% | 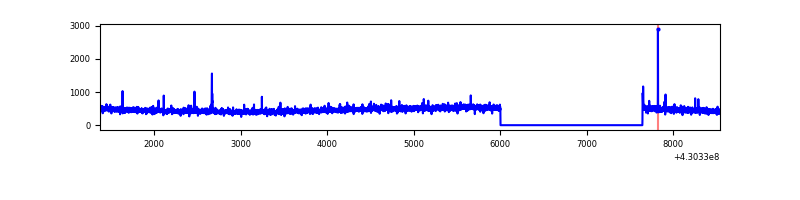 |
| D | 7164 | 5524 | 145 | 145 | 2.02% | 2.62% | 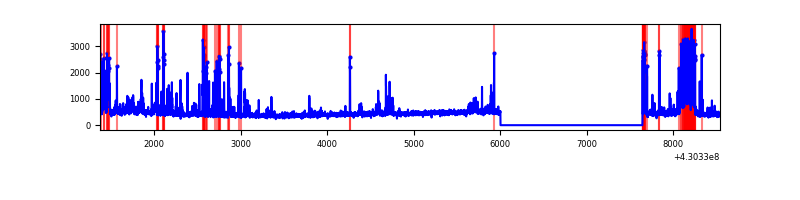 |
Top three noisy pixels from each quadrant. If the there are fewer than three noisy pixels in the level2.evt file, extra rows are filled as -1
| Pixel properties | Quadrant properties | ||||||
|---|---|---|---|---|---|---|---|
| Quadrant | DetID | PixID | Counts | Sigma | Mean | Median | Sigma |
| A | 10 | 83 | 600473 | 4877.72 | 598 | 585 | 123.0 |
| A | 13 | 6 | 11668 | 90.12 | 598 | 585 | 123.0 |
| A | 13 | 254 | 10073 | 77.15 | 598 | 585 | 123.0 |
| B | 5 | 255 | 35557 | 298.37 | 594 | 577 | 117.2 |
| B | 3 | 112 | 31811 | 266.42 | 594 | 577 | 117.2 |
| B | 0 | 230 | 15479 | 127.11 | 594 | 577 | 117.2 |
| C | 15 | 214 | 231597 | 1700.9 | 579 | 582 | 135.8 |
| C | 10 | 22 | 18631 | 132.89 | 579 | 582 | 135.8 |
| C | 3 | 233 | 17784 | 126.65 | 579 | 582 | 135.8 |
| D | 2 | 249 | 412412 | 2917.32 | 573 | 557 | 141.2 |
| D | 12 | 233 | 132940 | 937.72 | 573 | 557 | 141.2 |
| D | 1 | 52 | 120570 | 850.1 | 573 | 557 | 141.2 |
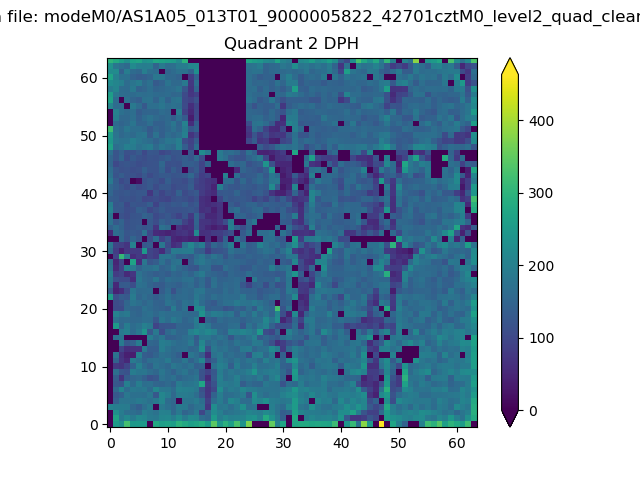
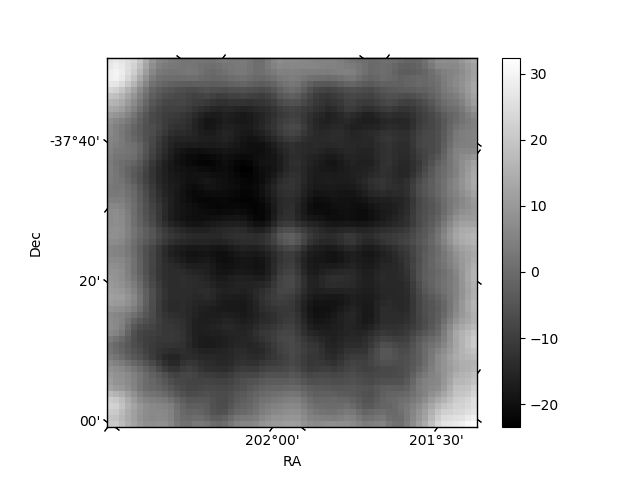
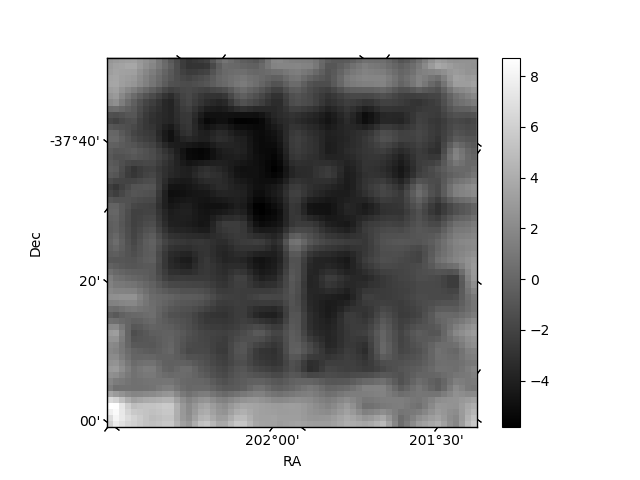
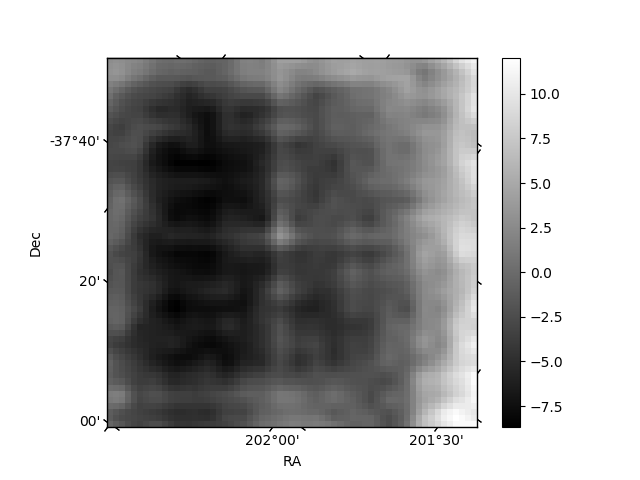
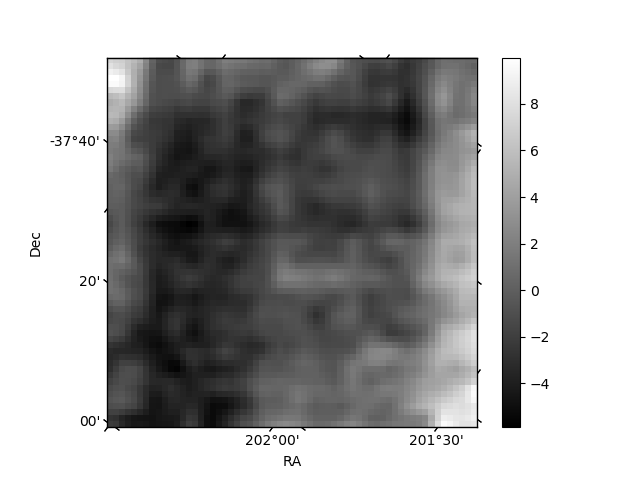
Histogram calculated using DETX and DETY for each event in the final _common_clean file
| Quadrant A | 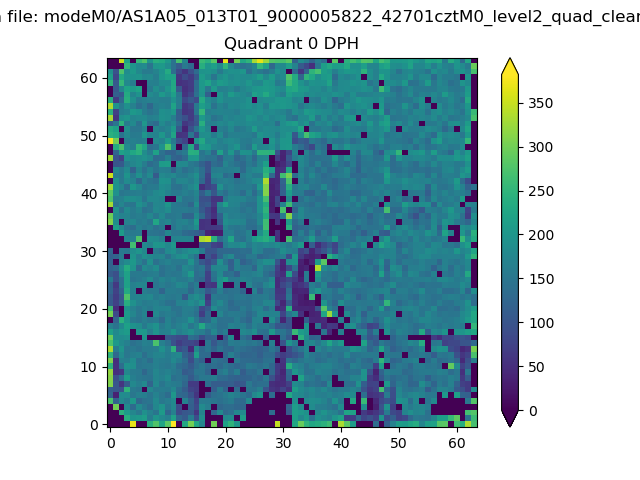 |
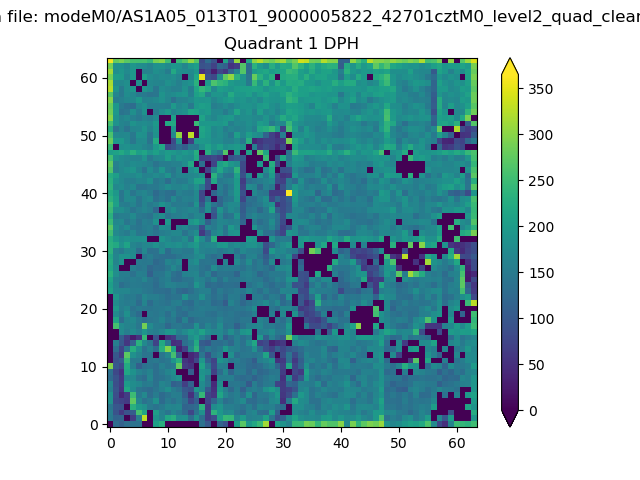 |
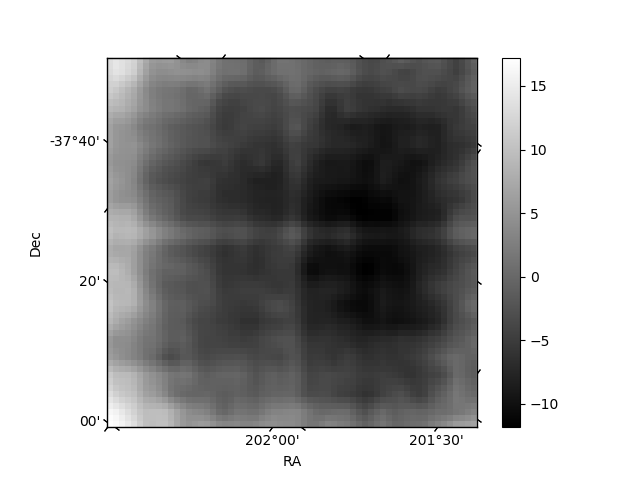
Quadrant B |
|---|---|---|---|
| Quadrant D | 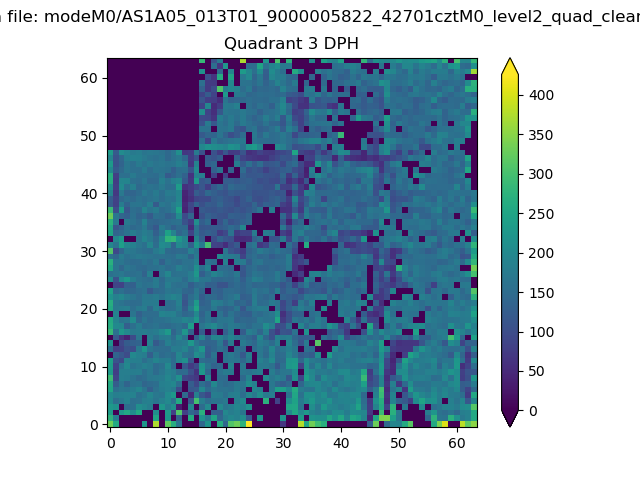 |
 |
Quadrant C |
| Plot type | Count rate plots | Images |
|---|---|---|
| Comparison with Poisson distribution Blue bars denote a histogram of data divided into 1 sec bins. Red curve is a Poisson curve with rate = median count rate of data. |
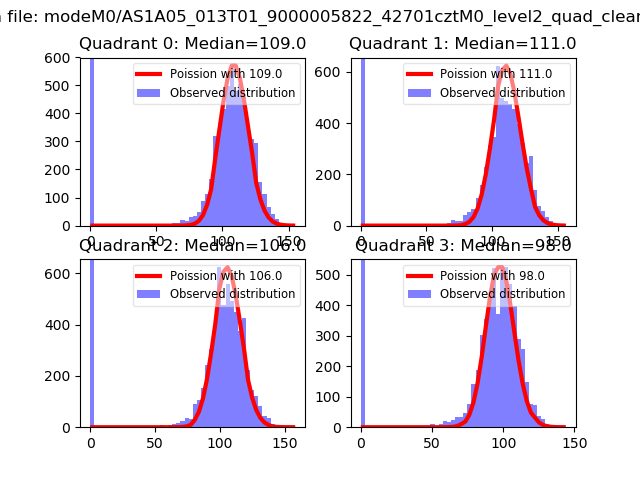 |
 |
| Quadrant-wise count rates Data is divided into 100 sec bins |
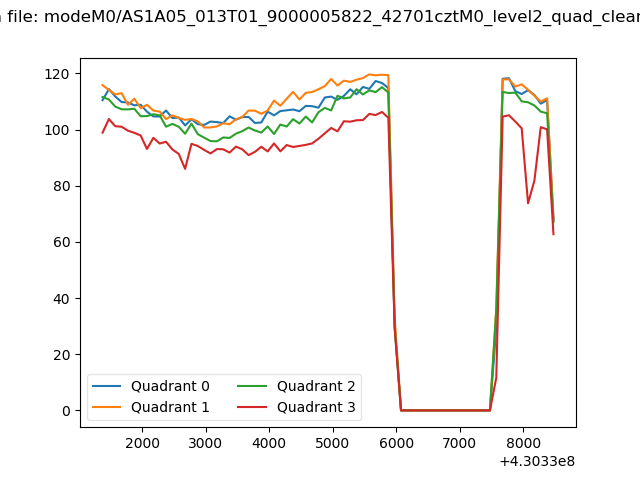 |
|
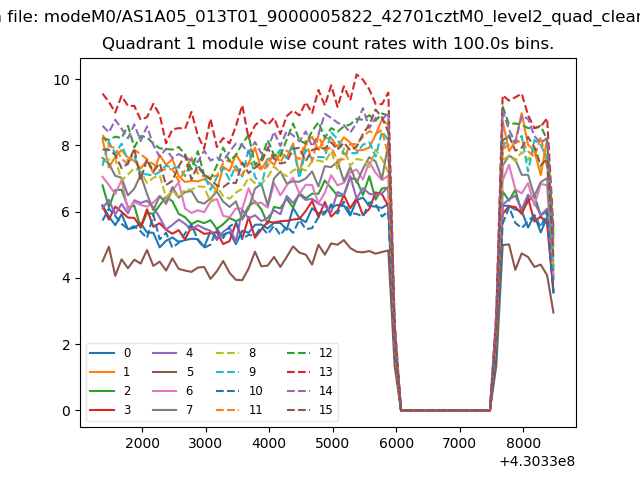
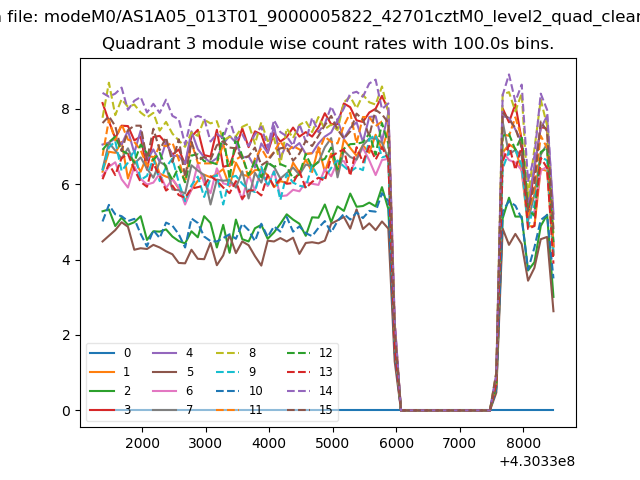
| Module-wise count rates for Quadrant A Data is divided into 100 sec bins |
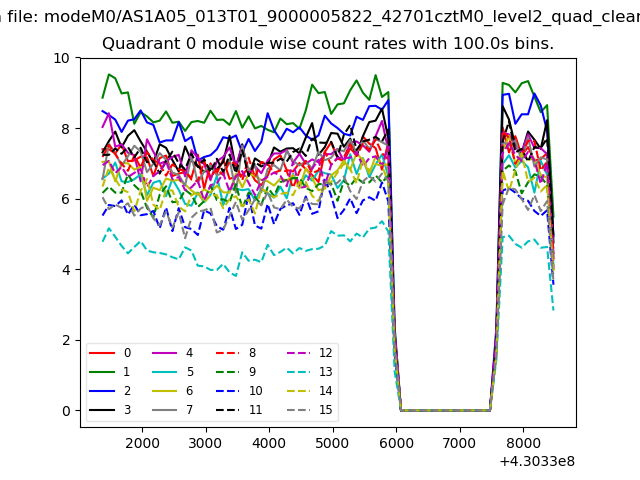 |
 |
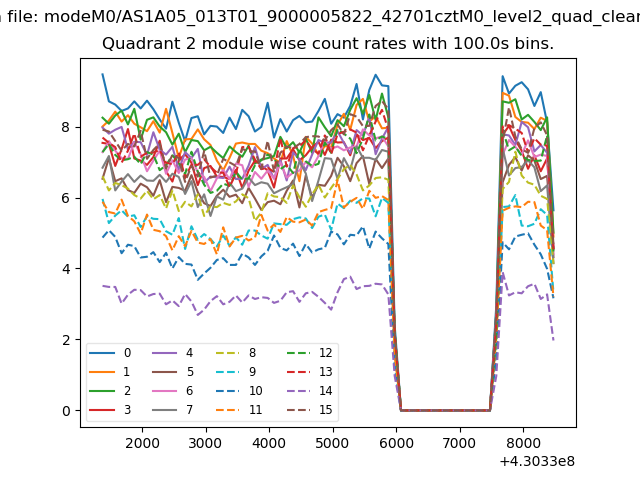
| Module-wise count rates for Quadrant B Data is divided into 100 sec bins |
 |
 |
| Module-wise count rates for Quadrant C Data is divided into 100 sec bins |
 |
 |
| Module-wise count rates for Quadrant D Data is divided into 100 sec bins |
 |
 |
| Parameter | Plot |
|---|---|
| CZT HV Monitor |  |
| D_VDD | 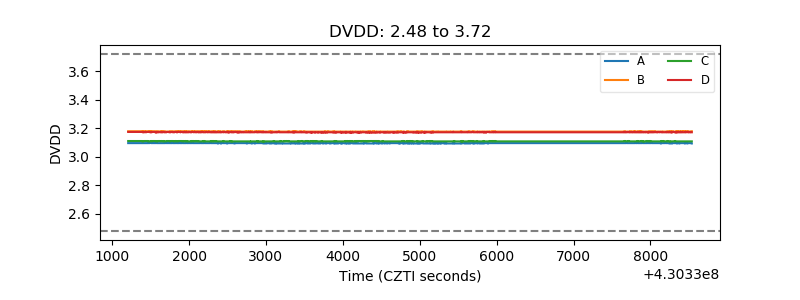 |
| Temperature 1 | 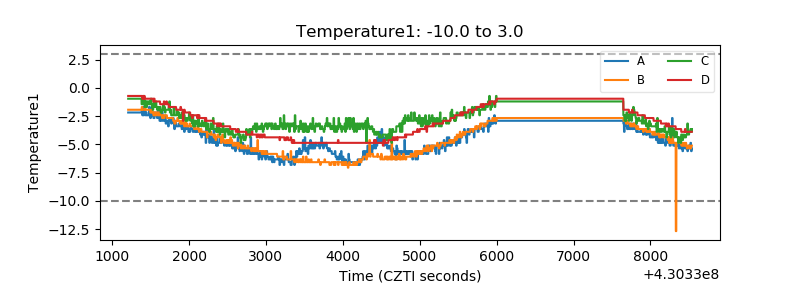 |
| Veto HV Monitor | 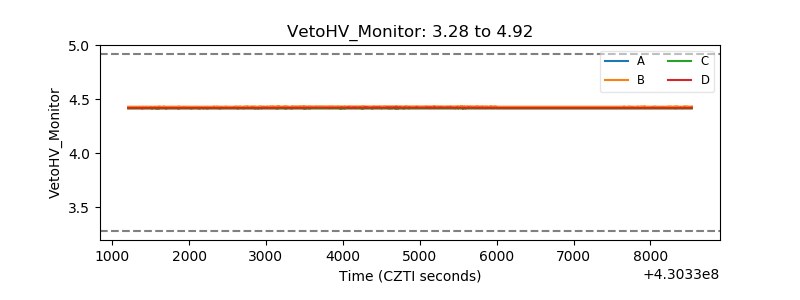 |
| Veto LLD | 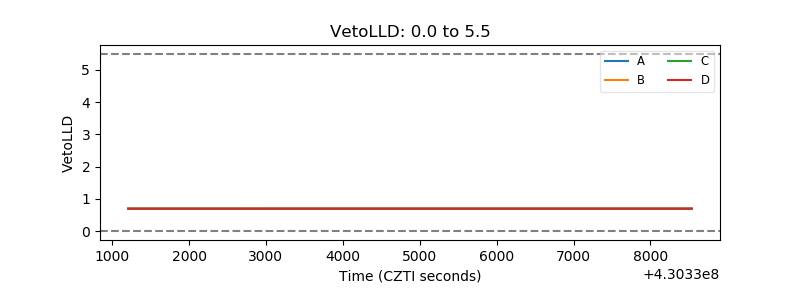 |
| Alpha Counter | 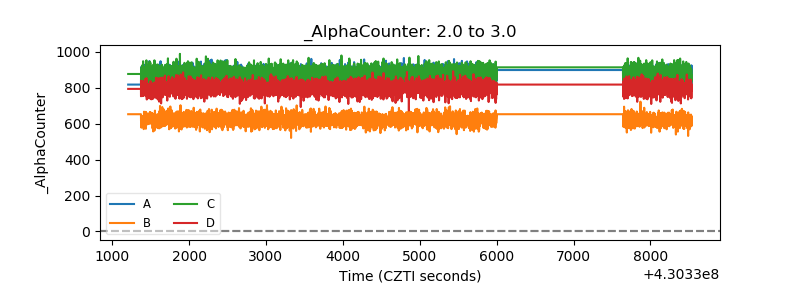 |
| _CPM_Rate | 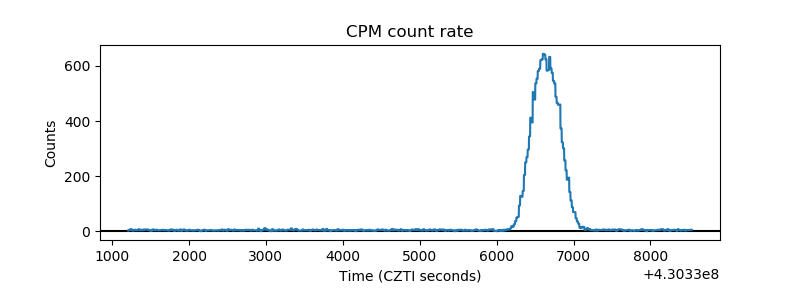 |
| CZT Counter |  |
| +2.5 Volts monitor | 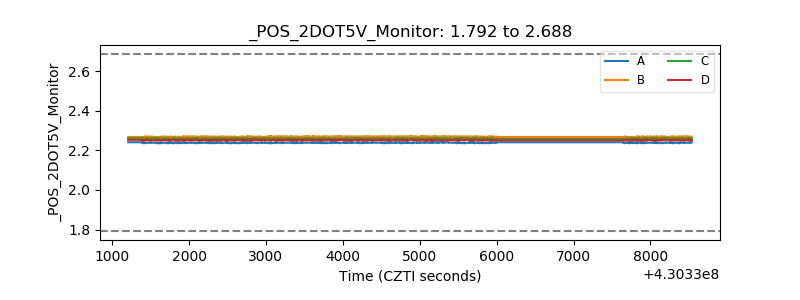 |
| +5 Volts monitor | 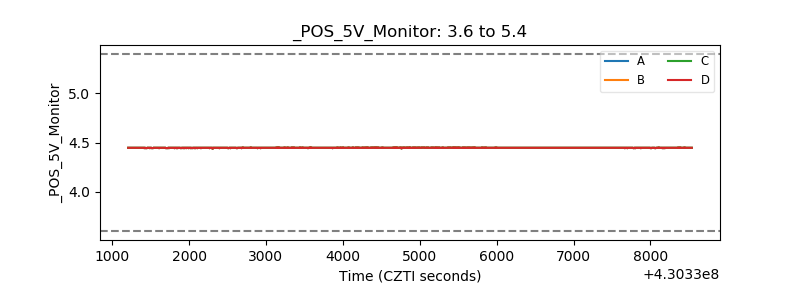 |
| _ROLL_ROT | 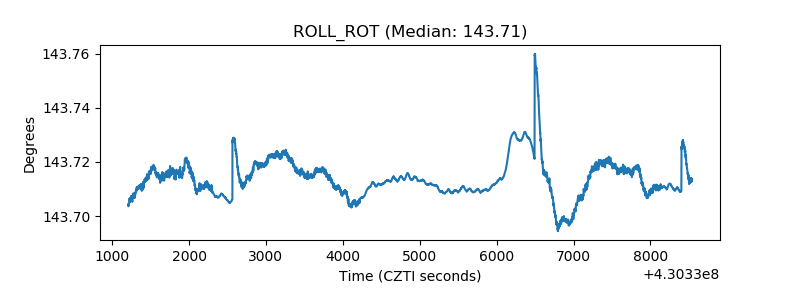 |
| _Roll_DEC | 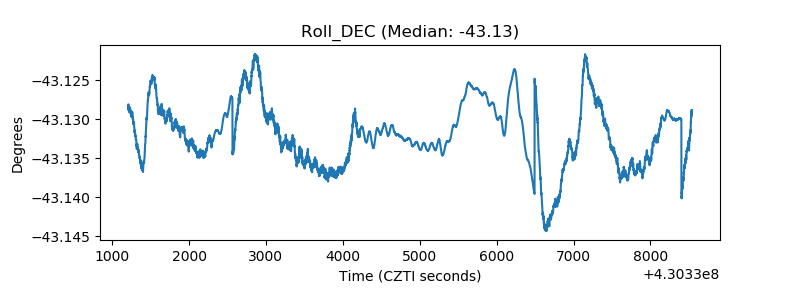 |
| _Roll_RA | 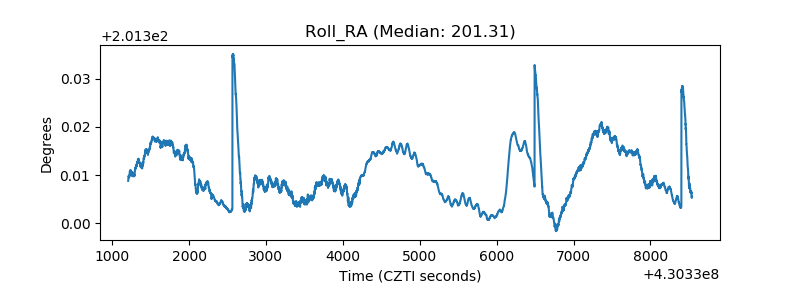 |
| Veto Counter | 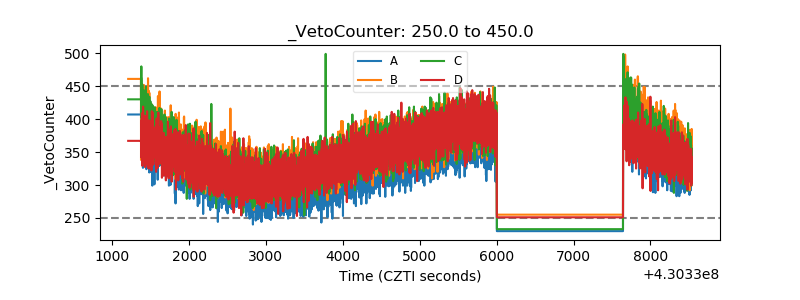 |