| Param | Original file | Final file |
|---|---|---|
| Filename | modeM0/AS1A05_013T01_9000005822_42703cztM0_level2.fits | modeM0/AS1A05_013T01_9000005822_42703cztM0_level2_quad_clean.evt |
| Size (bytes) | 303,621,120 | 89,377,920 |
| Size | 289.6 MB | 85.2 MB |
| Events in quadrant A | 3,007,774 | 601,381 |
| Events in quadrant B | 2,403,619 | 614,682 |
| Events in quadrant C | 2,609,115 | 579,257 |
| Events in quadrant D | 2,797,974 | 533,372 |
| Mode M0 | |||
|---|---|---|---|
| Quadrant | BADHDUFLAG | Total packets | Discarded packets |
| A | 0 | 12219 | 2 |
| B | 0 | 10973 | 2 |
| C | 0 | 11246 | 2 |
| D | 0 | 12272 | 8 |
| Mode M9 | |||
|---|---|---|---|
| Quadrant | BADHDUFLAG | Total packets | Discarded packets |
| A | 0 | 28 | 0 |
| B | 0 | 29 | 0 |
| C | 0 | 29 | 0 |
| D | 0 | 29 | 0 |
| Mode SS | |||
|---|---|---|---|
| Quadrant | BADHDUFLAG | Total packets | Discarded packets |
| A | 0 | 110 | 0 |
| B | 0 | 110 | 0 |
| C | 0 | 110 | 0 |
| D | 0 | 110 | 0 |
| Quadrant | Total seconds | Saturated seconds | Saturation percentage |
|---|---|---|---|
| A | 5394 | 32 | 0.593252% |
| B | 5394 | 15 | 0.278087% |
| C | 5394 | 29 | 0.537634% |
| D | 5393 | 112 | 2.076766% |
Noise dominated data is calculated using 1-second bins in cleaned event files. If a bin has >2000 counts, and if more than 50% of those come from <1% of pixels, then it is considered to be noise-dominated and hence unusable.
| Quadrant | # 1 sec bins | Bins with >0 counts | Bins with >2000 counts | High rate bins dominated by noise | Noise dominated (total time) | Noise dominated (detector-on time) | Marked lightcurve |
|---|---|---|---|---|---|---|---|
| A | 7156 | 5395 | 18 | 18 | 0.25% | 0.33% | 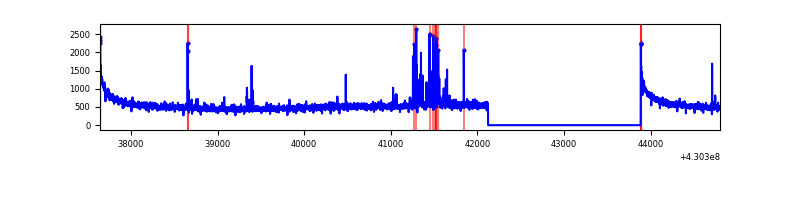 |
| B | 7156 | 5395 | 8 | 8 | 0.11% | 0.15% | 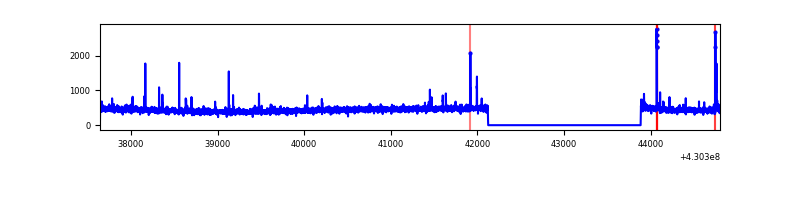 |
| C | 7156 | 5395 | 25 | 25 | 0.35% | 0.46% | 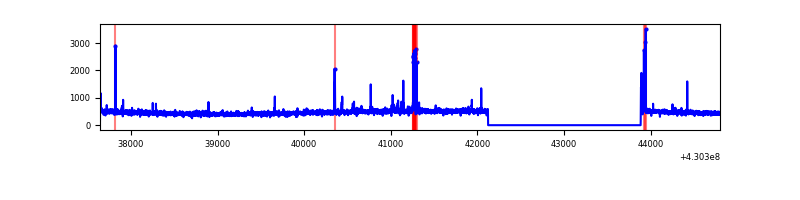 |
| D | 7155 | 5394 | 111 | 111 | 1.55% | 2.06% | 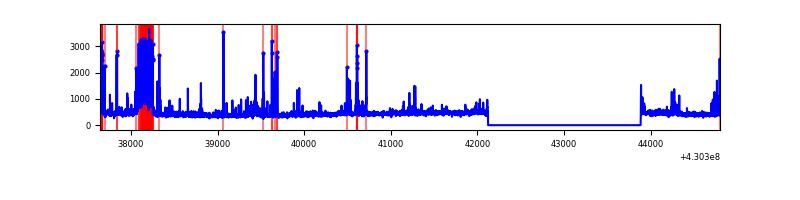 |
Top three noisy pixels from each quadrant. If the there are fewer than three noisy pixels in the level2.evt file, extra rows are filled as -1
| Pixel properties | Quadrant properties | ||||||
|---|---|---|---|---|---|---|---|
| Quadrant | DetID | PixID | Counts | Sigma | Mean | Median | Sigma |
| A | 10 | 83 | 569414 | 4686.5 | 590 | 579 | 121.4 |
| A | 13 | 248 | 128398 | 1053.07 | 590 | 579 | 121.4 |
| A | 2 | 79 | 11777 | 92.26 | 590 | 579 | 121.4 |
| B | 5 | 255 | 51255 | 440.45 | 590 | 573 | 115.1 |
| B | 5 | 172 | 15401 | 128.86 | 590 | 573 | 115.1 |
| B | 12 | 111 | 14688 | 122.66 | 590 | 573 | 115.1 |
| C | 15 | 214 | 223681 | 1670.43 | 571 | 573 | 133.6 |
| C | 14 | 254 | 90842 | 675.85 | 571 | 573 | 133.6 |
| C | 3 | 233 | 39865 | 294.18 | 571 | 573 | 133.6 |
| D | 2 | 249 | 365395 | 2648.1 | 565 | 550 | 137.8 |
| D | 12 | 233 | 75163 | 541.55 | 565 | 550 | 137.8 |
| D | 5 | 171 | 41961 | 300.57 | 565 | 550 | 137.8 |
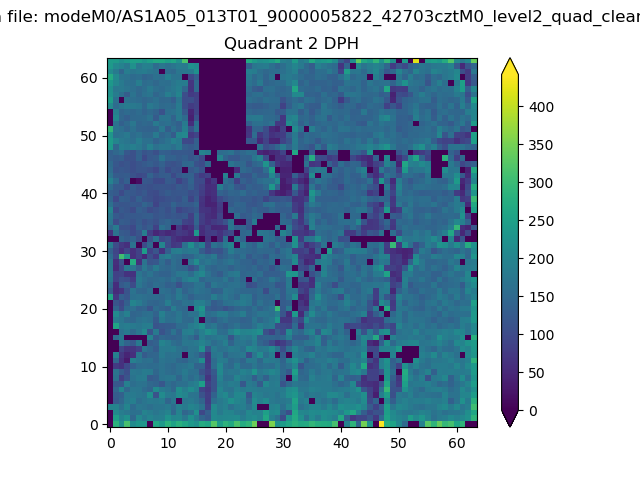
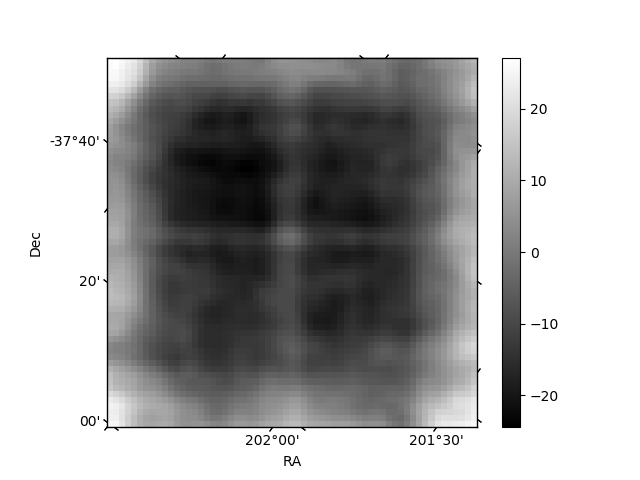
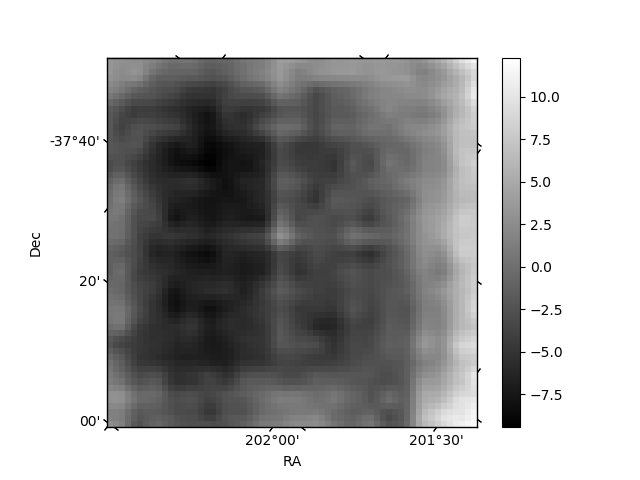
Histogram calculated using DETX and DETY for each event in the final _common_clean file
| Quadrant A | 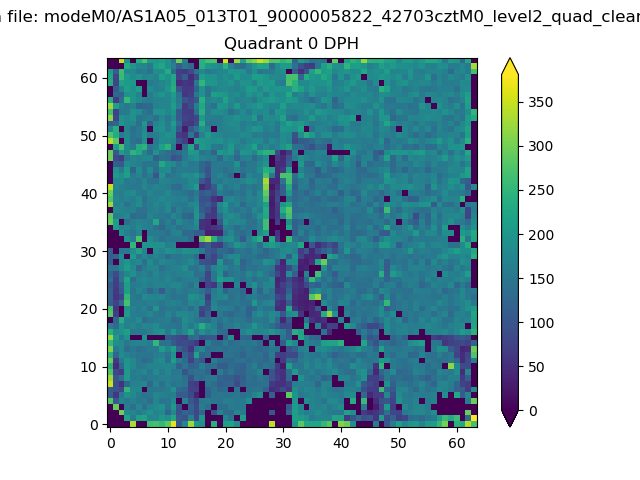 |
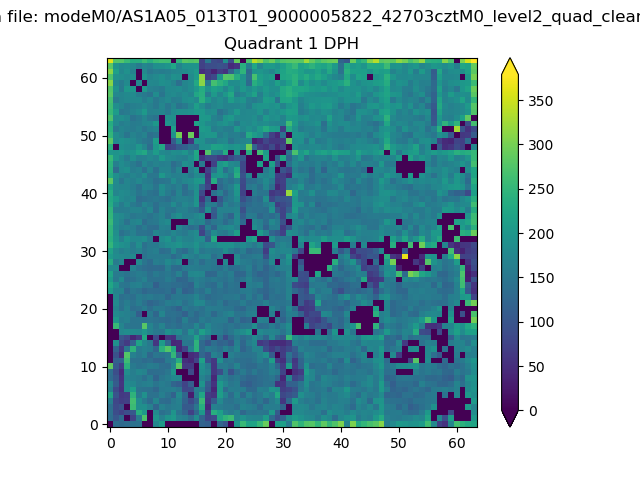 |
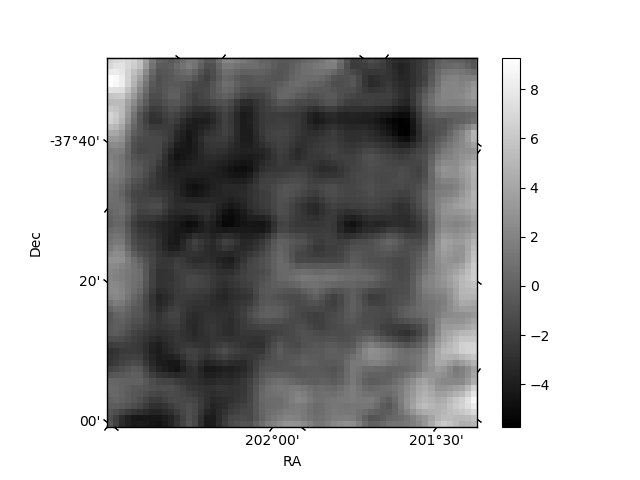
Quadrant B |
|---|---|---|---|
| Quadrant D | 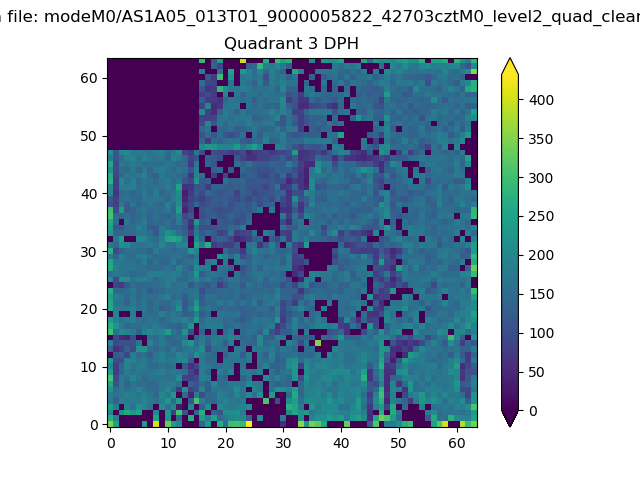 |
 |
Quadrant C |
| Plot type | Count rate plots | Images |
|---|---|---|
| Comparison with Poisson distribution Blue bars denote a histogram of data divided into 1 sec bins. Red curve is a Poisson curve with rate = median count rate of data. |
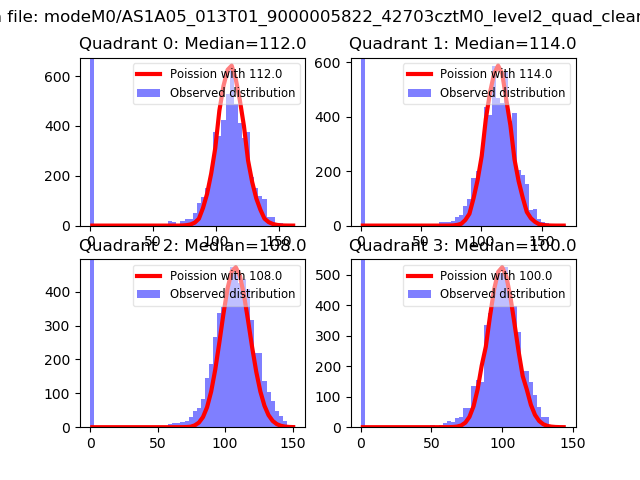 |
 |
| Quadrant-wise count rates Data is divided into 100 sec bins |
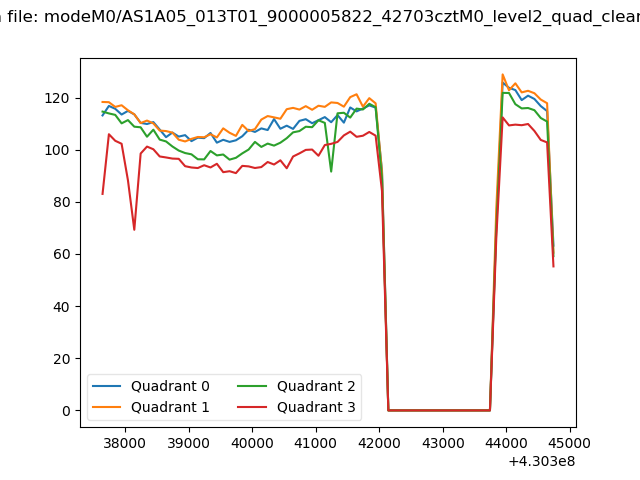 |
|
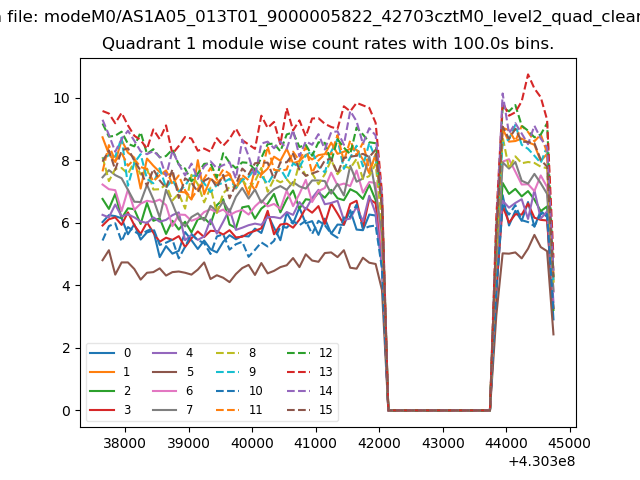
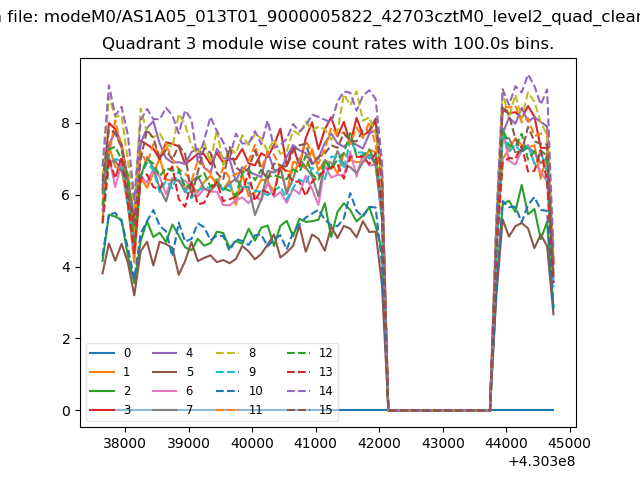
| Module-wise count rates for Quadrant A Data is divided into 100 sec bins |
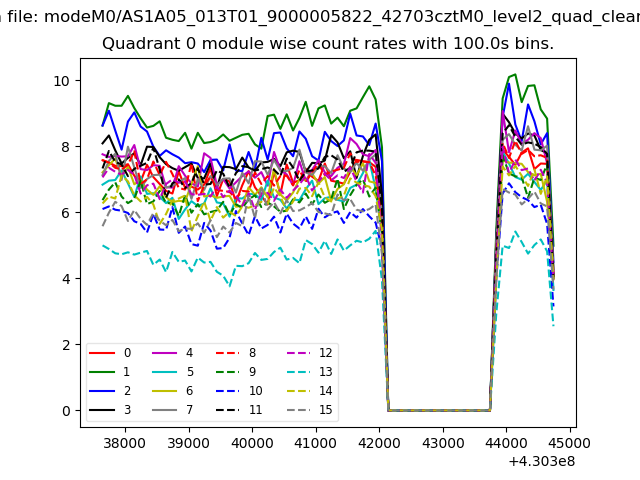 |
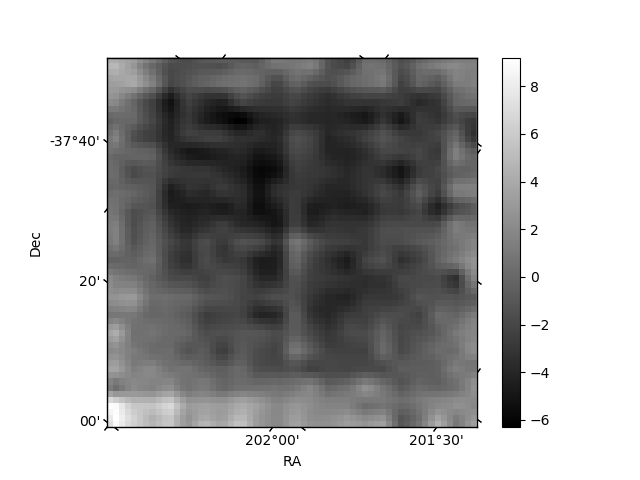 |
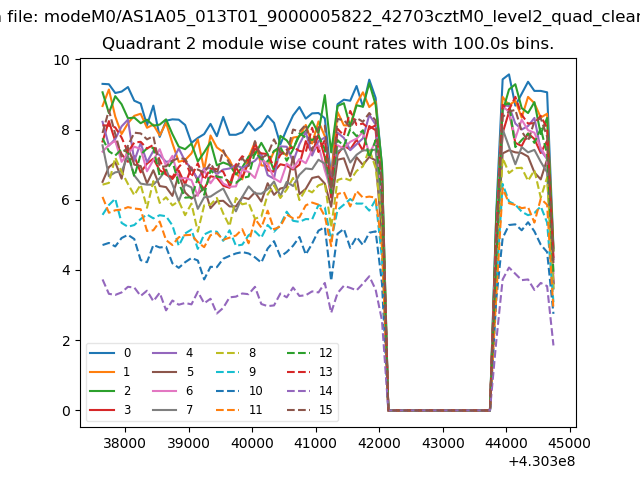
| Module-wise count rates for Quadrant B Data is divided into 100 sec bins |
 |
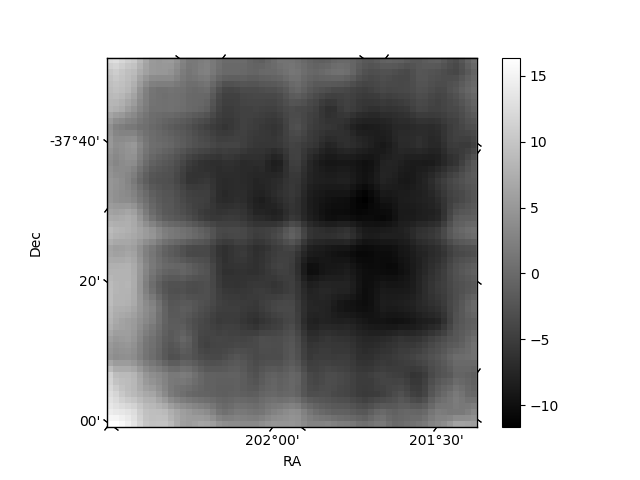 |
| Module-wise count rates for Quadrant C Data is divided into 100 sec bins |
 |
 |
| Module-wise count rates for Quadrant D Data is divided into 100 sec bins |
 |
 |
| Parameter | Plot |
|---|---|
| CZT HV Monitor | 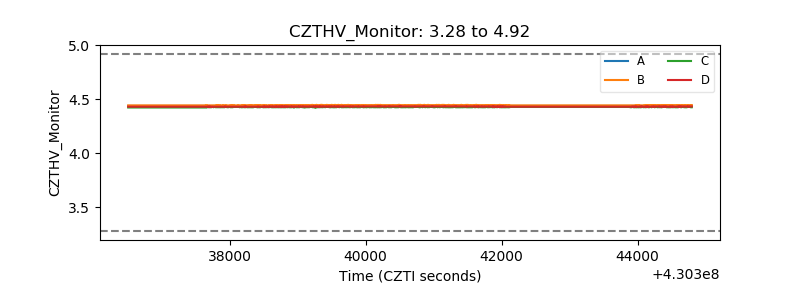 |
| D_VDD | 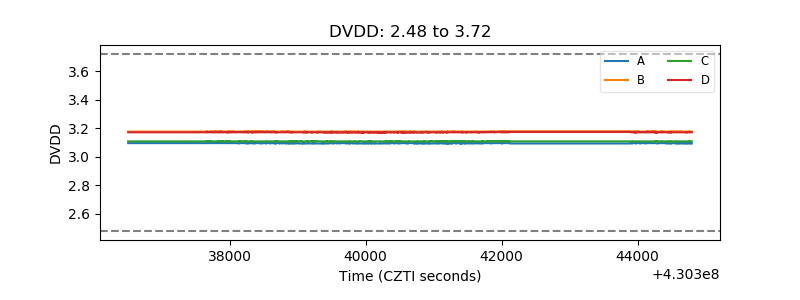 |
| Temperature 1 | 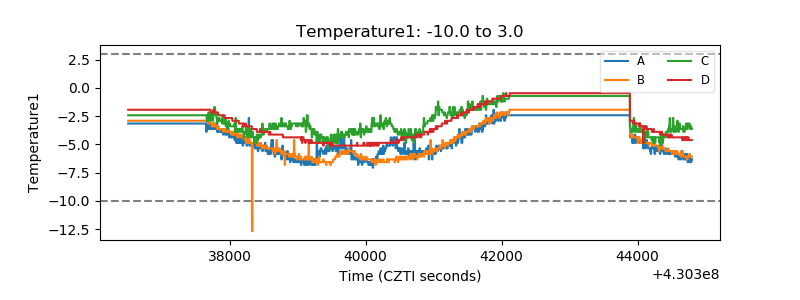 |
| Veto HV Monitor | 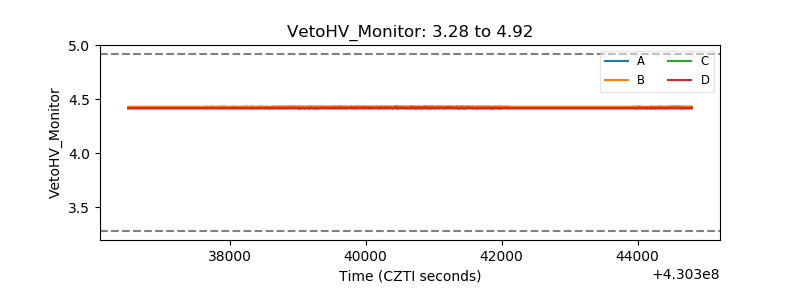 |
| Veto LLD | 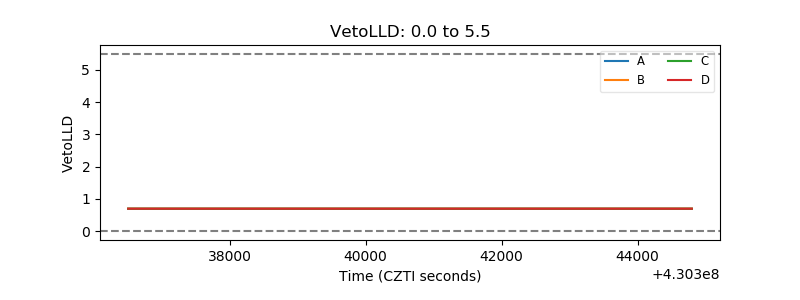 |
| Alpha Counter | 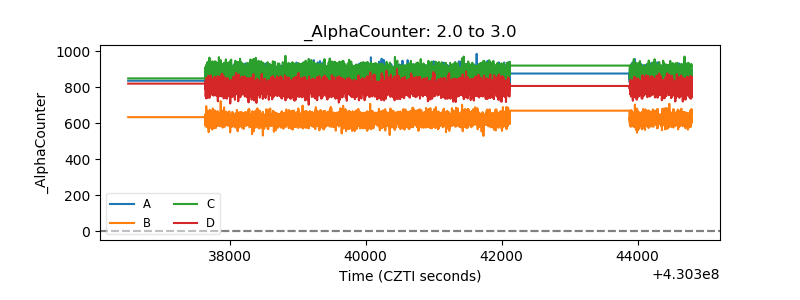 |
| _CPM_Rate |  |
| CZT Counter | 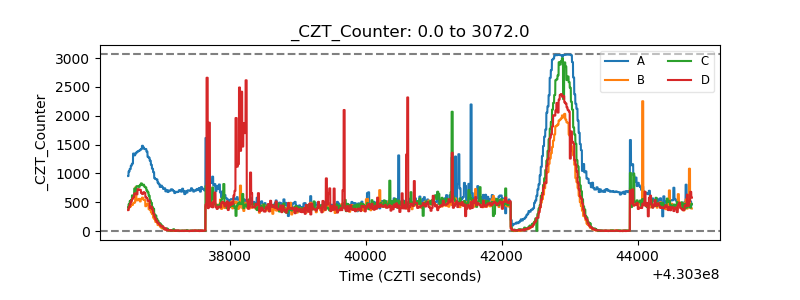 |
| +2.5 Volts monitor | 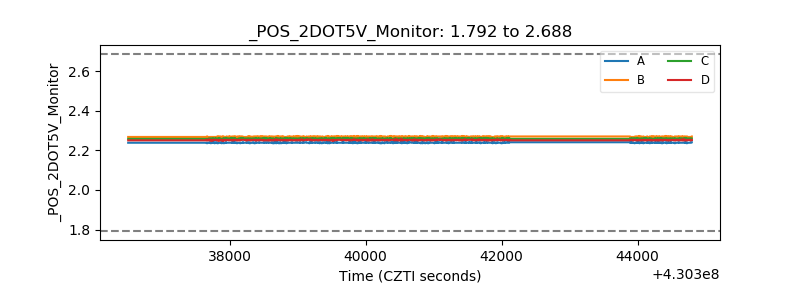 |
| +5 Volts monitor | 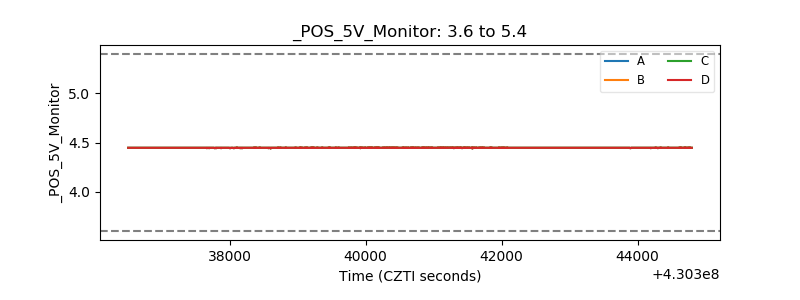 |
| _ROLL_ROT | 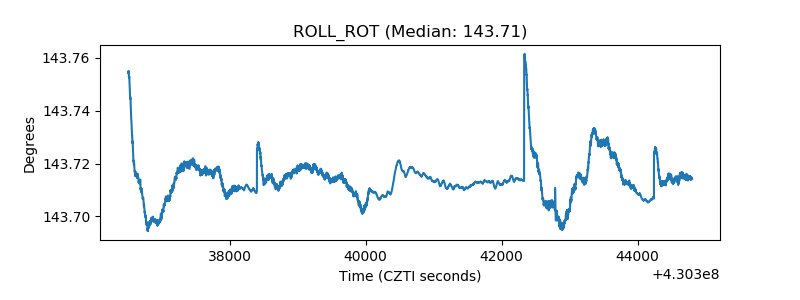 |
| _Roll_DEC | 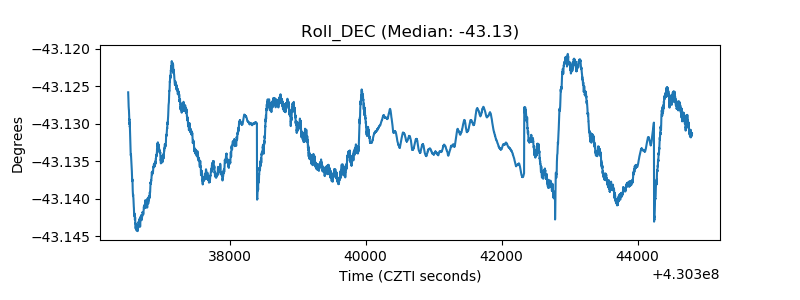 |
| _Roll_RA | 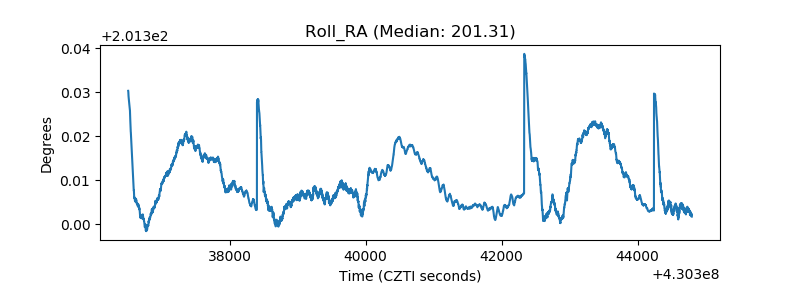 |
| Veto Counter | 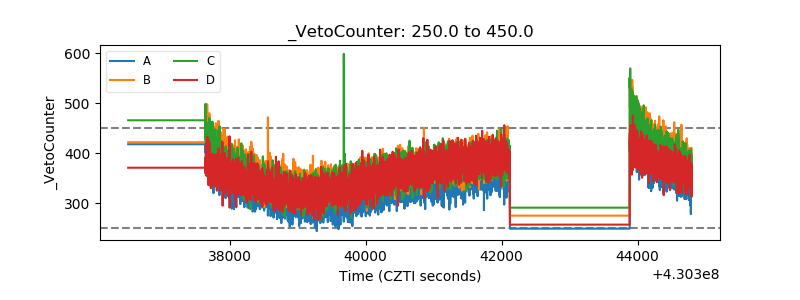 |