| Param | Original file | Final file |
|---|---|---|
| Filename | modeM0/AS1A05_013T01_9000005822_42705cztM0_level2.fits | modeM0/AS1A05_013T01_9000005822_42705cztM0_level2_quad_clean.evt |
| Size (bytes) | 289,540,800 | 90,132,480 |
| Size | 276.1 MB | 86.0 MB |
| Events in quadrant A | 2,942,607 | 616,177 |
| Events in quadrant B | 2,342,184 | 633,579 |
| Events in quadrant C | 2,470,990 | 589,864 |
| Events in quadrant D | 2,572,389 | 539,398 |
| Mode M0 | |||
|---|---|---|---|
| Quadrant | BADHDUFLAG | Total packets | Discarded packets |
| A | 0 | 11740 | 2 |
| B | 0 | 10151 | 2 |
| C | 0 | 10168 | 2 |
| D | 0 | 11092 | 3 |
| Mode M9 | |||
|---|---|---|---|
| Quadrant | BADHDUFLAG | Total packets | Discarded packets |
| A | 0 | 28 | 0 |
| B | 0 | 29 | 0 |
| C | 0 | 29 | 0 |
| D | 0 | 29 | 0 |
| Mode SS | |||
|---|---|---|---|
| Quadrant | BADHDUFLAG | Total packets | Discarded packets |
| A | 0 | 102 | 0 |
| B | 0 | 102 | 0 |
| C | 0 | 102 | 0 |
| D | 0 | 102 | 0 |
| Quadrant | Total seconds | Saturated seconds | Saturation percentage |
|---|---|---|---|
| A | 4997 | 18 | 0.360216% |
| B | 4997 | 10 | 0.200120% |
| C | 4997 | 5 | 0.100060% |
| D | 4996 | 57 | 1.140913% |
Noise dominated data is calculated using 1-second bins in cleaned event files. If a bin has >2000 counts, and if more than 50% of those come from <1% of pixels, then it is considered to be noise-dominated and hence unusable.
| Quadrant | # 1 sec bins | Bins with >0 counts | Bins with >2000 counts | High rate bins dominated by noise | Noise dominated (total time) | Noise dominated (detector-on time) | Marked lightcurve |
|---|---|---|---|---|---|---|---|
| A | 7000 | 4998 | 7 | 7 | 0.10% | 0.14% | 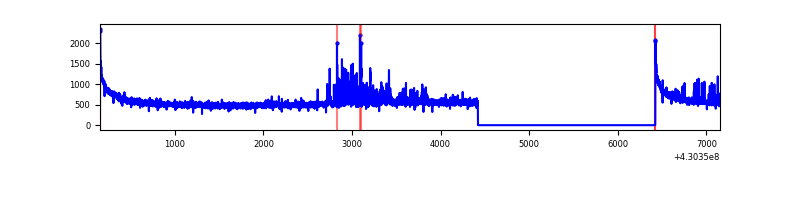 |
| B | 7000 | 4998 | 5 | 5 | 0.07% | 0.10% | 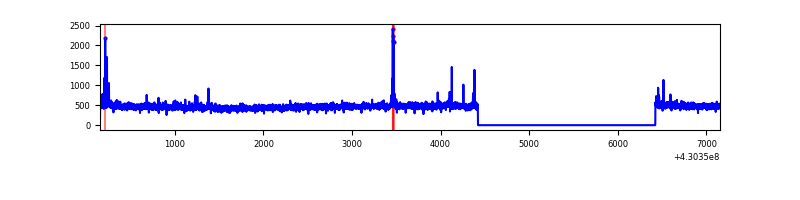 |
| C | 7000 | 4998 | 0 | 0 | 0.00% | 0.00% | 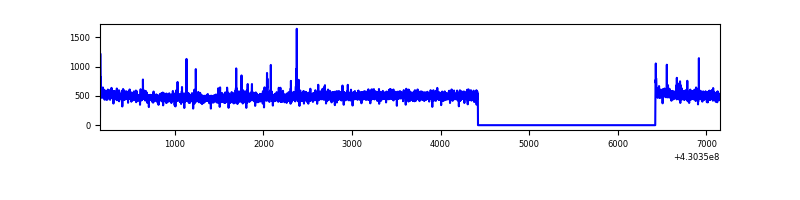 |
| D | 6999 | 4997 | 48 | 48 | 0.69% | 0.96% | 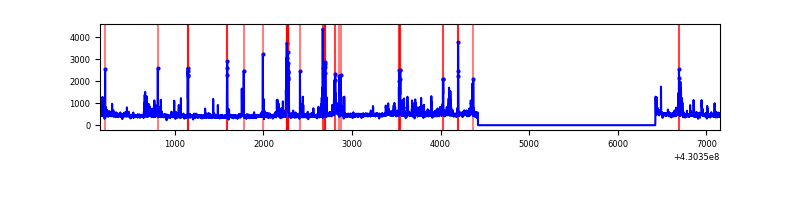 |
Top three noisy pixels from each quadrant. If the there are fewer than three noisy pixels in the level2.evt file, extra rows are filled as -1
| Pixel properties | Quadrant properties | ||||||
|---|---|---|---|---|---|---|---|
| Quadrant | DetID | PixID | Counts | Sigma | Mean | Median | Sigma |
| A | 10 | 83 | 517556 | 4354.38 | 583 | 572 | 118.7 |
| A | 9 | 143 | 154534 | 1296.77 | 583 | 572 | 118.7 |
| A | 13 | 248 | 12069 | 96.84 | 583 | 572 | 118.7 |
| B | 5 | 172 | 31535 | 276.32 | 581 | 565 | 112.1 |
| B | 12 | 111 | 13800 | 118.09 | 581 | 565 | 112.1 |
| B | 11 | 111 | 12723 | 108.48 | 581 | 565 | 112.1 |
| C | 15 | 214 | 210355 | 1608.17 | 567 | 571 | 130.4 |
| C | 3 | 233 | 18637 | 138.49 | 567 | 571 | 130.4 |
| C | 15 | 111 | 13890 | 102.1 | 567 | 571 | 130.4 |
| D | 12 | 6 | 108025 | 791.51 | 560 | 547 | 135.8 |
| D | 13 | 249 | 88635 | 648.71 | 560 | 547 | 135.8 |
| D | 2 | 249 | 85353 | 624.54 | 560 | 547 | 135.8 |
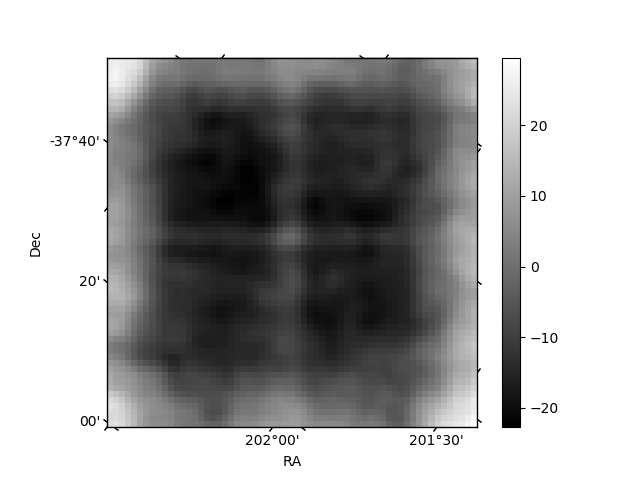
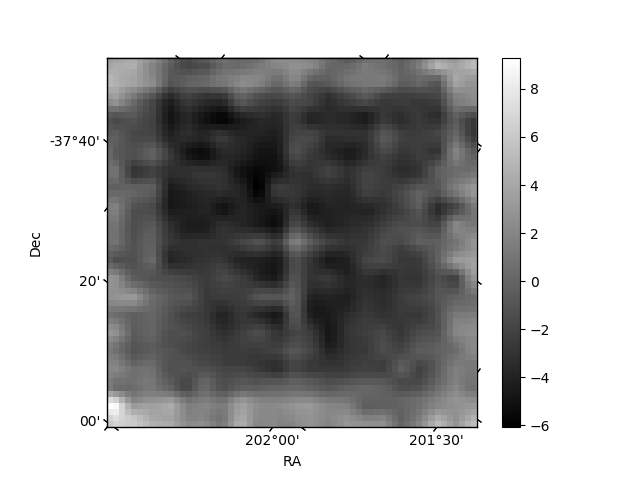
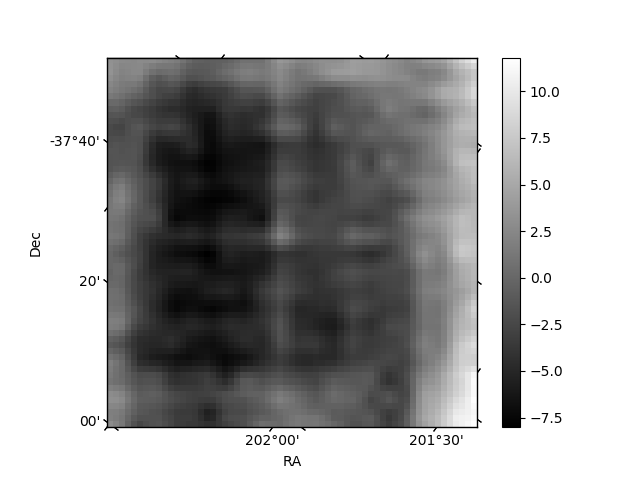
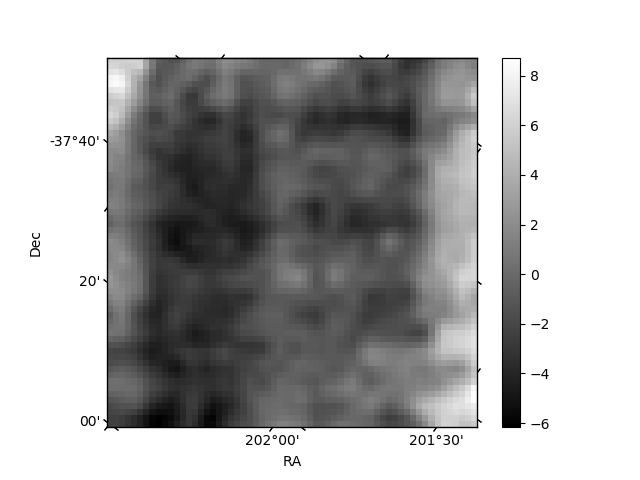
Histogram calculated using DETX and DETY for each event in the final _common_clean file
| Quadrant A | 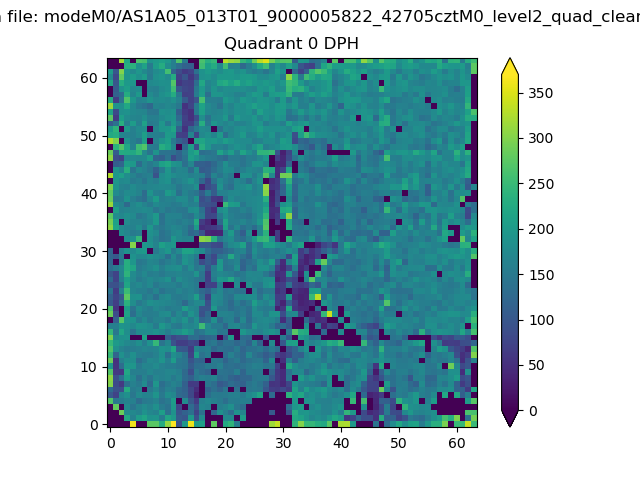 |
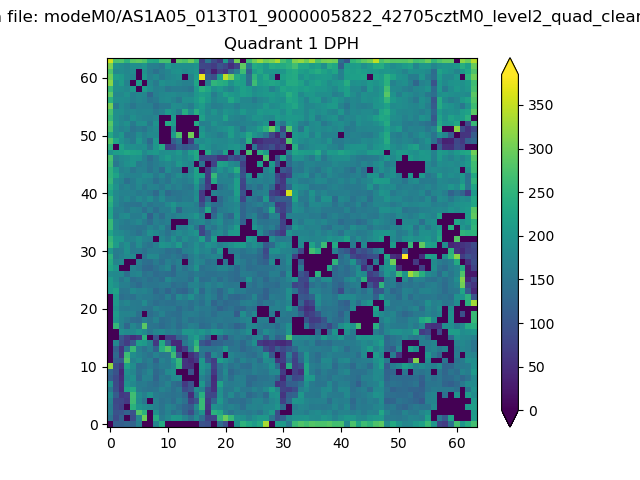 |
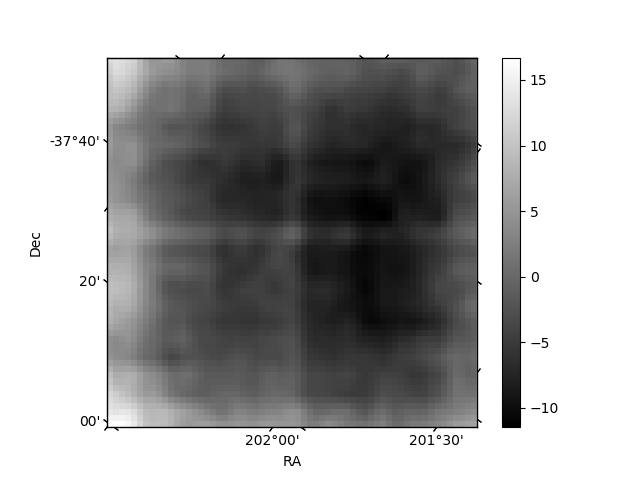
Quadrant B |
|---|---|---|---|
| Quadrant D | 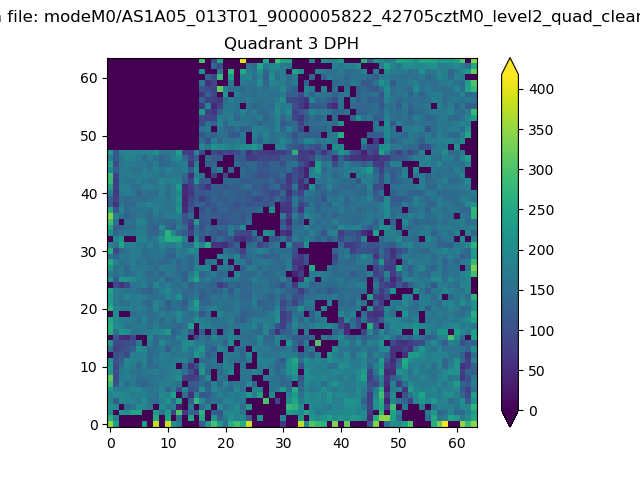 |
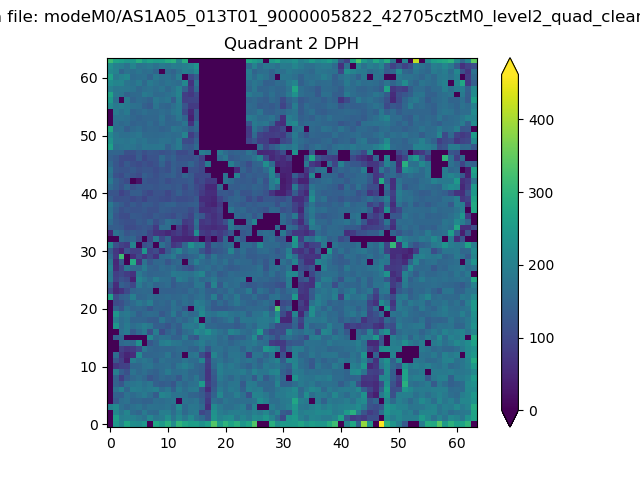 |
Quadrant C |
| Plot type | Count rate plots | Images |
|---|---|---|
| Comparison with Poisson distribution Blue bars denote a histogram of data divided into 1 sec bins. Red curve is a Poisson curve with rate = median count rate of data. |
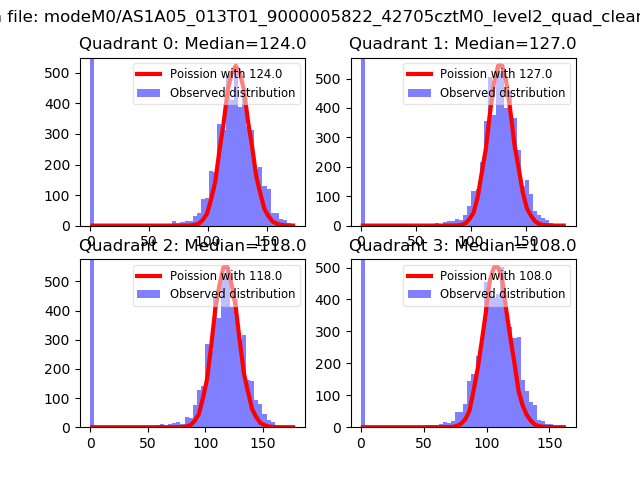 |
 |
| Quadrant-wise count rates Data is divided into 100 sec bins |
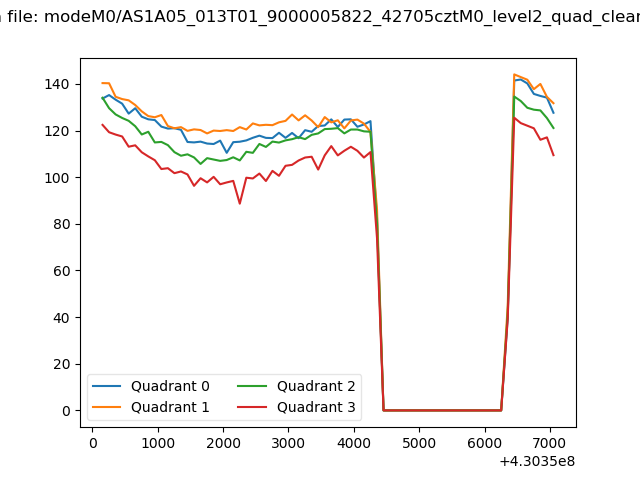 |
|
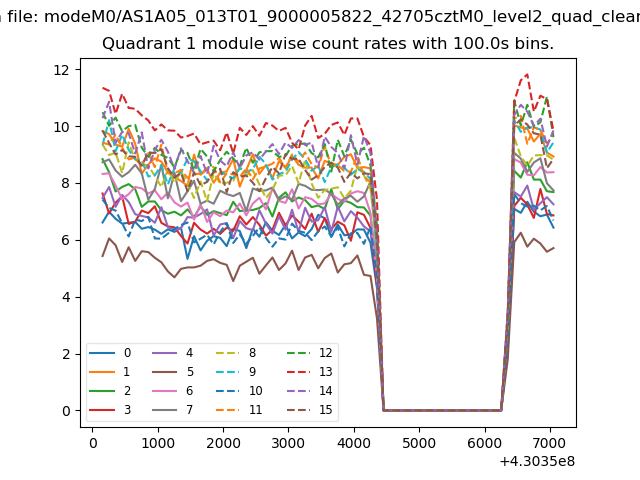
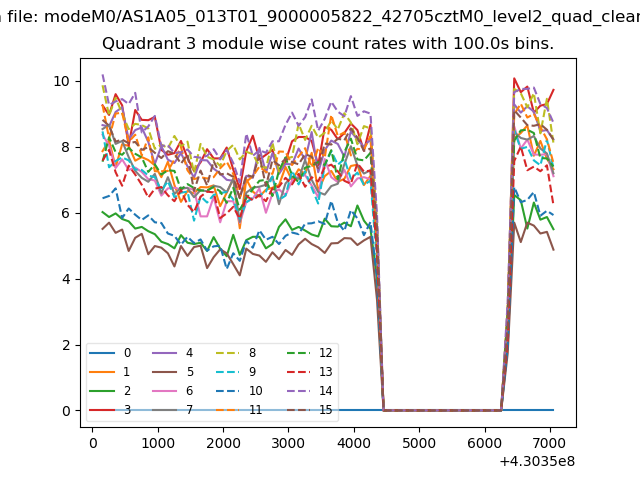
| Module-wise count rates for Quadrant A Data is divided into 100 sec bins |
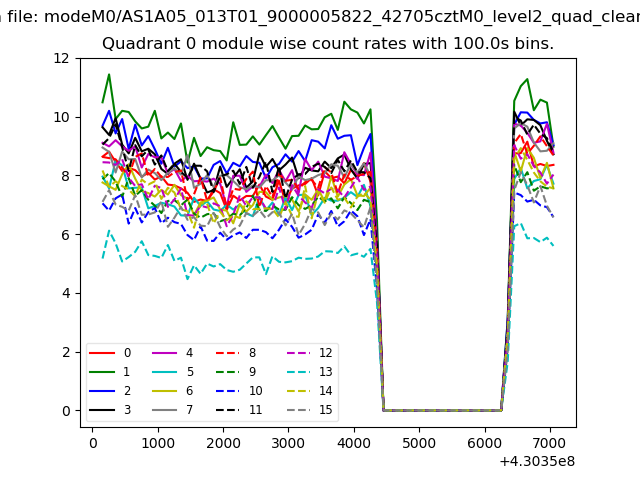 |
 |
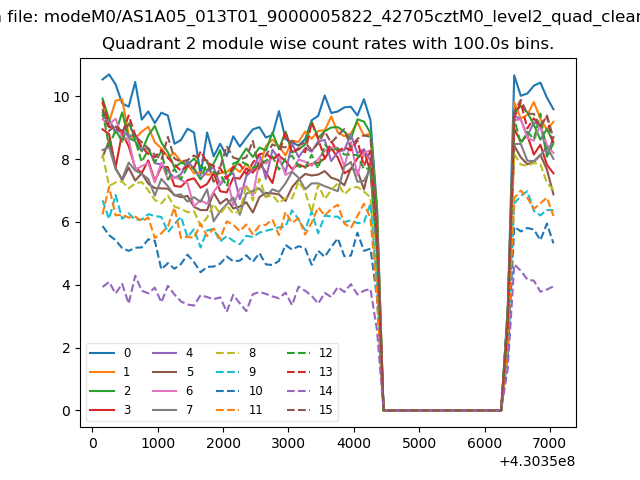
| Module-wise count rates for Quadrant B Data is divided into 100 sec bins |
 |
 |
| Module-wise count rates for Quadrant C Data is divided into 100 sec bins |
 |
 |
| Module-wise count rates for Quadrant D Data is divided into 100 sec bins |
 |
 |
| Parameter | Plot |
|---|---|
| CZT HV Monitor | 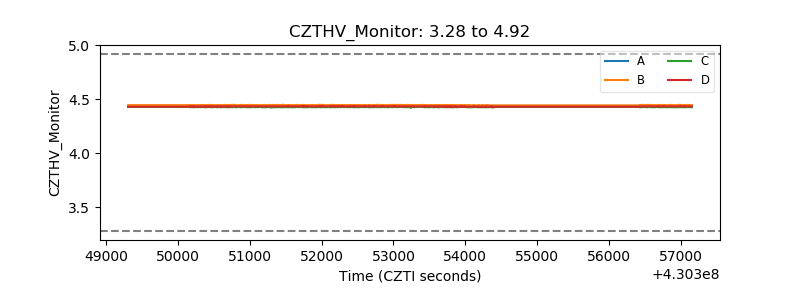 |
| D_VDD | 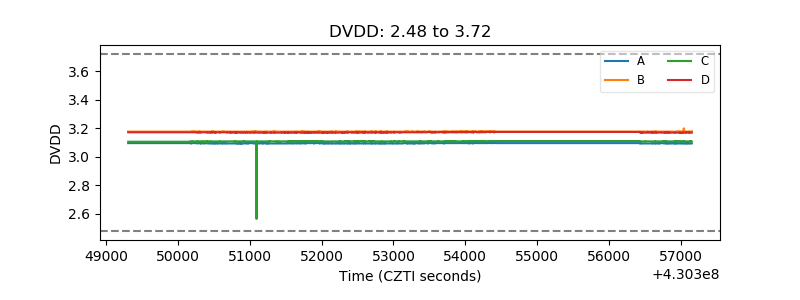 |
| Temperature 1 | 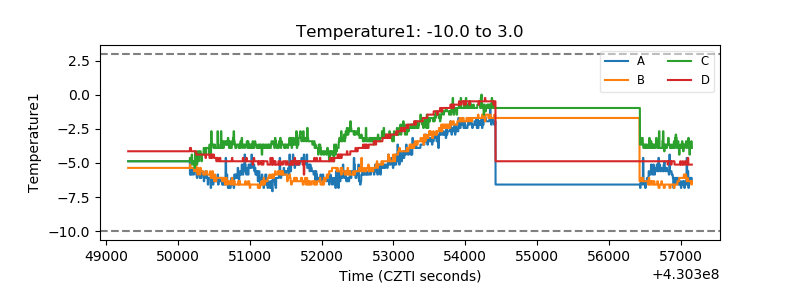 |
| Veto HV Monitor | 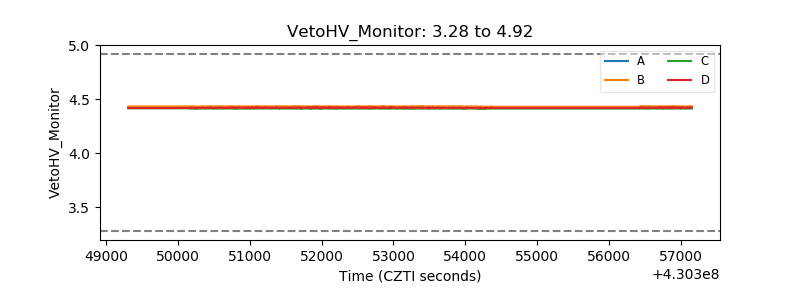 |
| Veto LLD | 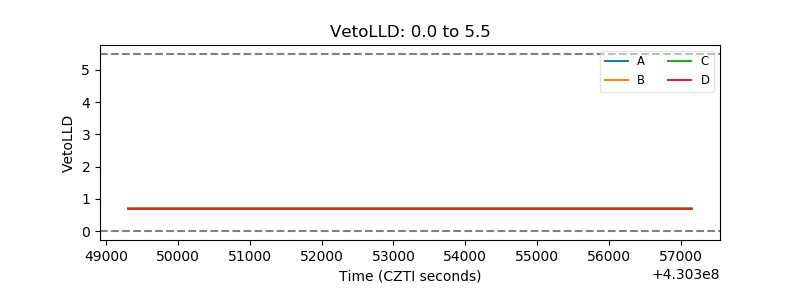 |
| Alpha Counter | 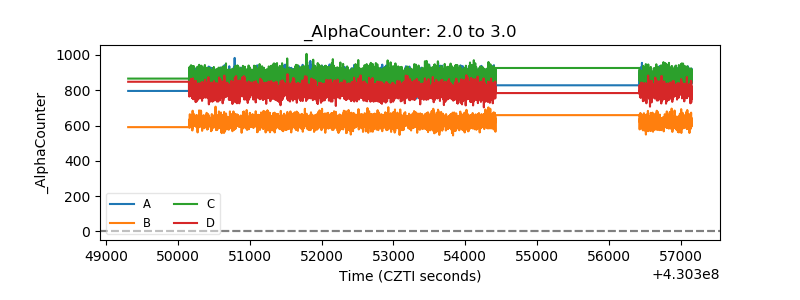 |
| _CPM_Rate | 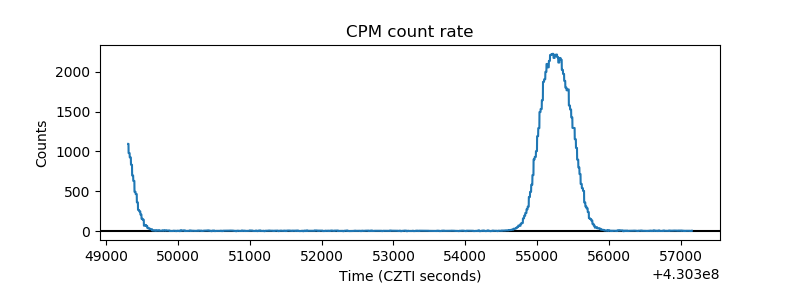 |
| CZT Counter | 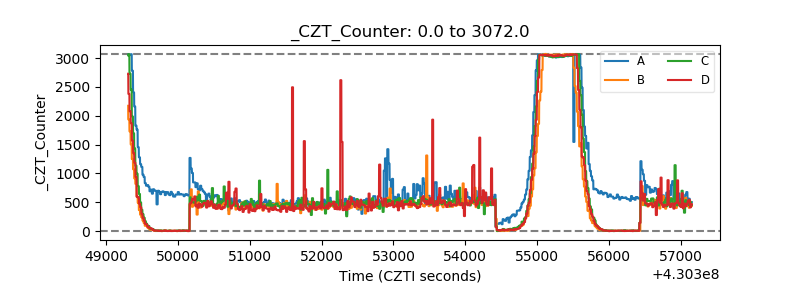 |
| +2.5 Volts monitor | 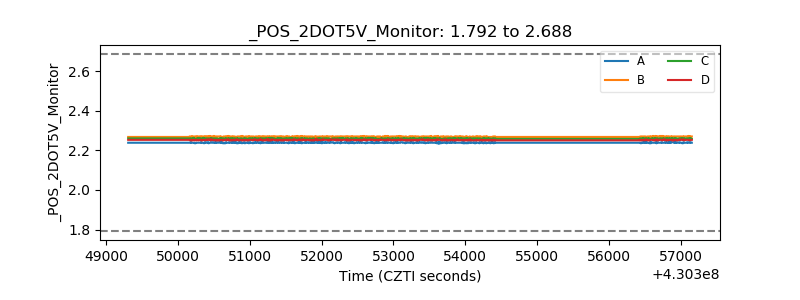 |
| +5 Volts monitor | 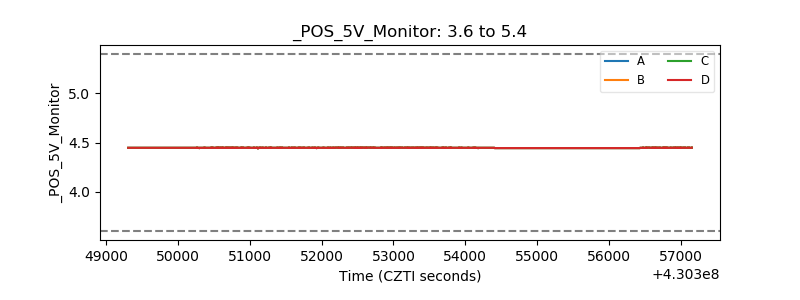 |
| _ROLL_ROT | 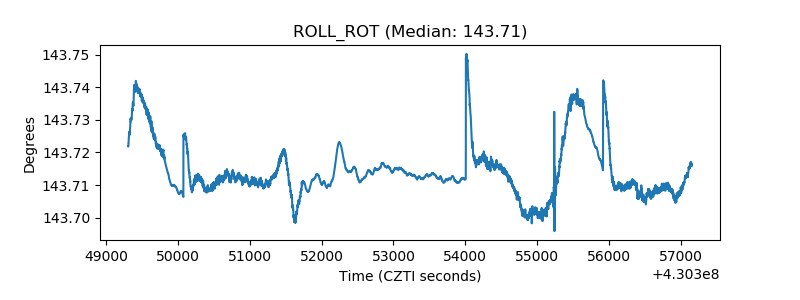 |
| _Roll_DEC | 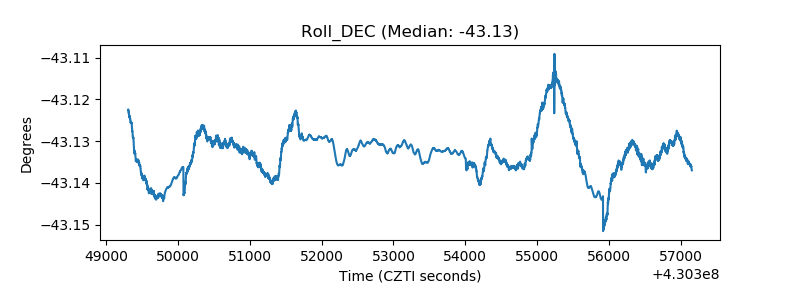 |
| _Roll_RA | 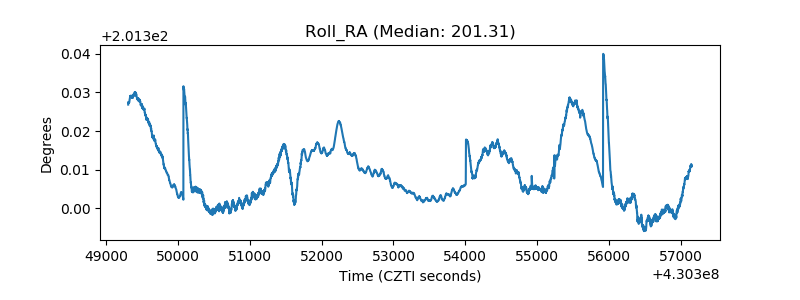 |
| Veto Counter | 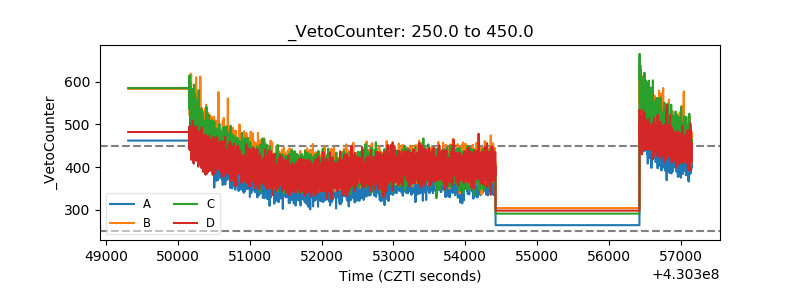 |