| Param | Original file | Final file |
|---|---|---|
| Filename | modeM0/AS1A05_013T01_9000005822_42706cztM0_level2.fits | modeM0/AS1A05_013T01_9000005822_42706cztM0_level2_quad_clean.evt |
| Size (bytes) | 315,034,560 | 91,422,720 |
| Size | 300.4 MB | 87.2 MB |
| Events in quadrant A | 3,283,484 | 626,284 |
| Events in quadrant B | 2,444,419 | 645,971 |
| Events in quadrant C | 2,596,467 | 603,639 |
| Events in quadrant D | 2,949,380 | 543,951 |
| Mode M0 | |||
|---|---|---|---|
| Quadrant | BADHDUFLAG | Total packets | Discarded packets |
| A | 0 | 12752 | 2 |
| B | 0 | 10331 | 2 |
| C | 0 | 10451 | 2 |
| D | 0 | 12159 | 2 |
| Mode M9 | |||
|---|---|---|---|
| Quadrant | BADHDUFLAG | Total packets | Discarded packets |
| A | 0 | 38 | 0 |
| B | 0 | 39 | 0 |
| C | 0 | 39 | 0 |
| D | 0 | 39 | 0 |
| Mode SS | |||
|---|---|---|---|
| Quadrant | BADHDUFLAG | Total packets | Discarded packets |
| A | 0 | 100 | 0 |
| B | 0 | 100 | 0 |
| C | 0 | 100 | 0 |
| D | 0 | 100 | 0 |
| Quadrant | Total seconds | Saturated seconds | Saturation percentage |
|---|---|---|---|
| A | 4978 | 66 | 1.325834% |
| B | 4978 | 20 | 0.401768% |
| C | 4978 | 12 | 0.241061% |
| D | 4978 | 130 | 2.611491% |
Noise dominated data is calculated using 1-second bins in cleaned event files. If a bin has >2000 counts, and if more than 50% of those come from <1% of pixels, then it is considered to be noise-dominated and hence unusable.
| Quadrant | # 1 sec bins | Bins with >0 counts | Bins with >2000 counts | High rate bins dominated by noise | Noise dominated (total time) | Noise dominated (detector-on time) | Marked lightcurve |
|---|---|---|---|---|---|---|---|
| A | 7071 | 4979 | 51 | 51 | 0.72% | 1.02% | 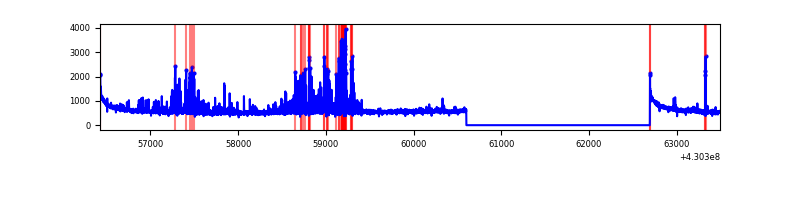 |
| B | 7071 | 4979 | 12 | 12 | 0.17% | 0.24% | 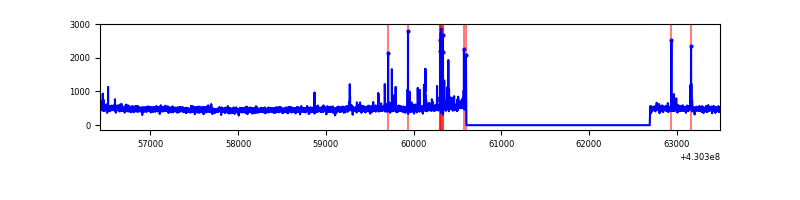 |
| C | 7071 | 4979 | 8 | 8 | 0.11% | 0.16% | 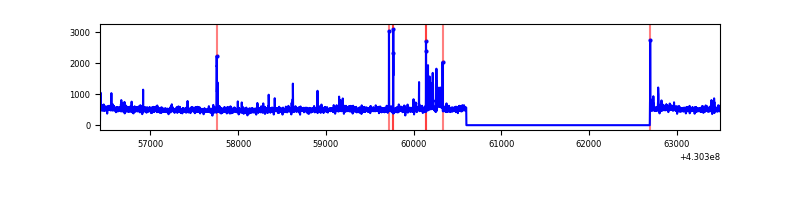 |
| D | 7071 | 4978 | 125 | 125 | 1.77% | 2.51% | 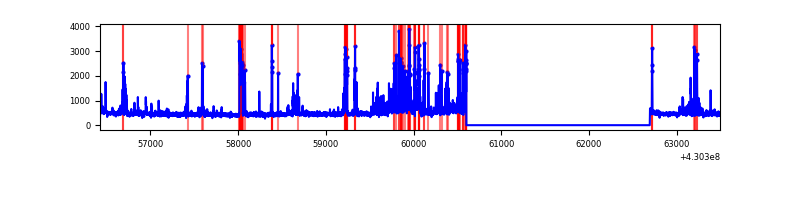 |
Top three noisy pixels from each quadrant. If the there are fewer than three noisy pixels in the level2.evt file, extra rows are filled as -1
| Pixel properties | Quadrant properties | ||||||
|---|---|---|---|---|---|---|---|
| Quadrant | DetID | PixID | Counts | Sigma | Mean | Median | Sigma |
| A | 10 | 83 | 536192 | 4477.94 | 589 | 579 | 119.6 |
| A | 9 | 143 | 440063 | 3674.26 | 589 | 579 | 119.6 |
| A | 13 | 248 | 17626 | 142.52 | 589 | 579 | 119.6 |
| B | 5 | 172 | 36570 | 318.06 | 589 | 574 | 113.2 |
| B | 5 | 255 | 31025 | 269.06 | 589 | 574 | 113.2 |
| B | 15 | 32 | 28474 | 246.52 | 589 | 574 | 113.2 |
| C | 15 | 214 | 208786 | 1563.97 | 578 | 582 | 133.1 |
| C | 14 | 254 | 102908 | 768.64 | 578 | 582 | 133.1 |
| C | 3 | 233 | 20331 | 148.35 | 578 | 582 | 133.1 |
| D | 2 | 249 | 318509 | 2289.16 | 567 | 550 | 138.9 |
| D | 12 | 6 | 193756 | 1390.99 | 567 | 550 | 138.9 |
| D | 9 | 19 | 103143 | 738.62 | 567 | 550 | 138.9 |
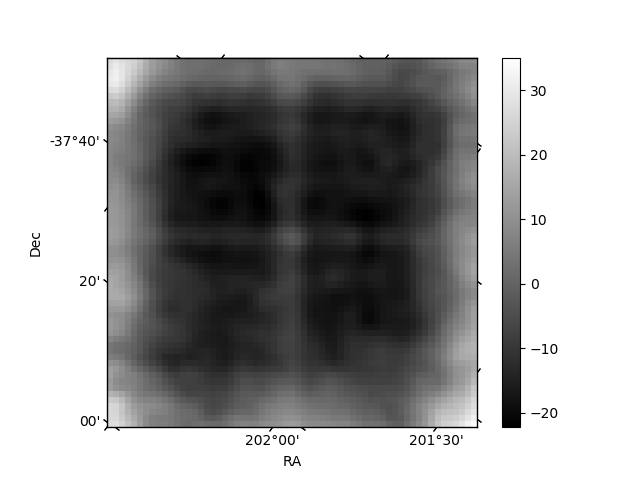
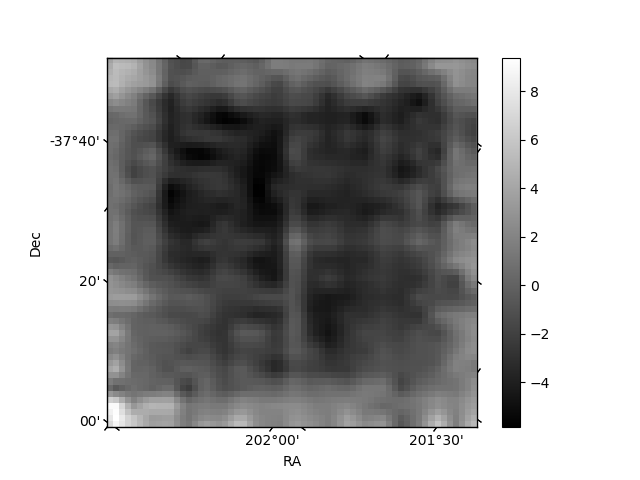
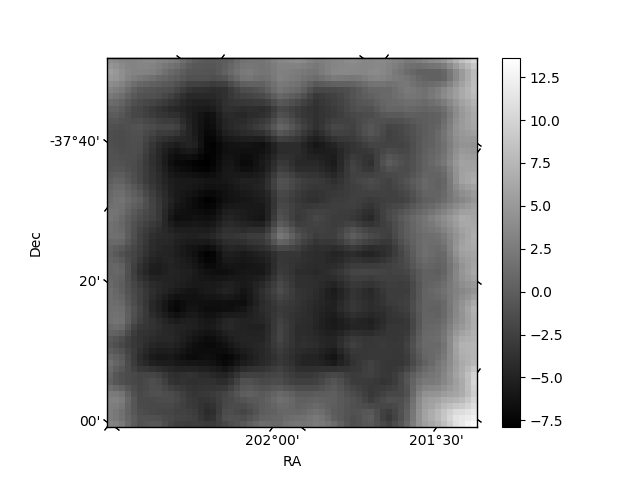
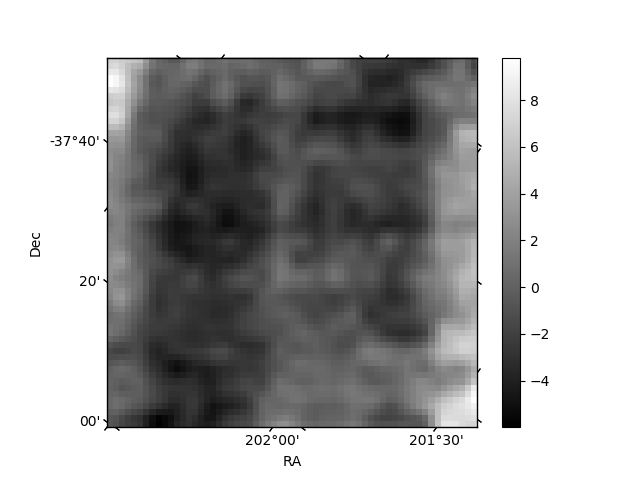
Histogram calculated using DETX and DETY for each event in the final _common_clean file
| Quadrant A | 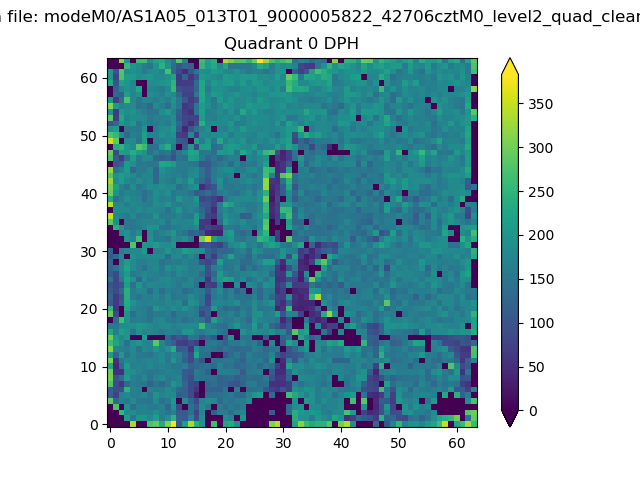 |
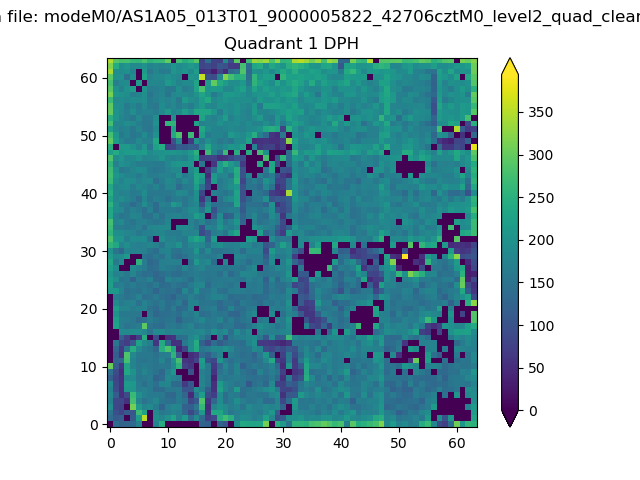 |
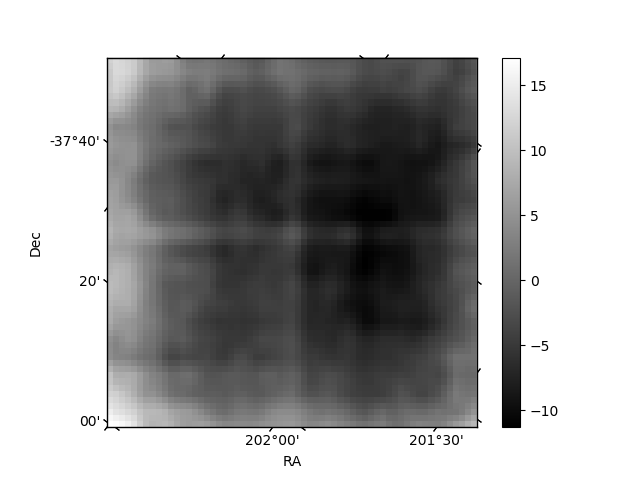
Quadrant B |
|---|---|---|---|
| Quadrant D | 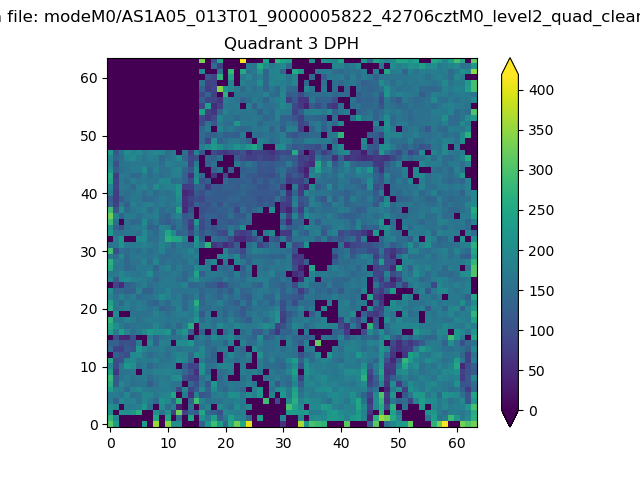 |
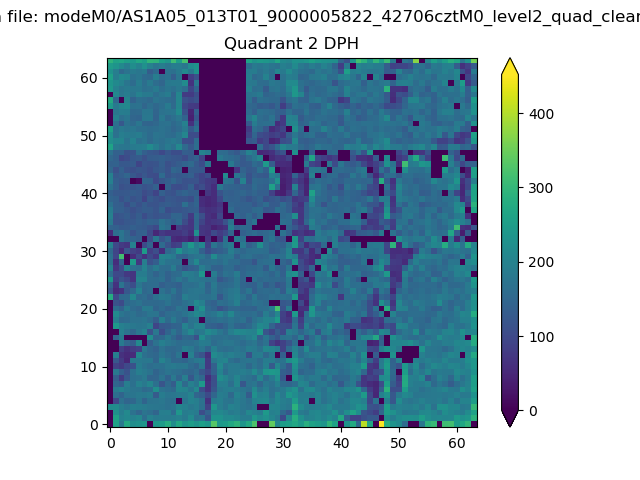 |
Quadrant C |
| Plot type | Count rate plots | Images |
|---|---|---|
| Comparison with Poisson distribution Blue bars denote a histogram of data divided into 1 sec bins. Red curve is a Poisson curve with rate = median count rate of data. |
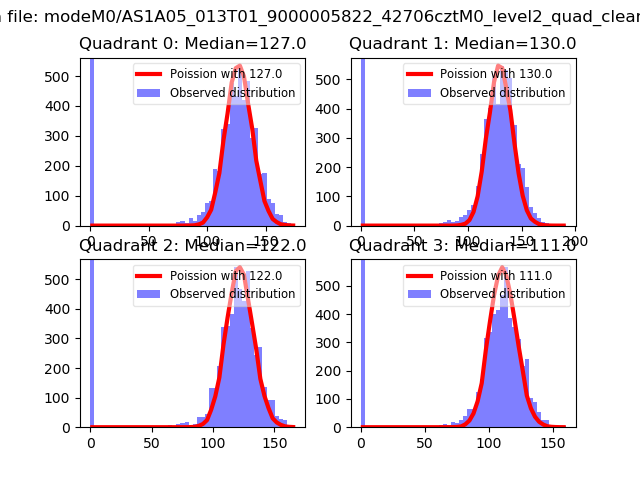 |
 |
| Quadrant-wise count rates Data is divided into 100 sec bins |
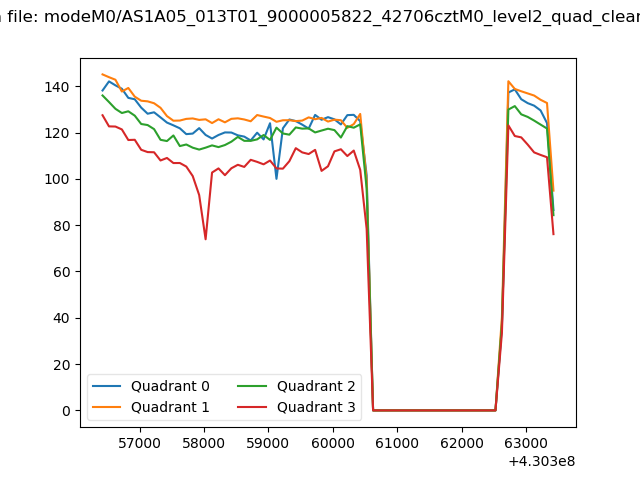 |
|
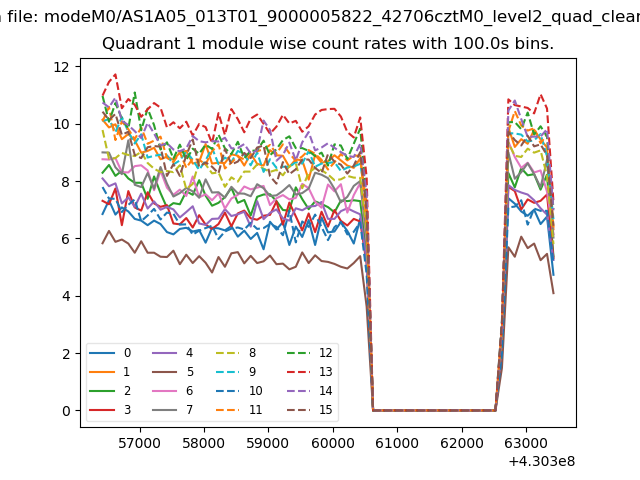
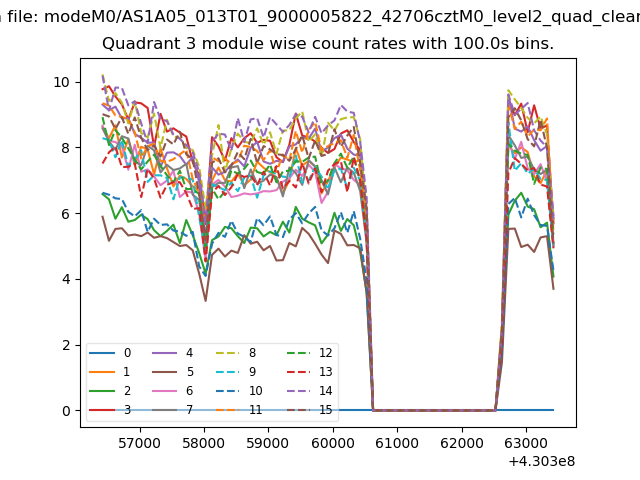
| Module-wise count rates for Quadrant A Data is divided into 100 sec bins |
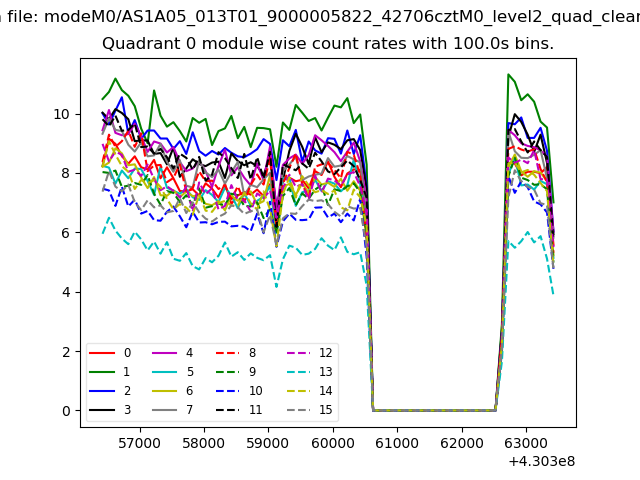 |
 |
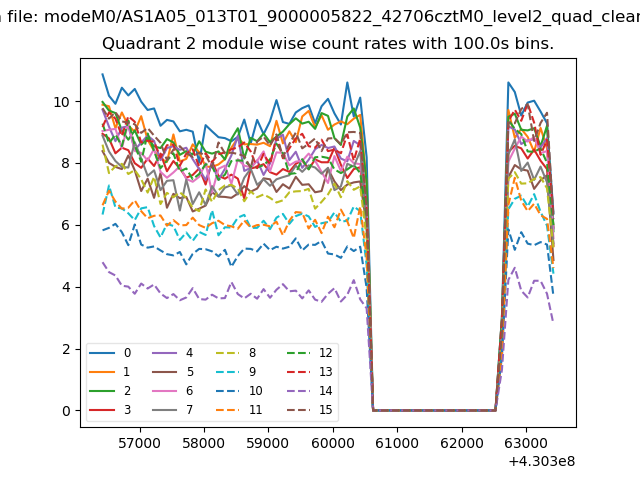
| Module-wise count rates for Quadrant B Data is divided into 100 sec bins |
 |
 |
| Module-wise count rates for Quadrant C Data is divided into 100 sec bins |
 |
 |
| Module-wise count rates for Quadrant D Data is divided into 100 sec bins |
 |
 |
| Parameter | Plot |
|---|---|
| CZT HV Monitor | 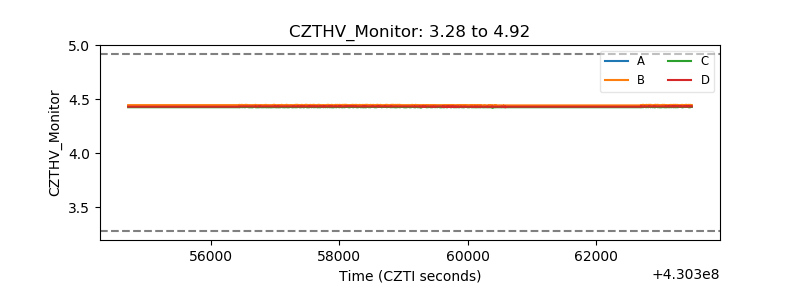 |
| D_VDD | 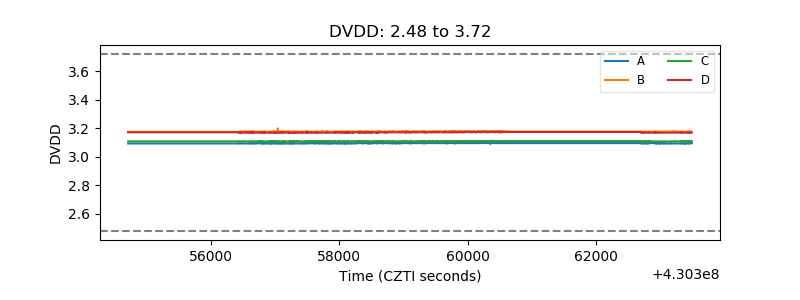 |
| Temperature 1 | 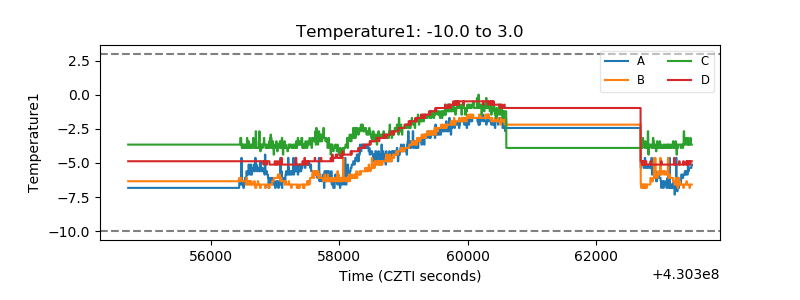 |
| Veto HV Monitor |  |
| Veto LLD | 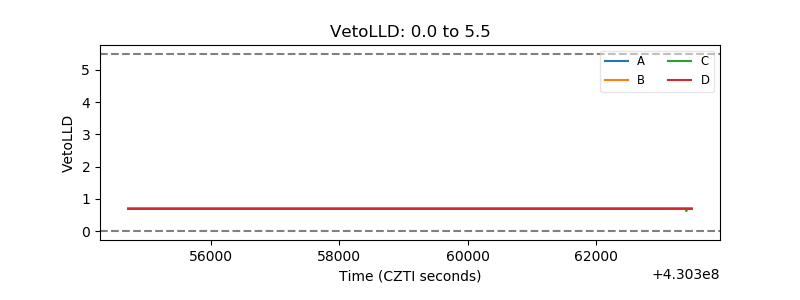 |
| Alpha Counter | 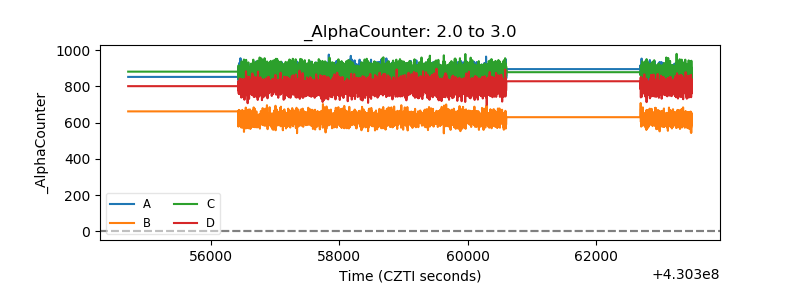 |
| _CPM_Rate | 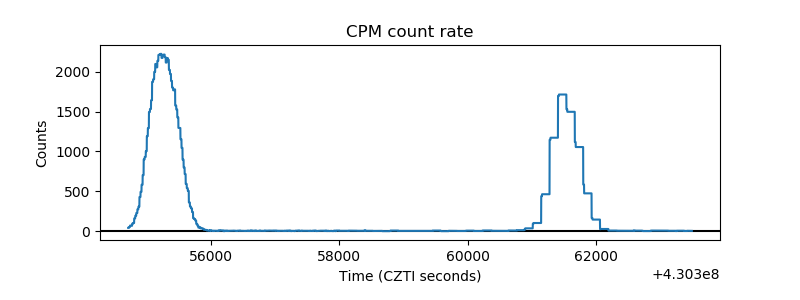 |
| CZT Counter | 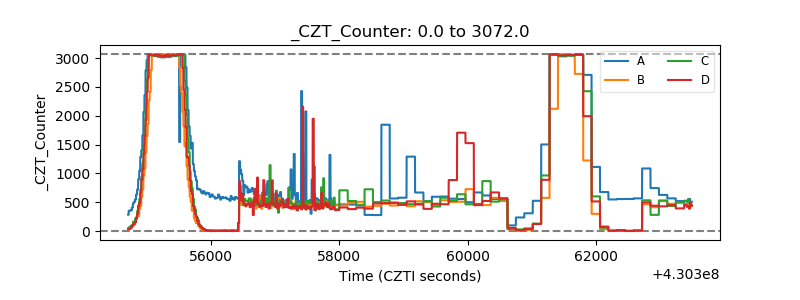 |
| +2.5 Volts monitor | 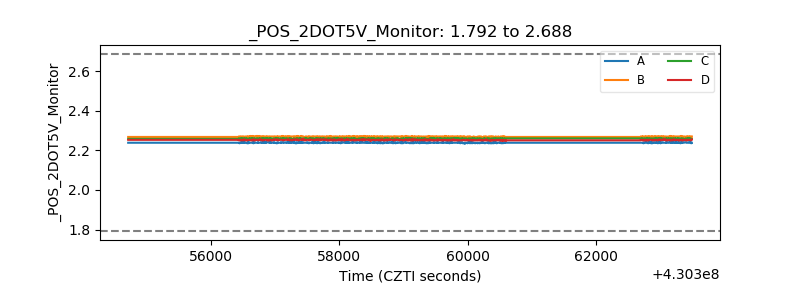 |
| +5 Volts monitor | 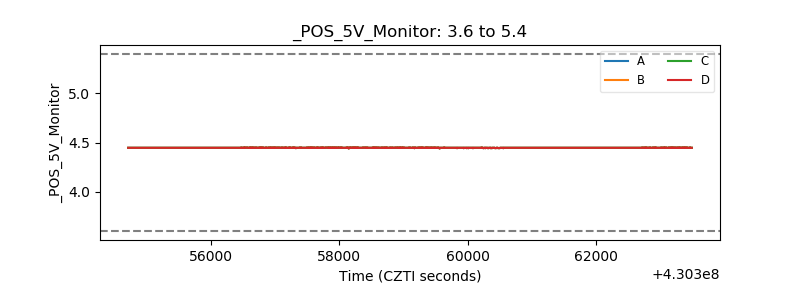 |
| _ROLL_ROT | 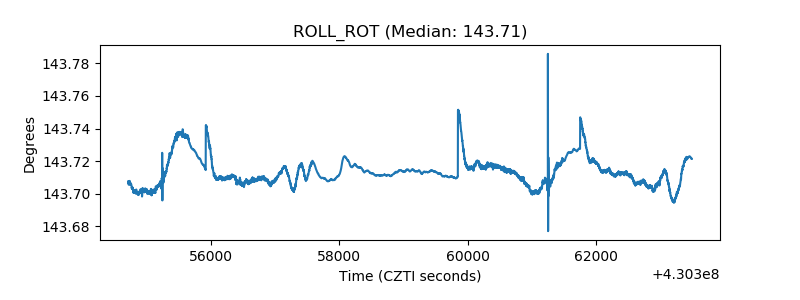 |
| _Roll_DEC | 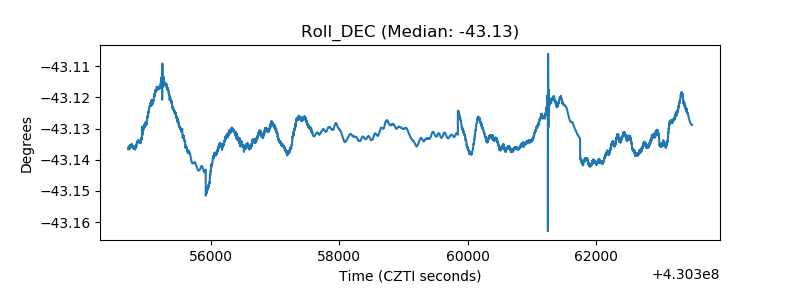 |
| _Roll_RA | 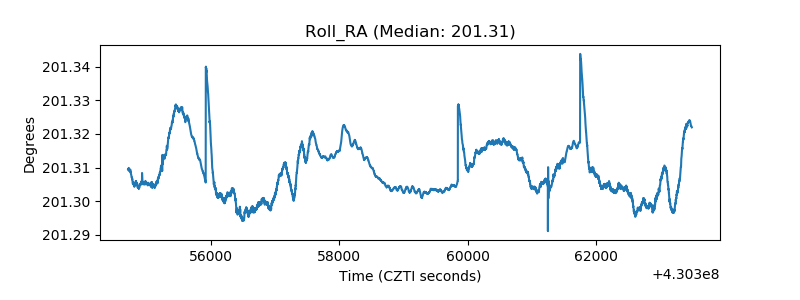 |
| Veto Counter |  |