| Param | Original file | Final file |
|---|---|---|
| Filename | modeM0/AS1A05_013T01_9000005822_42707cztM0_level2.fits | modeM0/AS1A05_013T01_9000005822_42707cztM0_level2_quad_clean.evt |
| Size (bytes) | 300,890,880 | 92,882,880 |
| Size | 287.0 MB | 88.6 MB |
| Events in quadrant A | 3,037,560 | 629,764 |
| Events in quadrant B | 2,502,247 | 652,728 |
| Events in quadrant C | 2,642,182 | 611,241 |
| Events in quadrant D | 2,556,401 | 559,670 |
| Mode M0 | |||
|---|---|---|---|
| Quadrant | BADHDUFLAG | Total packets | Discarded packets |
| A | 0 | 11942 | 2 |
| B | 0 | 10669 | 2 |
| C | 0 | 10675 | 2 |
| D | 0 | 11042 | 2 |
| Mode M9 | |||
|---|---|---|---|
| Quadrant | BADHDUFLAG | Total packets | Discarded packets |
| A | 0 | 27 | 0 |
| B | 0 | 28 | 0 |
| C | 0 | 28 | 0 |
| D | 0 | 28 | 0 |
| Mode SS | |||
|---|---|---|---|
| Quadrant | BADHDUFLAG | Total packets | Discarded packets |
| A | 0 | 106 | 0 |
| B | 0 | 106 | 0 |
| C | 0 | 106 | 0 |
| D | 0 | 106 | 0 |
| Quadrant | Total seconds | Saturated seconds | Saturation percentage |
|---|---|---|---|
| A | 5125 | 29 | 0.565854% |
| B | 5125 | 19 | 0.370732% |
| C | 5125 | 10 | 0.195122% |
| D | 5125 | 28 | 0.546341% |
Noise dominated data is calculated using 1-second bins in cleaned event files. If a bin has >2000 counts, and if more than 50% of those come from <1% of pixels, then it is considered to be noise-dominated and hence unusable.
| Quadrant | # 1 sec bins | Bins with >0 counts | Bins with >2000 counts | High rate bins dominated by noise | Noise dominated (total time) | Noise dominated (detector-on time) | Marked lightcurve |
|---|---|---|---|---|---|---|---|
| A | 7278 | 5126 | 21 | 21 | 0.29% | 0.41% | 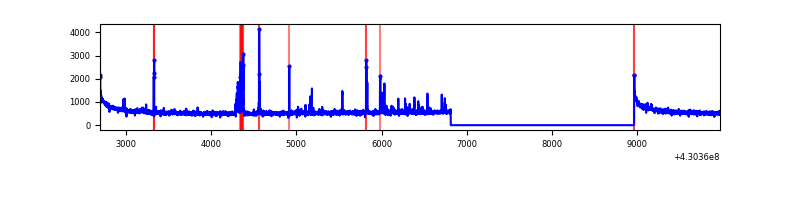 |
| B | 7278 | 5126 | 16 | 16 | 0.22% | 0.31% | 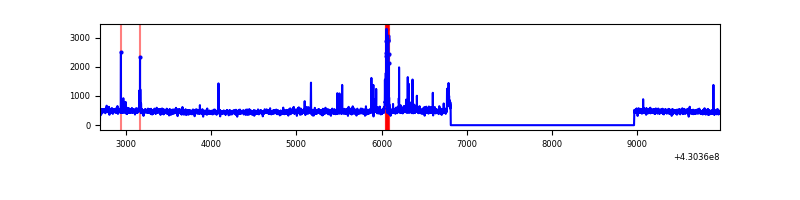 |
| C | 7278 | 5126 | 9 | 9 | 0.12% | 0.18% | 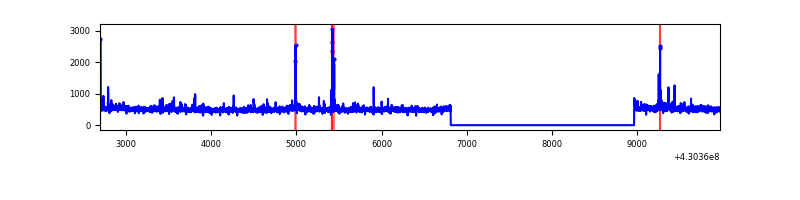 |
| D | 7278 | 5126 | 24 | 24 | 0.33% | 0.47% | 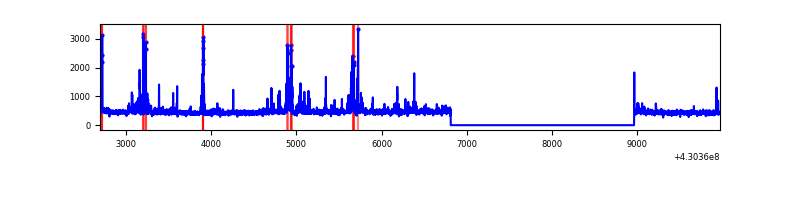 |
Top three noisy pixels from each quadrant. If the there are fewer than three noisy pixels in the level2.evt file, extra rows are filled as -1
| Pixel properties | Quadrant properties | ||||||
|---|---|---|---|---|---|---|---|
| Quadrant | DetID | PixID | Counts | Sigma | Mean | Median | Sigma |
| A | 10 | 83 | 544233 | 4431.33 | 601 | 591 | 122.7 |
| A | 13 | 248 | 152075 | 1234.77 | 601 | 591 | 122.7 |
| A | 2 | 79 | 10002 | 76.71 | 601 | 591 | 122.7 |
| B | 10 | 246 | 51252 | 443.51 | 598 | 582 | 114.2 |
| B | 5 | 172 | 42136 | 363.72 | 598 | 582 | 114.2 |
| B | 5 | 255 | 34392 | 295.94 | 598 | 582 | 114.2 |
| C | 15 | 214 | 216176 | 1583.19 | 589 | 591 | 136.2 |
| C | 14 | 254 | 73045 | 532.08 | 589 | 591 | 136.2 |
| C | 3 | 233 | 39494 | 285.69 | 589 | 591 | 136.2 |
| D | 2 | 249 | 167463 | 1177.37 | 586 | 570 | 141.8 |
| D | 12 | 6 | 80574 | 564.4 | 586 | 570 | 141.8 |
| D | 2 | 234 | 23745 | 163.49 | 586 | 570 | 141.8 |
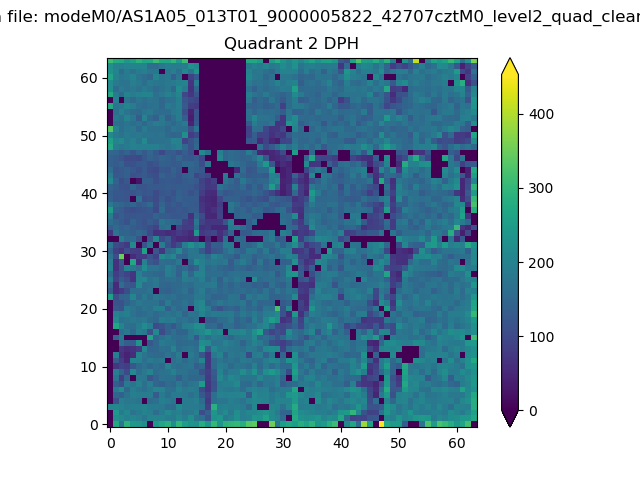
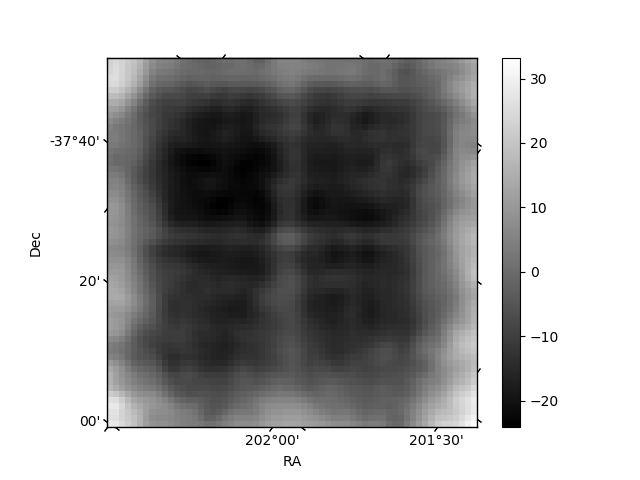
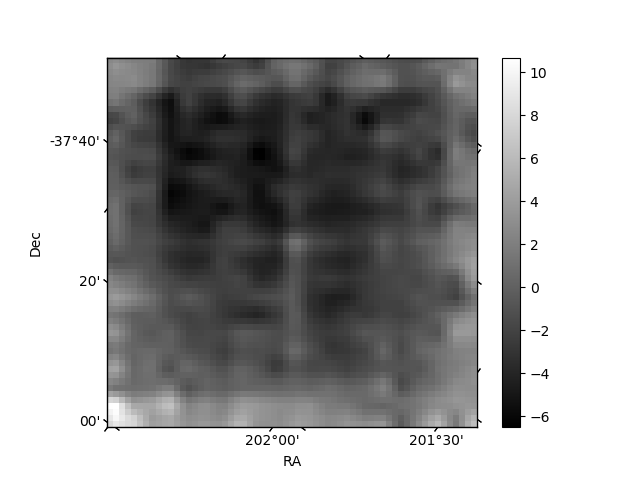
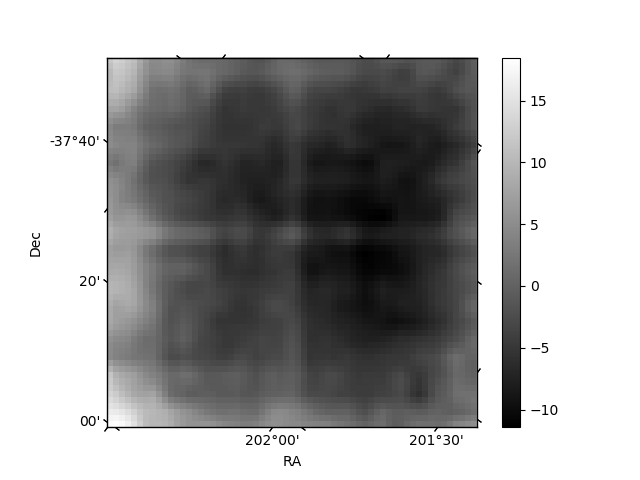
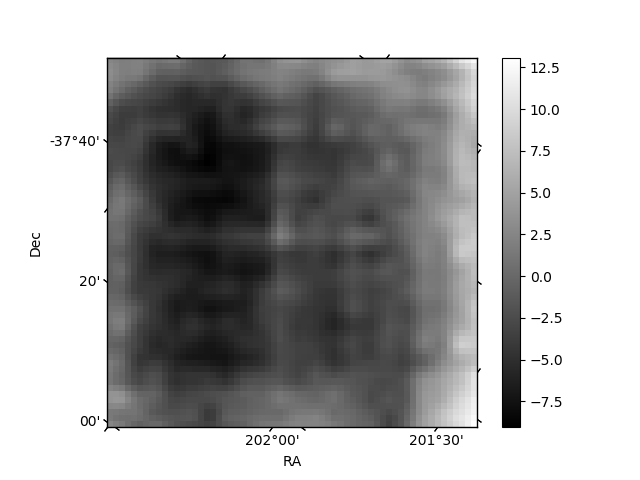
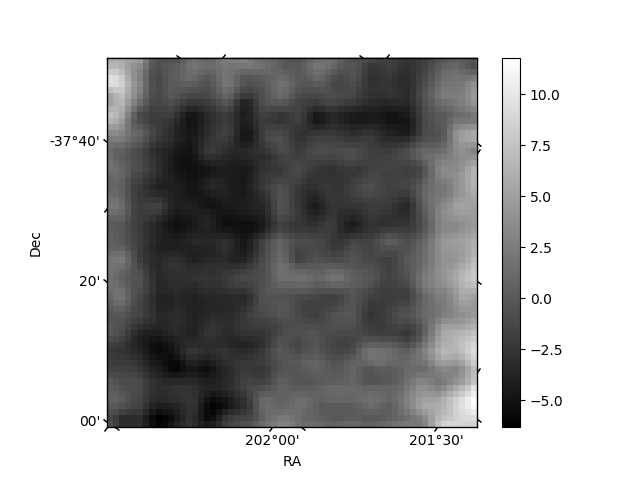
Histogram calculated using DETX and DETY for each event in the final _common_clean file
| Quadrant A | 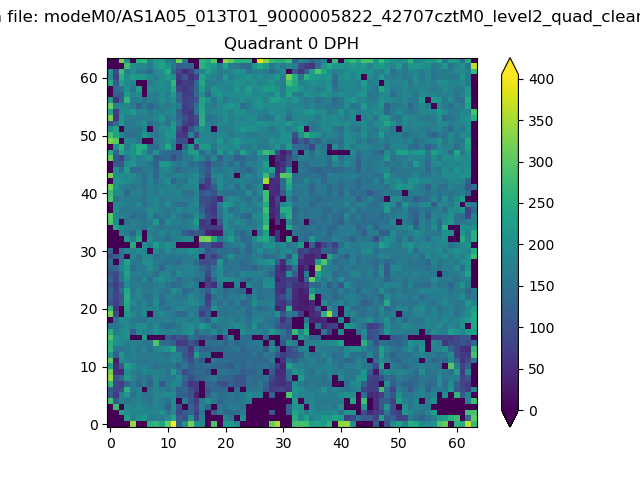 |
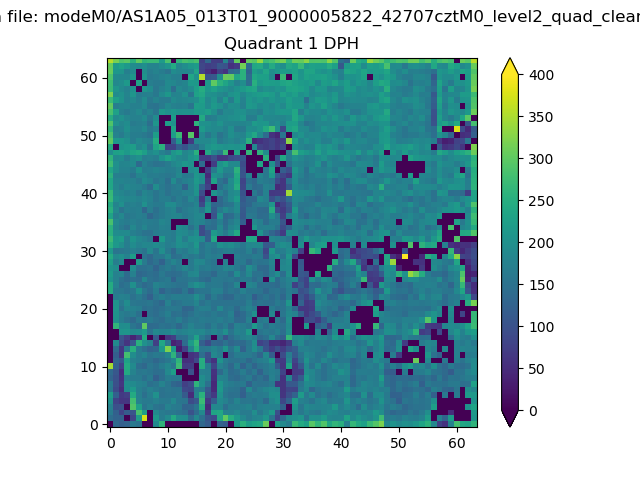 |
Quadrant B |
|---|---|---|---|
| Quadrant D | 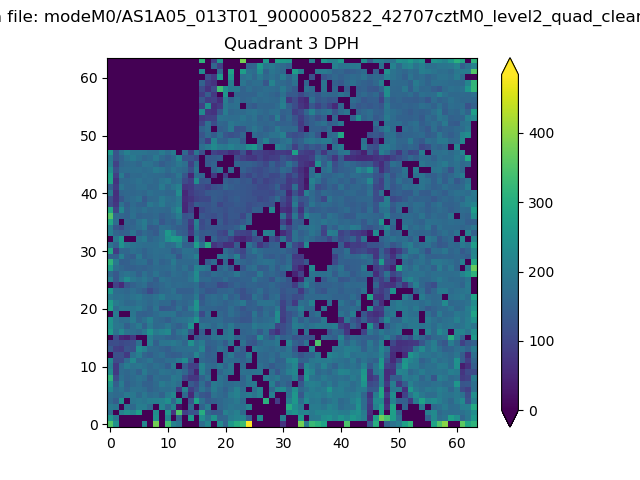 |
 |
Quadrant C |
| Plot type | Count rate plots | Images |
|---|---|---|
| Comparison with Poisson distribution Blue bars denote a histogram of data divided into 1 sec bins. Red curve is a Poisson curve with rate = median count rate of data. |
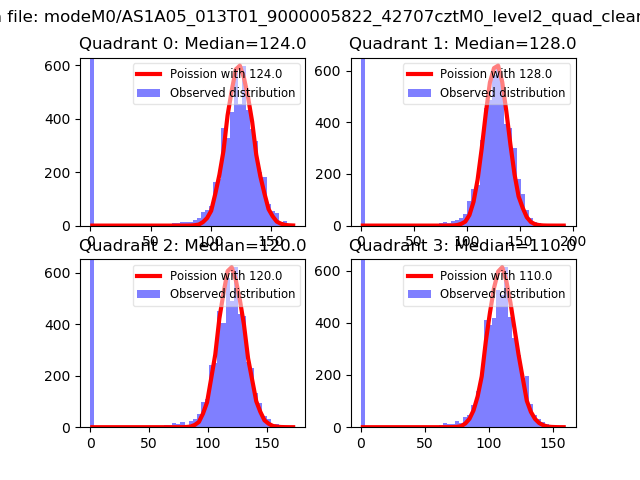 |
 |
| Quadrant-wise count rates Data is divided into 100 sec bins |
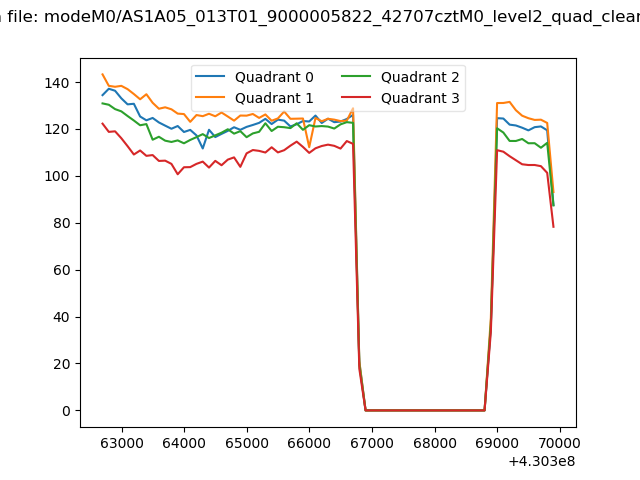 |
|
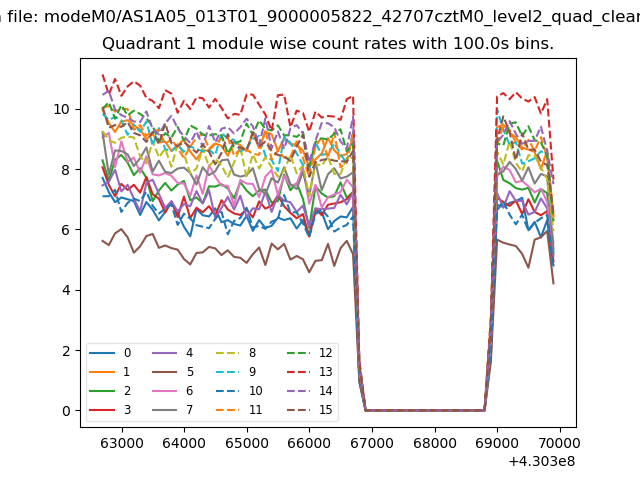
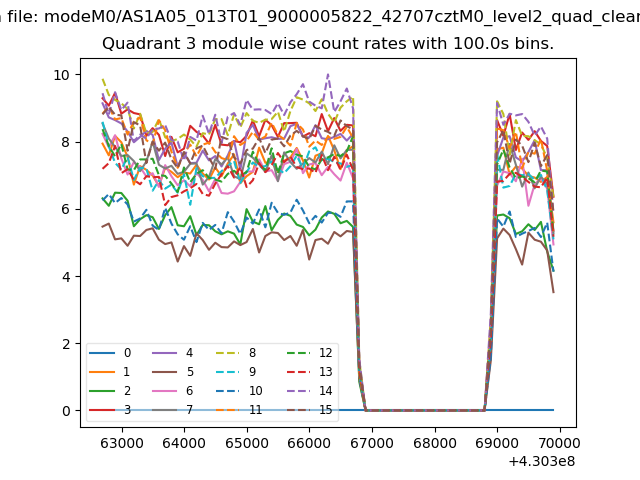
| Module-wise count rates for Quadrant A Data is divided into 100 sec bins |
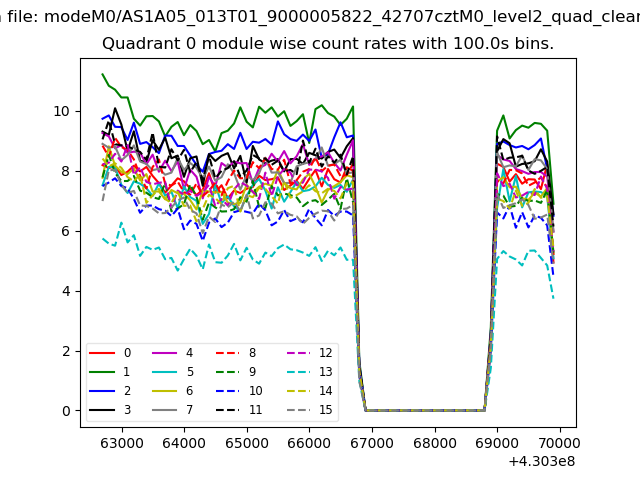 |
 |
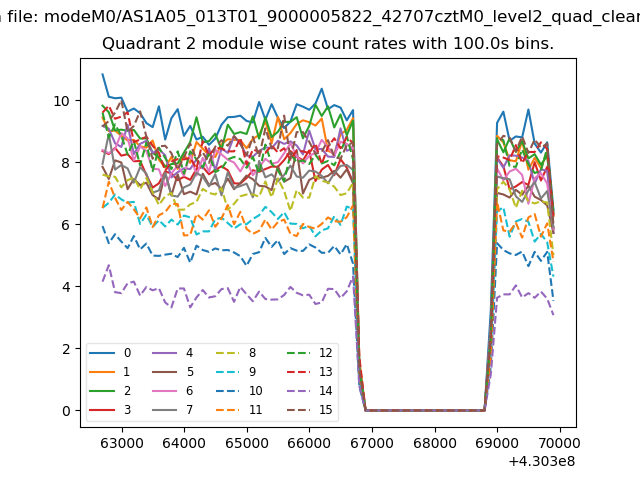
| Module-wise count rates for Quadrant B Data is divided into 100 sec bins |
 |
 |
| Module-wise count rates for Quadrant C Data is divided into 100 sec bins |
 |
 |
| Module-wise count rates for Quadrant D Data is divided into 100 sec bins |
 |
 |
| Parameter | Plot |
|---|---|
| CZT HV Monitor | 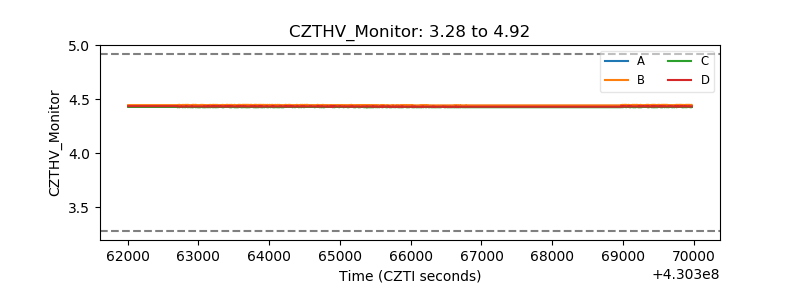 |
| D_VDD | 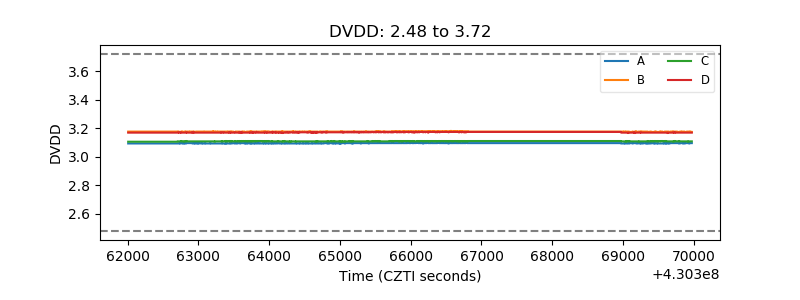 |
| Temperature 1 | 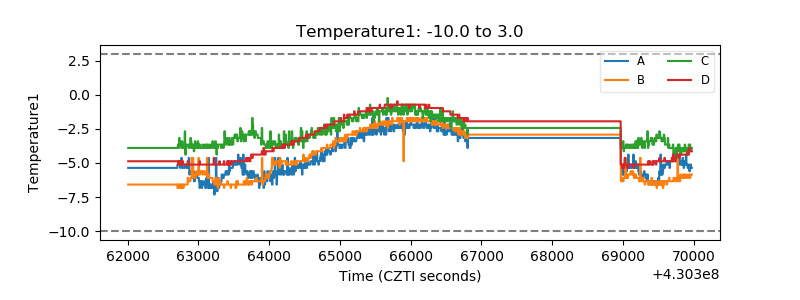 |
| Veto HV Monitor | 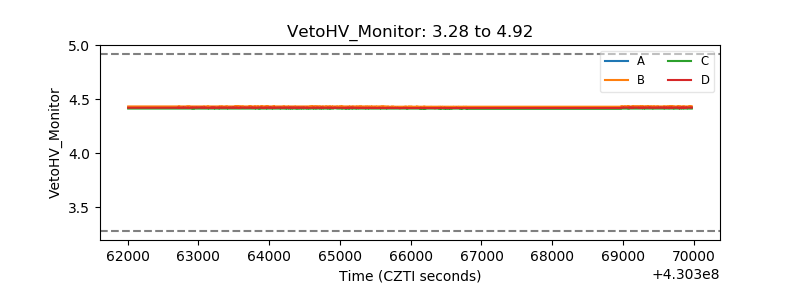 |
| Veto LLD | 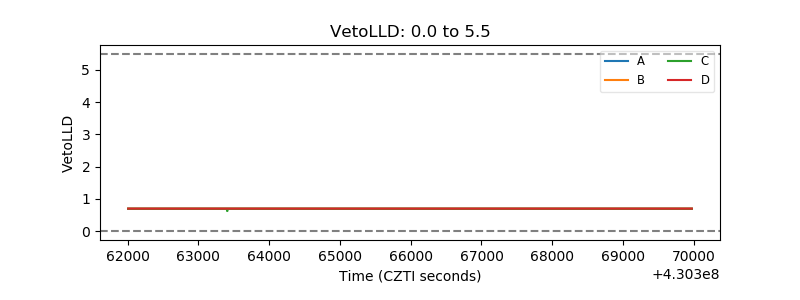 |
| Alpha Counter | 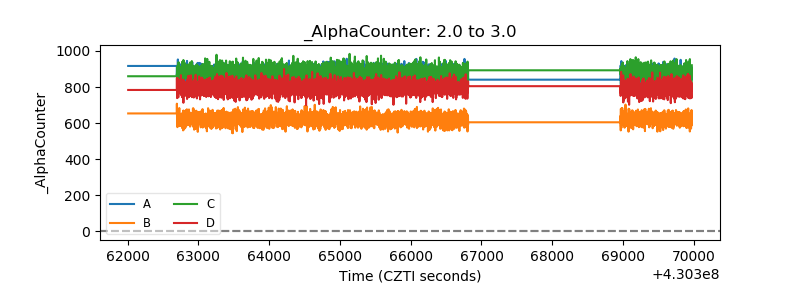 |
| _CPM_Rate |  |
| CZT Counter | 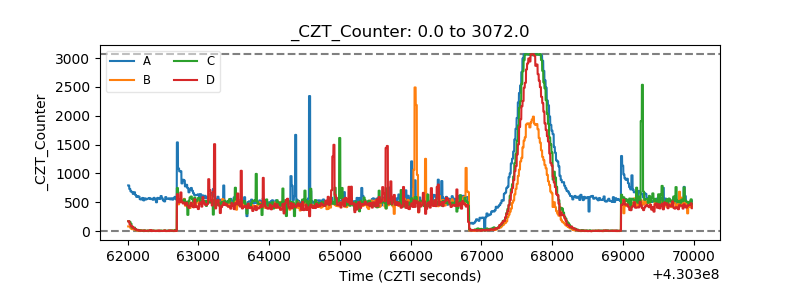 |
| +2.5 Volts monitor | 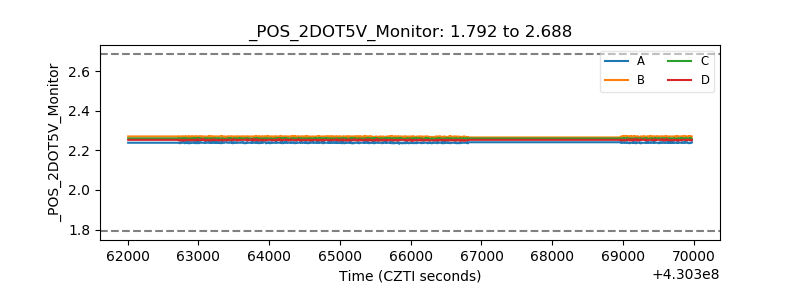 |
| +5 Volts monitor | 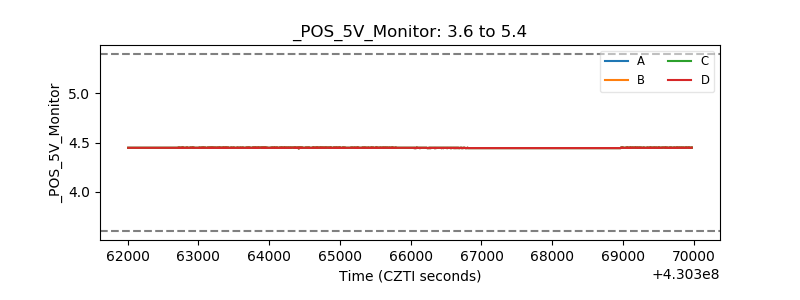 |
| _ROLL_ROT | 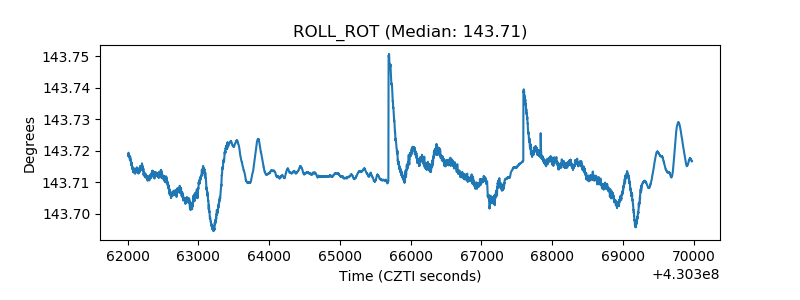 |
| _Roll_DEC | 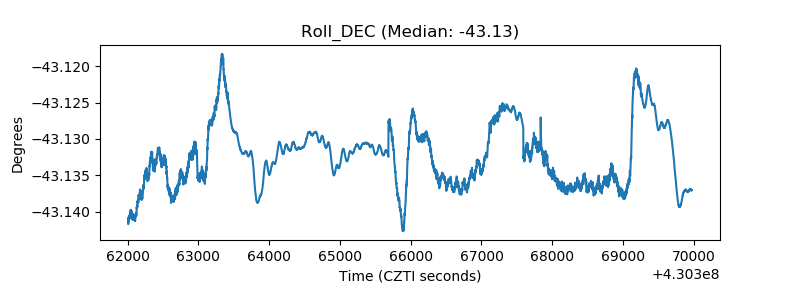 |
| _Roll_RA | 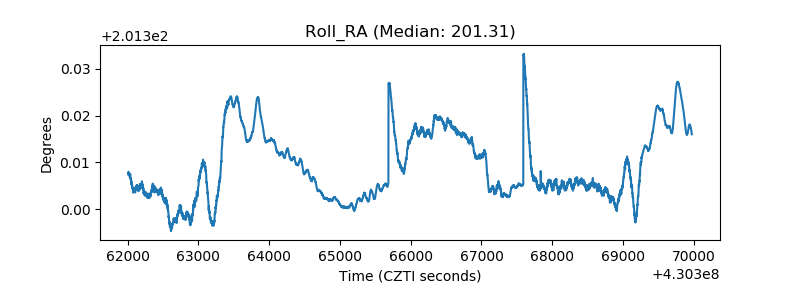 |
| Veto Counter | 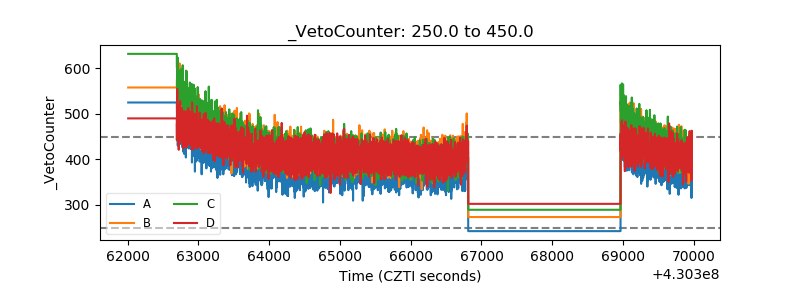 |