| Param | Original file | Final file |
|---|---|---|
| Filename | modeM0/AS1A05_013T01_9000005822_42708cztM0_level2.fits | modeM0/AS1A05_013T01_9000005822_42708cztM0_level2_quad_clean.evt |
| Size (bytes) | 288,757,440 | 88,784,640 |
| Size | 275.4 MB | 84.7 MB |
| Events in quadrant A | 2,922,019 | 598,542 |
| Events in quadrant B | 2,362,644 | 616,342 |
| Events in quadrant C | 2,545,224 | 582,230 |
| Events in quadrant D | 2,462,460 | 534,498 |
| Mode M0 | |||
|---|---|---|---|
| Quadrant | BADHDUFLAG | Total packets | Discarded packets |
| A | 0 | 11498 | 2 |
| B | 0 | 10369 | 2 |
| C | 0 | 10465 | 2 |
| D | 0 | 10801 | 2 |
| Mode M9 | |||
|---|---|---|---|
| Quadrant | BADHDUFLAG | Total packets | Discarded packets |
| A | 0 | 21 | 0 |
| B | 0 | 22 | 0 |
| C | 0 | 22 | 0 |
| D | 0 | 22 | 0 |
| Mode SS | |||
|---|---|---|---|
| Quadrant | BADHDUFLAG | Total packets | Discarded packets |
| A | 0 | 106 | 0 |
| B | 0 | 106 | 0 |
| C | 0 | 106 | 0 |
| D | 0 | 106 | 0 |
| Quadrant | Total seconds | Saturated seconds | Saturation percentage |
|---|---|---|---|
| A | 5085 | 19 | 0.373648% |
| B | 5085 | 14 | 0.275320% |
| C | 5084 | 7 | 0.137687% |
| D | 5084 | 17 | 0.334382% |
Noise dominated data is calculated using 1-second bins in cleaned event files. If a bin has >2000 counts, and if more than 50% of those come from <1% of pixels, then it is considered to be noise-dominated and hence unusable.
| Quadrant | # 1 sec bins | Bins with >0 counts | Bins with >2000 counts | High rate bins dominated by noise | Noise dominated (total time) | Noise dominated (detector-on time) | Marked lightcurve |
|---|---|---|---|---|---|---|---|
| A | 7178 | 5086 | 17 | 17 | 0.24% | 0.33% |  |
| B | 7178 | 5086 | 6 | 6 | 0.08% | 0.12% |  |
| C | 7177 | 5085 | 3 | 3 | 0.04% | 0.06% | 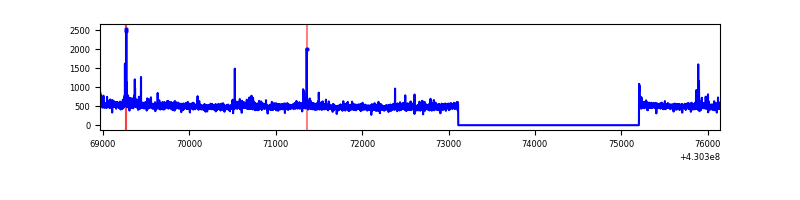 |
| D | 7177 | 5085 | 15 | 15 | 0.21% | 0.29% | 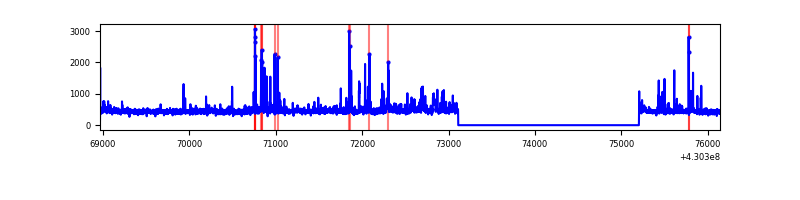 |
Top three noisy pixels from each quadrant. If the there are fewer than three noisy pixels in the level2.evt file, extra rows are filled as -1
| Pixel properties | Quadrant properties | ||||||
|---|---|---|---|---|---|---|---|
| Quadrant | DetID | PixID | Counts | Sigma | Mean | Median | Sigma |
| A | 10 | 83 | 567209 | 4712.92 | 582 | 571 | 120.2 |
| A | 0 | 230 | 85821 | 709.05 | 582 | 571 | 120.2 |
| A | 13 | 6 | 11303 | 89.26 | 582 | 571 | 120.2 |
| B | 5 | 255 | 50471 | 450.35 | 576 | 560 | 110.8 |
| B | 0 | 230 | 16105 | 140.26 | 576 | 560 | 110.8 |
| B | 12 | 111 | 13675 | 118.34 | 576 | 560 | 110.8 |
| C | 15 | 214 | 217875 | 1654.37 | 568 | 572 | 131.4 |
| C | 3 | 233 | 72785 | 549.77 | 568 | 572 | 131.4 |
| C | 4 | 254 | 24407 | 181.46 | 568 | 572 | 131.4 |
| D | 2 | 249 | 93451 | 682.61 | 567 | 551 | 136.1 |
| D | 5 | 171 | 63517 | 462.66 | 567 | 551 | 136.1 |
| D | 12 | 6 | 45120 | 327.48 | 567 | 551 | 136.1 |
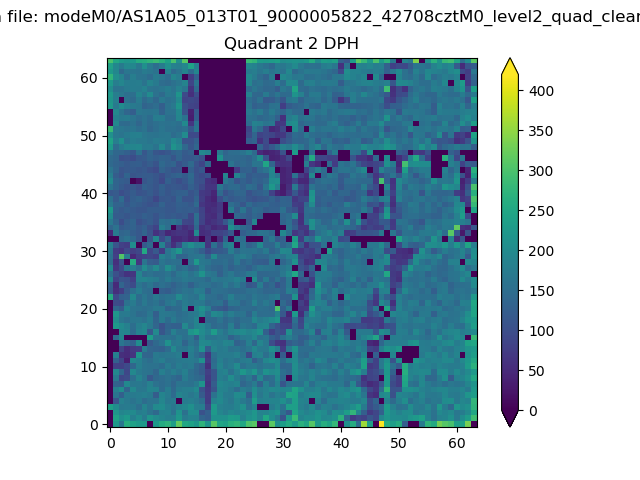
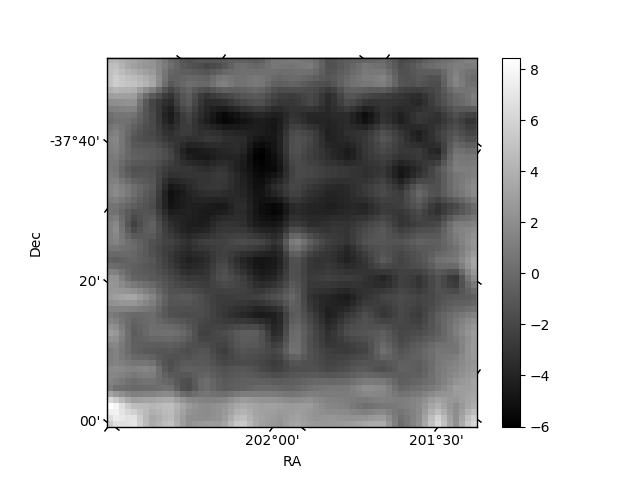
Histogram calculated using DETX and DETY for each event in the final _common_clean file
| Quadrant A | 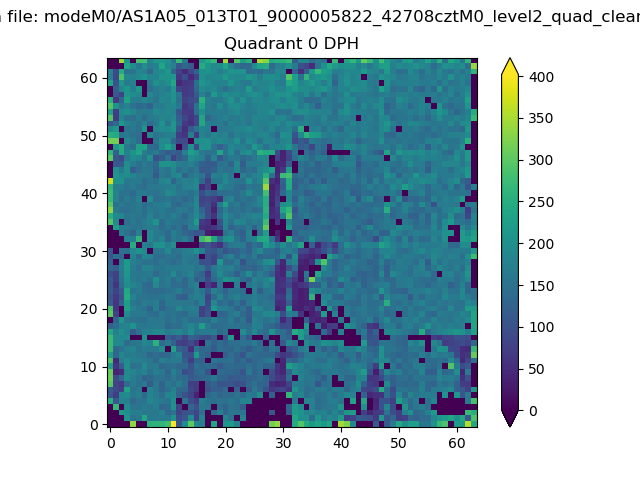 |
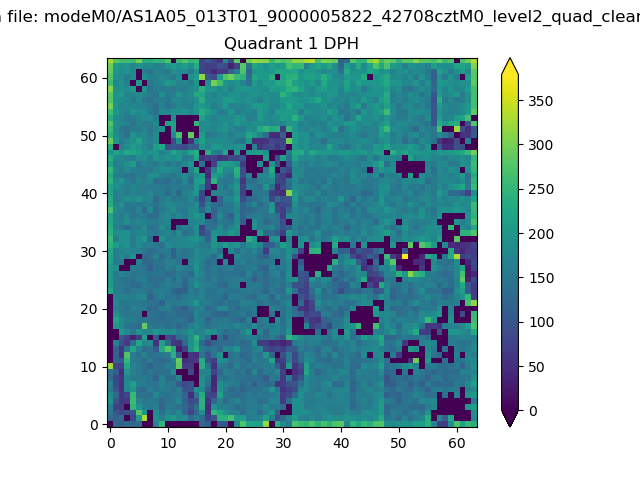 |
Quadrant B |
|---|---|---|---|
| Quadrant D | 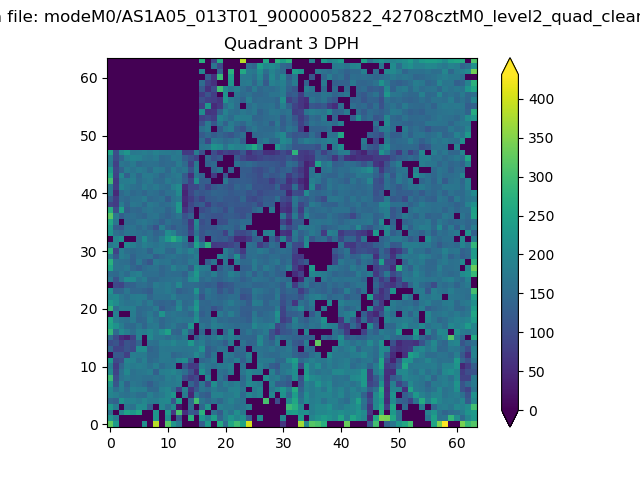 |
 |
Quadrant C |
| Plot type | Count rate plots | Images |
|---|---|---|
| Comparison with Poisson distribution Blue bars denote a histogram of data divided into 1 sec bins. Red curve is a Poisson curve with rate = median count rate of data. |
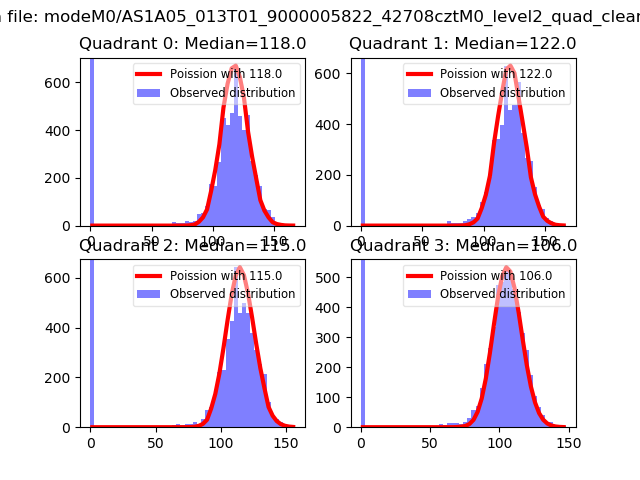 |
 |
| Quadrant-wise count rates Data is divided into 100 sec bins |
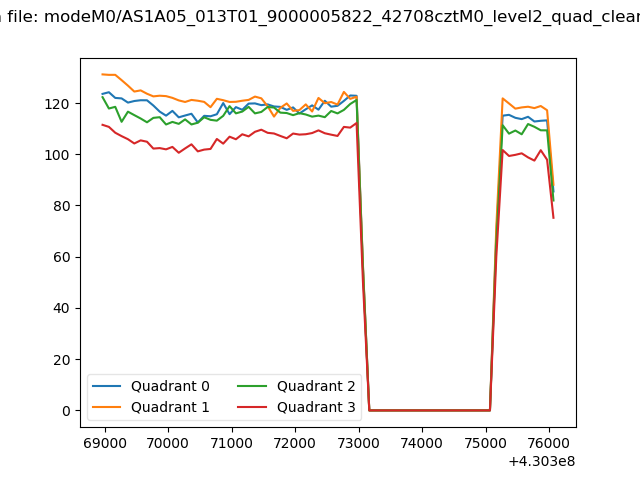 |
|
| Module-wise count rates for Quadrant A Data is divided into 100 sec bins |
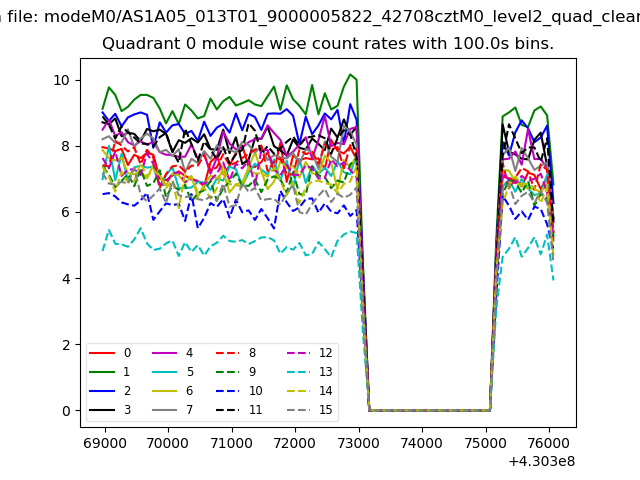 |
 |
| Module-wise count rates for Quadrant B Data is divided into 100 sec bins |
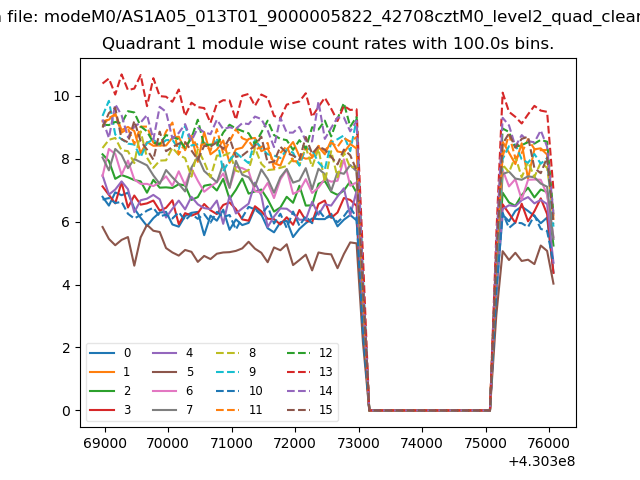 |
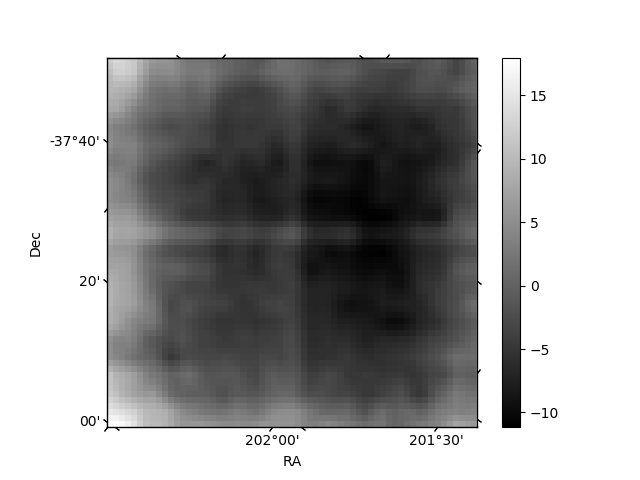 |
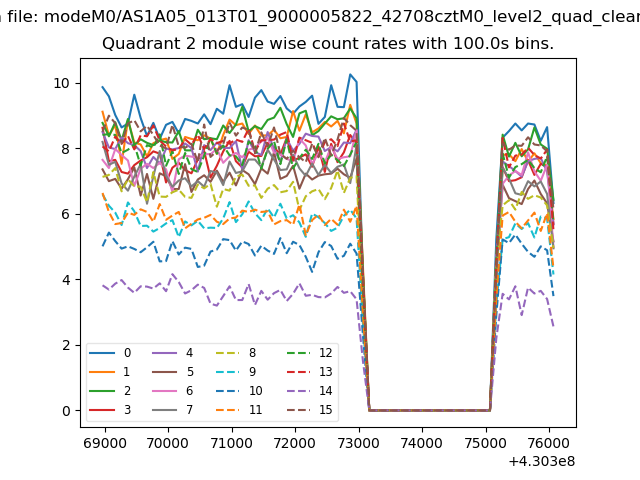
| Module-wise count rates for Quadrant C Data is divided into 100 sec bins |
 |
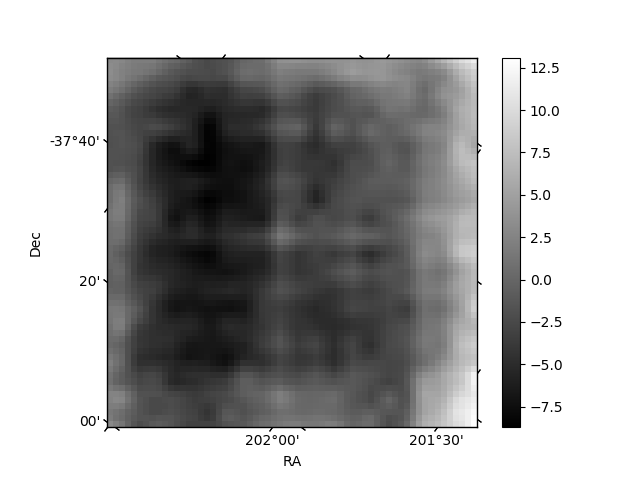 |
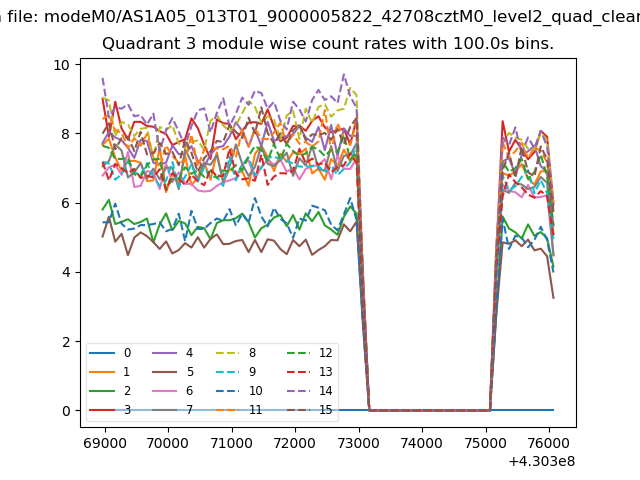
| Module-wise count rates for Quadrant D Data is divided into 100 sec bins |
 |
 |
| Parameter | Plot |
|---|---|
| CZT HV Monitor |  |
| D_VDD | 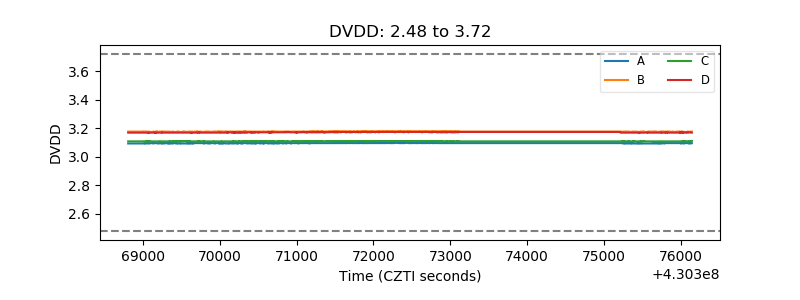 |
| Temperature 1 | 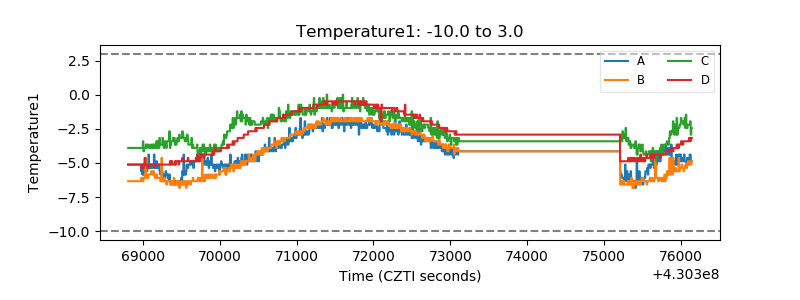 |
| Veto HV Monitor | 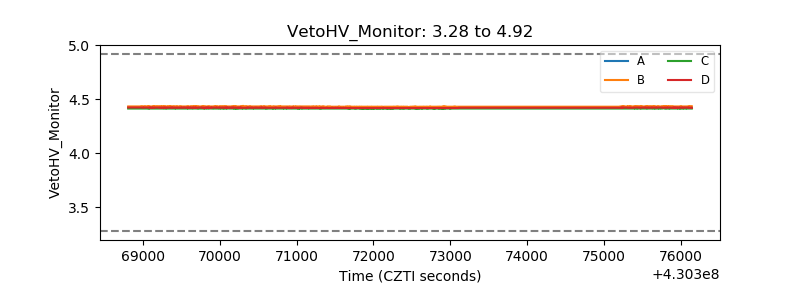 |
| Veto LLD | 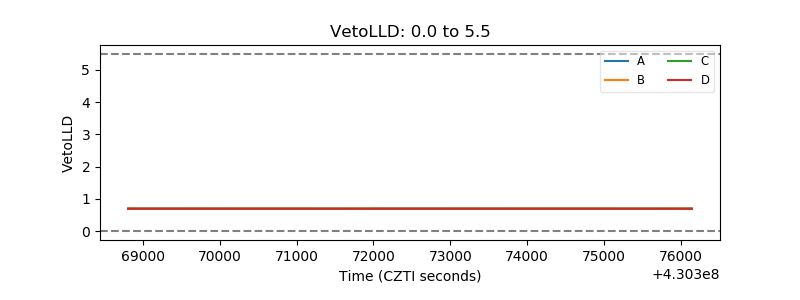 |
| Alpha Counter | 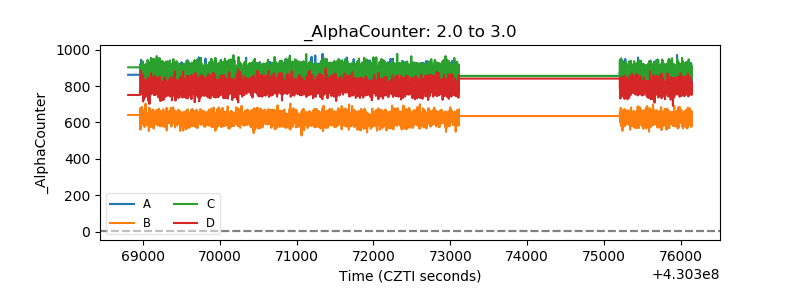 |
| _CPM_Rate | 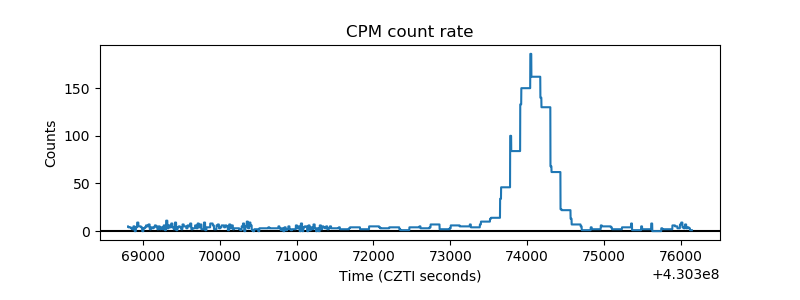 |
| CZT Counter | 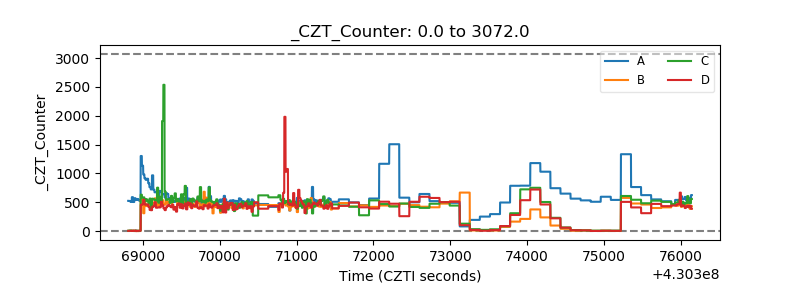 |
| +2.5 Volts monitor | 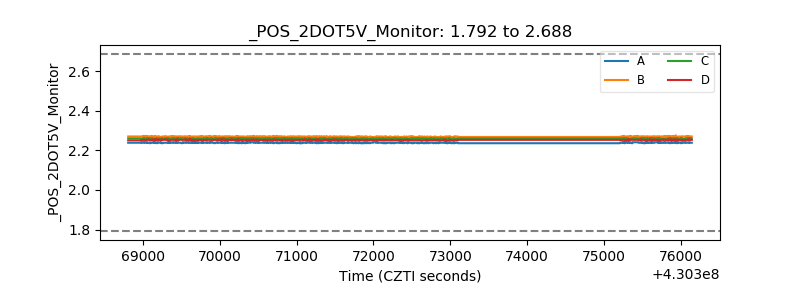 |
| +5 Volts monitor | 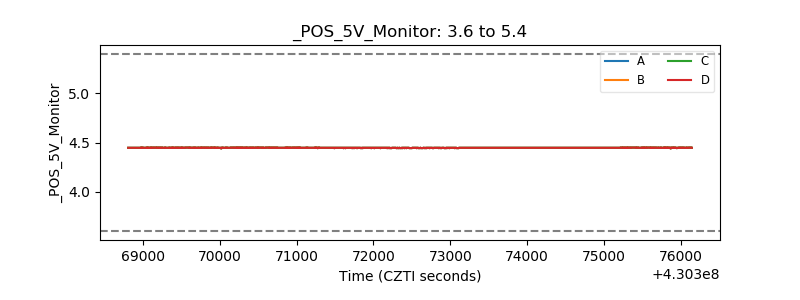 |
| _ROLL_ROT | 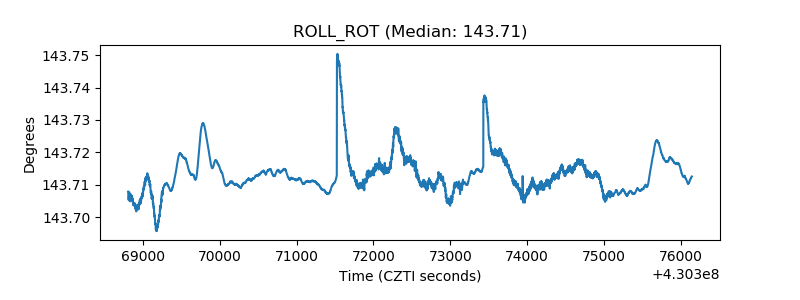 |
| _Roll_DEC | 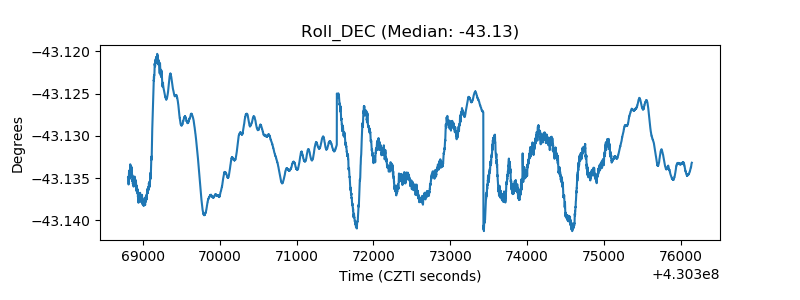 |
| _Roll_RA | 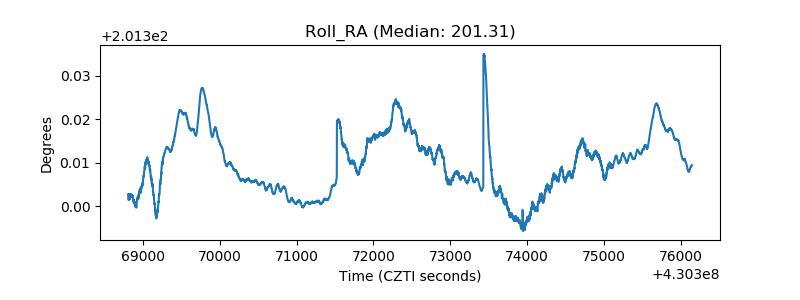 |
| Veto Counter | 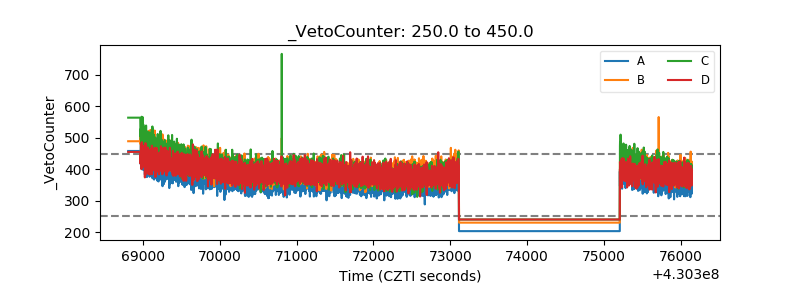 |