| Param | Original file | Final file |
|---|---|---|
| Filename | modeM0/AS1A05_013T01_9000005822_42709cztM0_level2.fits | modeM0/AS1A05_013T01_9000005822_42709cztM0_level2_quad_clean.evt |
| Size (bytes) | 303,050,880 | 87,635,520 |
| Size | 289.0 MB | 83.6 MB |
| Events in quadrant A | 2,917,126 | 589,068 |
| Events in quadrant B | 2,501,982 | 598,581 |
| Events in quadrant C | 2,661,889 | 573,841 |
| Events in quadrant D | 2,731,031 | 527,444 |
| Mode M0 | |||
|---|---|---|---|
| Quadrant | BADHDUFLAG | Total packets | Discarded packets |
| A | 0 | 11594 | 2 |
| B | 0 | 10946 | 2 |
| C | 0 | 11021 | 2 |
| D | 0 | 11701 | 2 |
| Mode M9 | |||
|---|---|---|---|
| Quadrant | BADHDUFLAG | Total packets | Discarded packets |
| A | 0 | 34 | 0 |
| B | 0 | 35 | 0 |
| C | 0 | 35 | 0 |
| D | 0 | 35 | 0 |
| Mode SS | |||
|---|---|---|---|
| Quadrant | BADHDUFLAG | Total packets | Discarded packets |
| A | 0 | 106 | 0 |
| B | 0 | 106 | 0 |
| C | 0 | 106 | 0 |
| D | 0 | 106 | 0 |
| Quadrant | Total seconds | Saturated seconds | Saturation percentage |
|---|---|---|---|
| A | 5206 | 14 | 0.268920% |
| B | 5206 | 40 | 0.768344% |
| C | 5206 | 23 | 0.441798% |
| D | 5205 | 55 | 1.056676% |
Noise dominated data is calculated using 1-second bins in cleaned event files. If a bin has >2000 counts, and if more than 50% of those come from <1% of pixels, then it is considered to be noise-dominated and hence unusable.
| Quadrant | # 1 sec bins | Bins with >0 counts | Bins with >2000 counts | High rate bins dominated by noise | Noise dominated (total time) | Noise dominated (detector-on time) | Marked lightcurve |
|---|---|---|---|---|---|---|---|
| A | 7089 | 5207 | 2 | 2 | 0.03% | 0.04% | 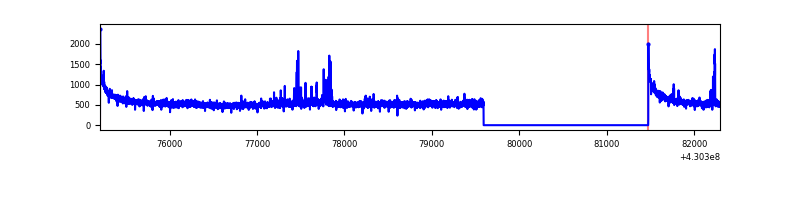 |
| B | 7089 | 5207 | 29 | 29 | 0.41% | 0.56% | 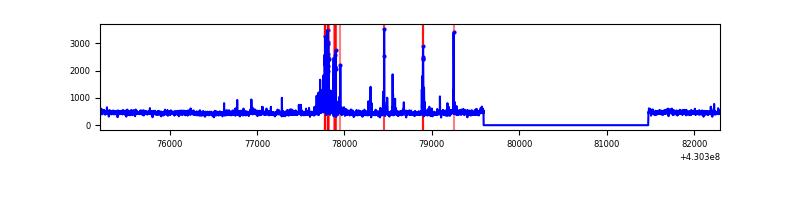 |
| C | 7089 | 5207 | 21 | 21 | 0.30% | 0.40% | 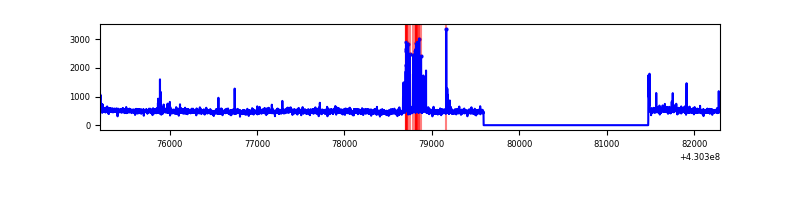 |
| D | 7088 | 5206 | 50 | 50 | 0.71% | 0.96% | 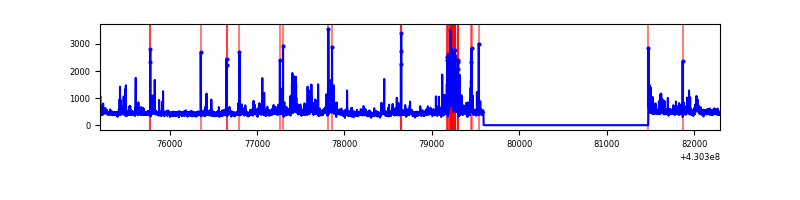 |
Top three noisy pixels from each quadrant. If the there are fewer than three noisy pixels in the level2.evt file, extra rows are filled as -1
| Pixel properties | Quadrant properties | ||||||
|---|---|---|---|---|---|---|---|
| Quadrant | DetID | PixID | Counts | Sigma | Mean | Median | Sigma |
| A | 10 | 83 | 585087 | 4844.51 | 582 | 570 | 120.7 |
| A | 0 | 230 | 41321 | 337.75 | 582 | 570 | 120.7 |
| A | 13 | 248 | 29158 | 236.94 | 582 | 570 | 120.7 |
| B | 15 | 32 | 70532 | 618.56 | 572 | 555 | 113.1 |
| B | 5 | 255 | 69289 | 607.58 | 572 | 555 | 113.1 |
| B | 15 | 85 | 36119 | 314.37 | 572 | 555 | 113.1 |
| C | 15 | 214 | 220795 | 1667.58 | 563 | 566 | 132.1 |
| C | 4 | 254 | 173283 | 1307.82 | 563 | 566 | 132.1 |
| C | 3 | 233 | 64317 | 482.72 | 563 | 566 | 132.1 |
| D | 2 | 249 | 217924 | 1589.06 | 564 | 548 | 136.8 |
| D | 1 | 52 | 87790 | 637.76 | 564 | 548 | 136.8 |
| D | 12 | 6 | 46302 | 334.47 | 564 | 548 | 136.8 |
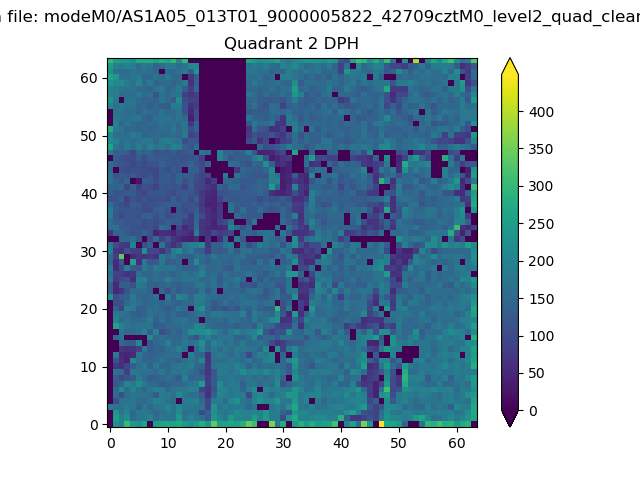
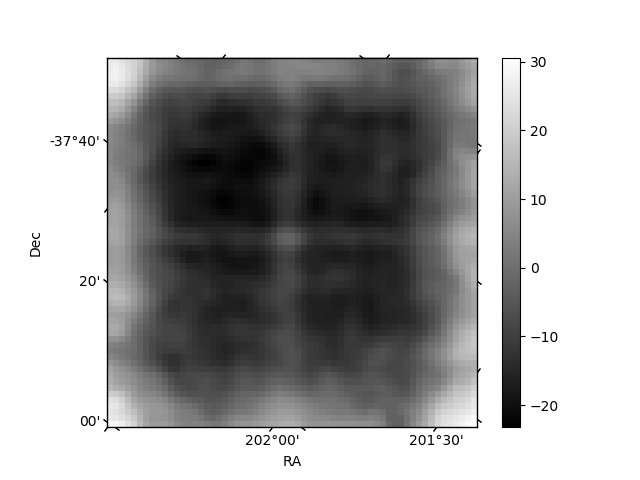
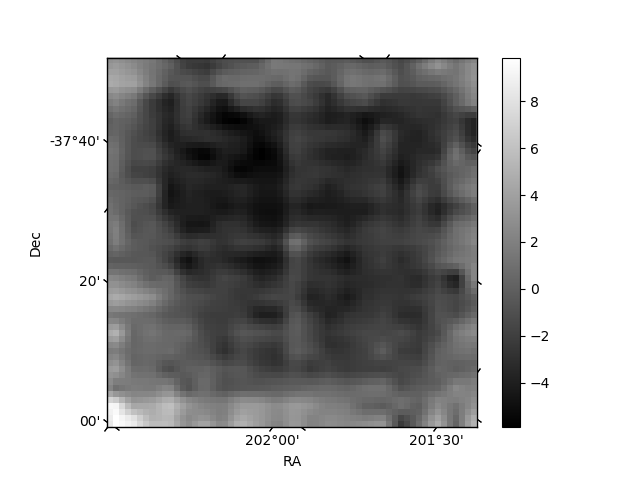
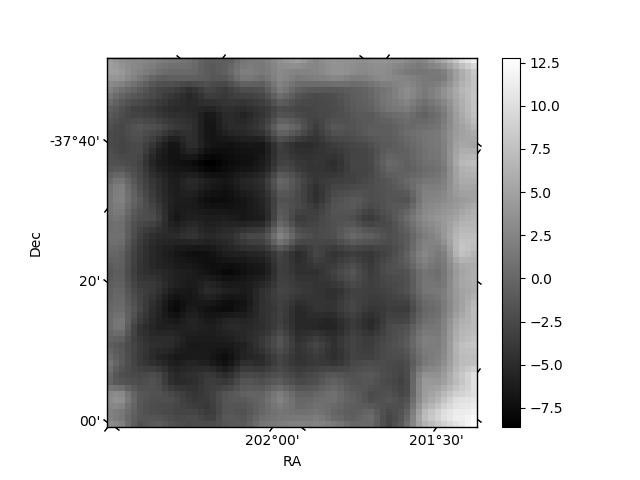
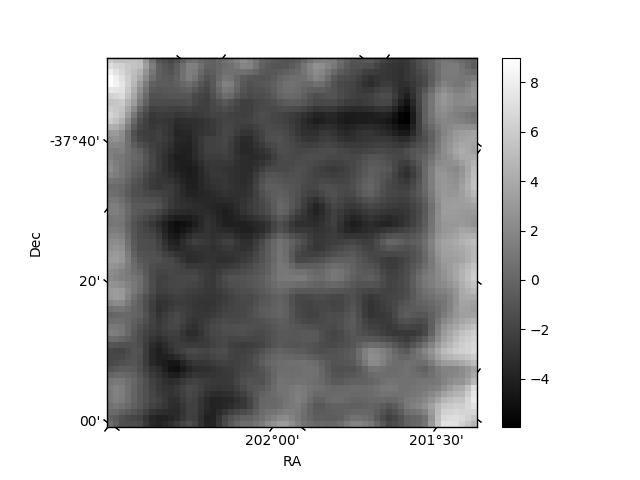
Histogram calculated using DETX and DETY for each event in the final _common_clean file
| Quadrant A | 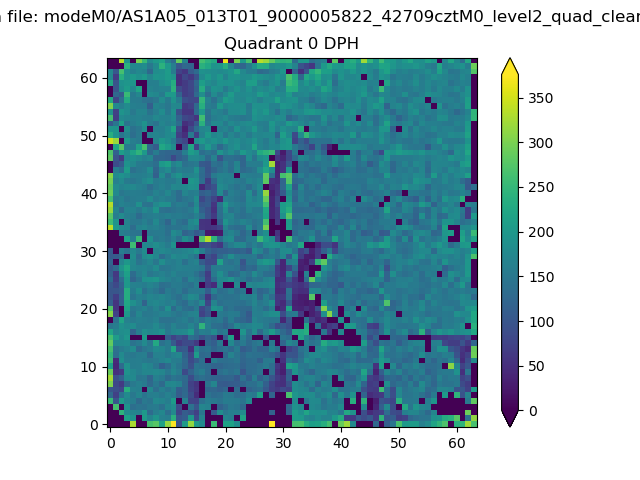 |
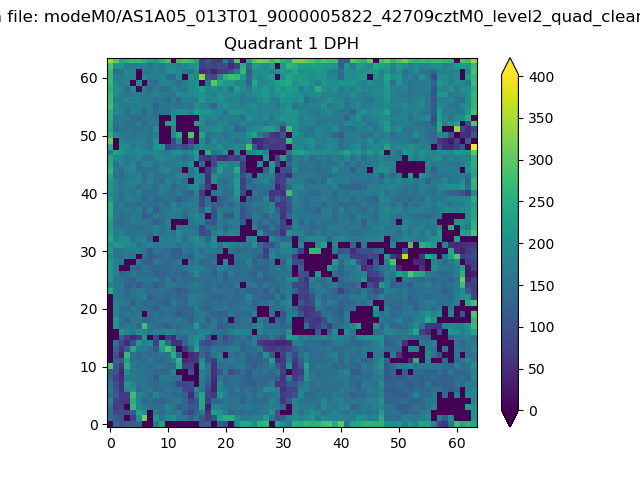 |
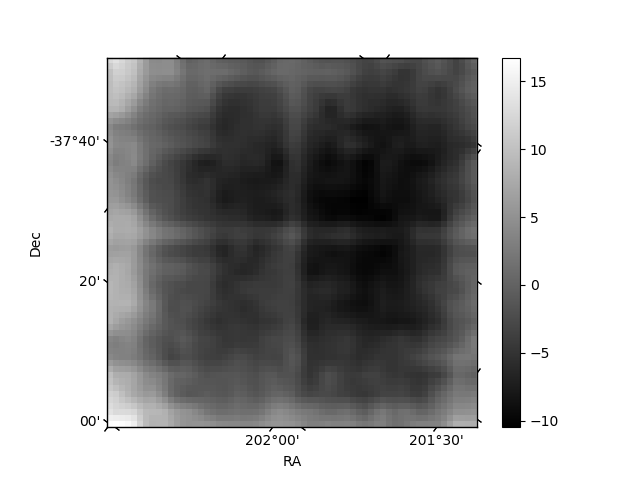
Quadrant B |
|---|---|---|---|
| Quadrant D | 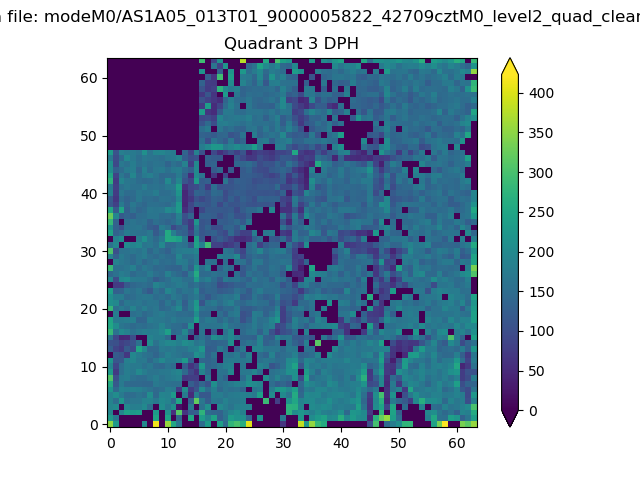 |
 |
Quadrant C |
| Plot type | Count rate plots | Images |
|---|---|---|
| Comparison with Poisson distribution Blue bars denote a histogram of data divided into 1 sec bins. Red curve is a Poisson curve with rate = median count rate of data. |
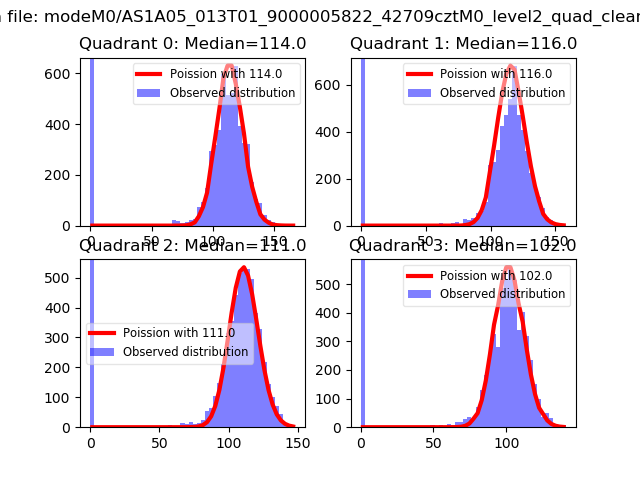 |
 |
| Quadrant-wise count rates Data is divided into 100 sec bins |
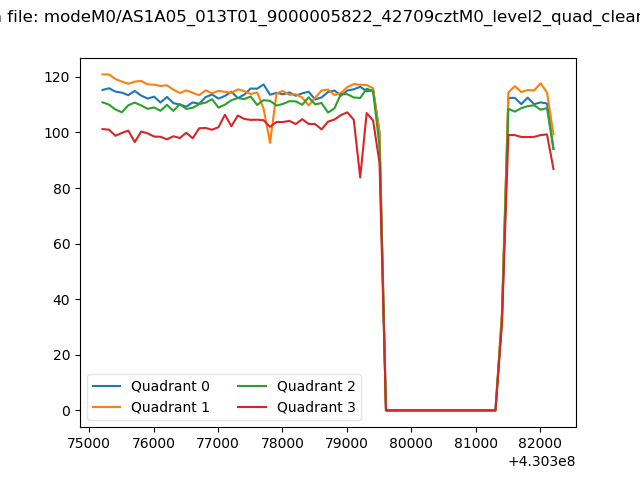 |
|
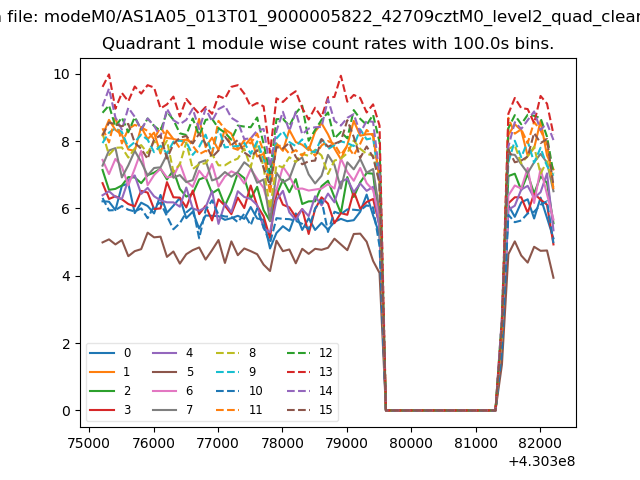
| Module-wise count rates for Quadrant A Data is divided into 100 sec bins |
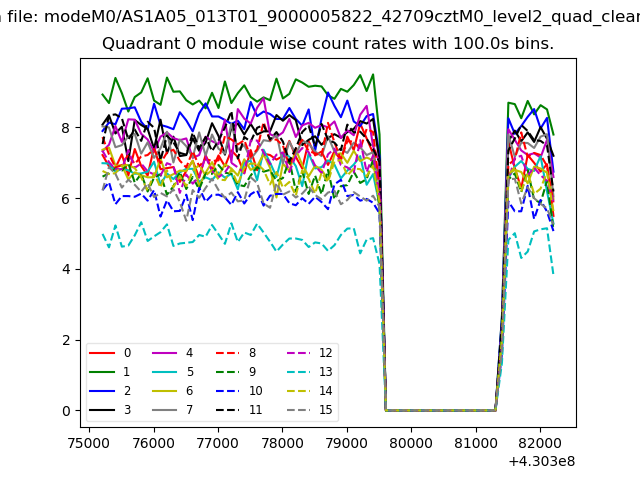 |
 |
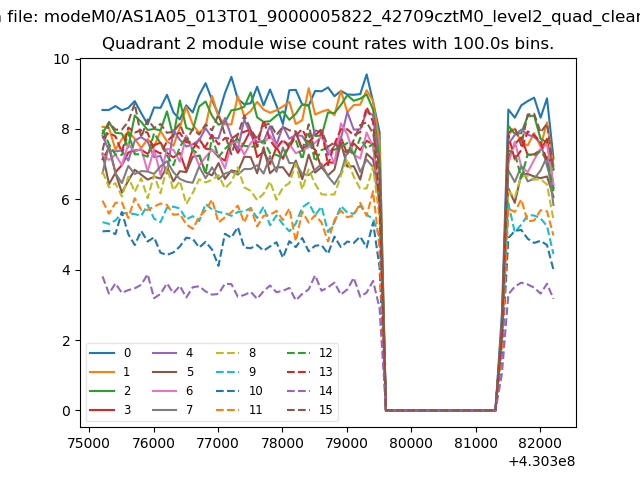
| Module-wise count rates for Quadrant B Data is divided into 100 sec bins |
 |
 |
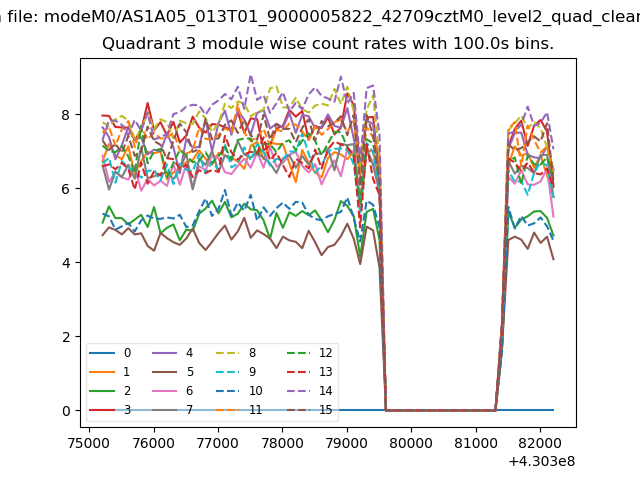
| Module-wise count rates for Quadrant C Data is divided into 100 sec bins |
 |
 |
| Module-wise count rates for Quadrant D Data is divided into 100 sec bins |
 |
 |
| Parameter | Plot |
|---|---|
| CZT HV Monitor | 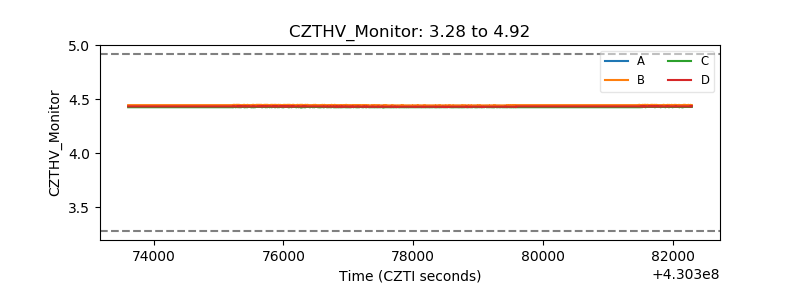 |
| D_VDD | 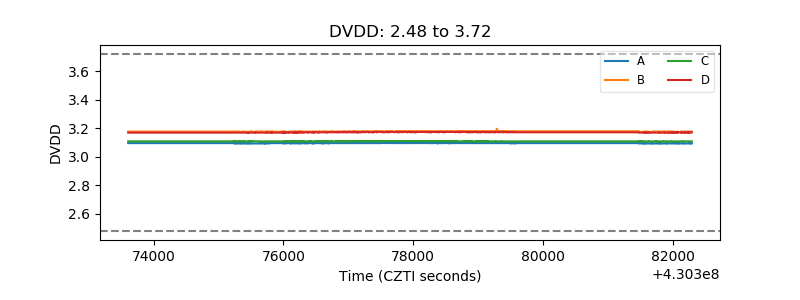 |
| Temperature 1 | 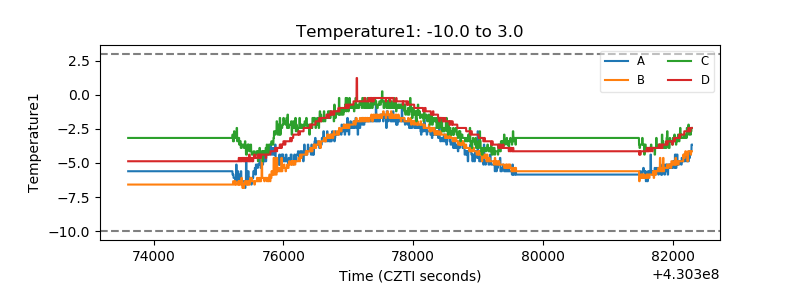 |
| Veto HV Monitor | 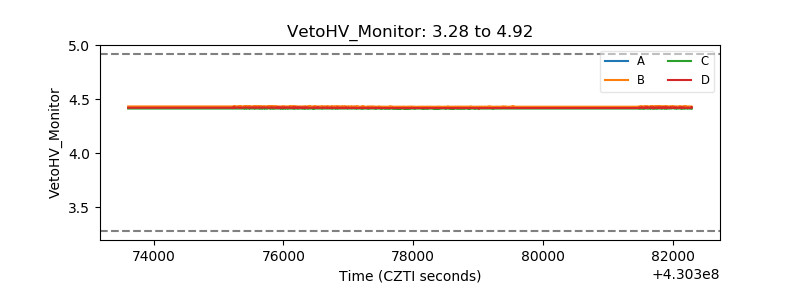 |
| Veto LLD | 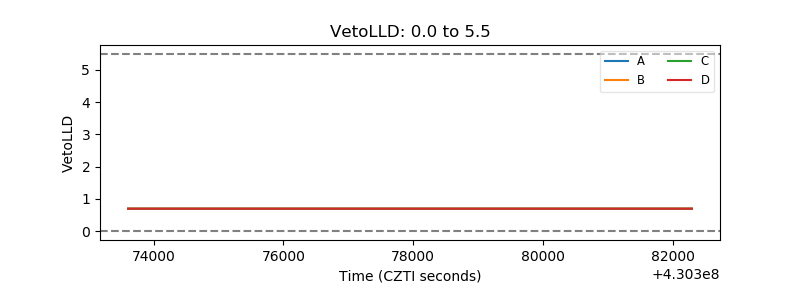 |
| Alpha Counter | 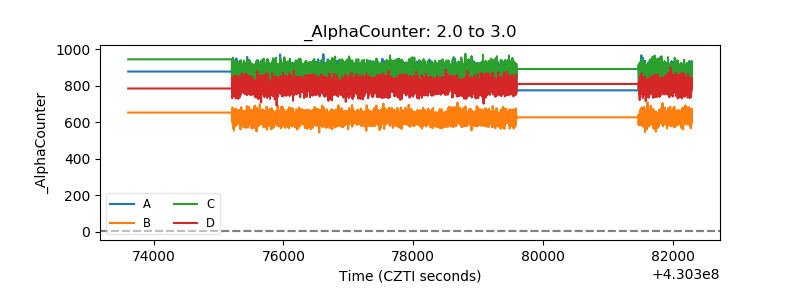 |
| _CPM_Rate | 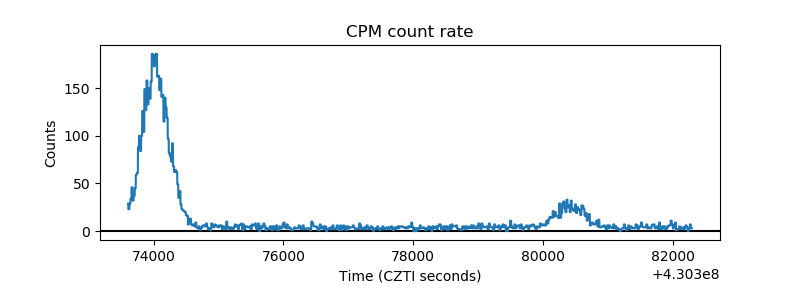 |
| CZT Counter | 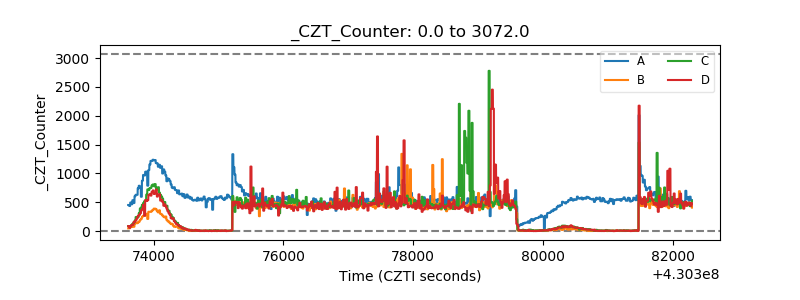 |
| +2.5 Volts monitor | 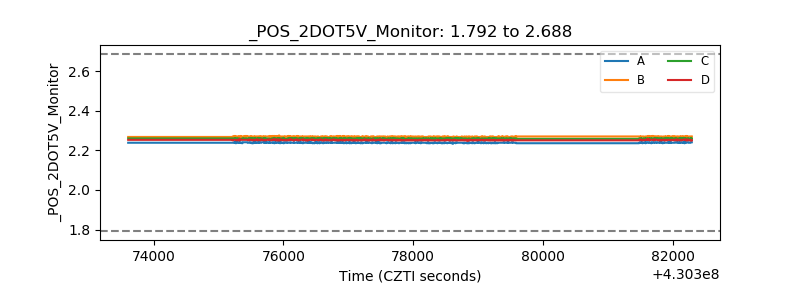 |
| +5 Volts monitor | 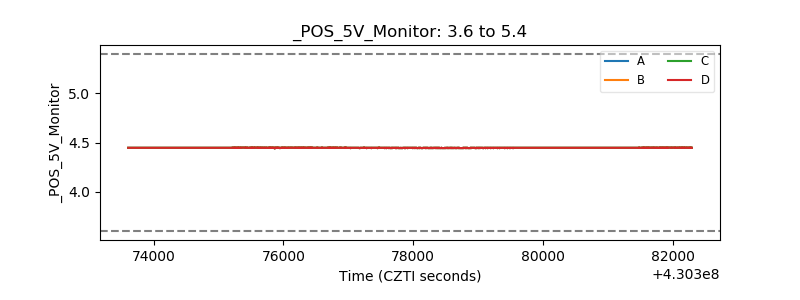 |
| _ROLL_ROT | 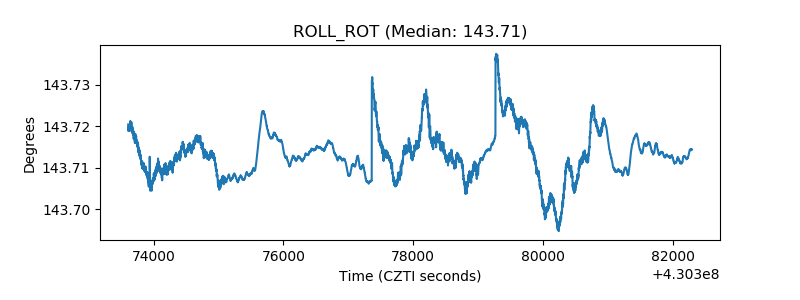 |
| _Roll_DEC | 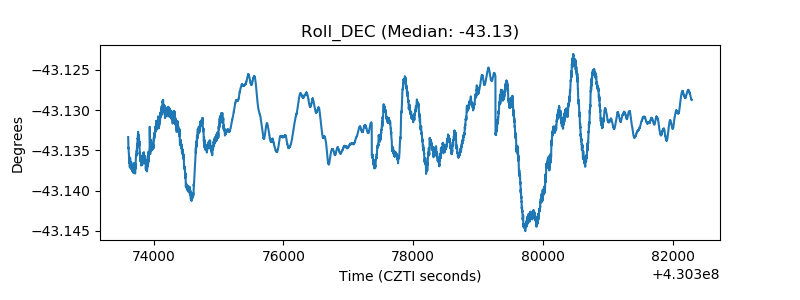 |
| _Roll_RA | 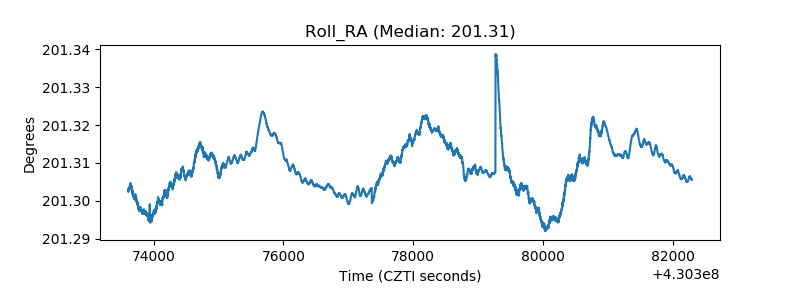 |
| Veto Counter | 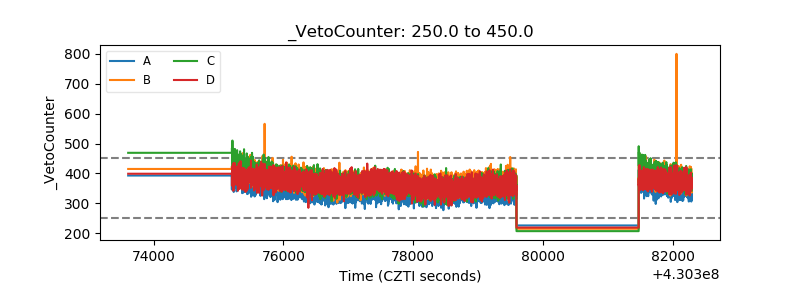 |