| Param | Original file | Final file |
|---|---|---|
| Filename | modeM0/AS1A05_013T01_9000005822_42710cztM0_level2.fits | modeM0/AS1A05_013T01_9000005822_42710cztM0_level2_quad_clean.evt |
| Size (bytes) | 350,608,320 | 96,209,280 |
| Size | 334.4 MB | 91.8 MB |
| Events in quadrant A | 3,159,009 | 645,365 |
| Events in quadrant B | 2,721,593 | 653,486 |
| Events in quadrant C | 2,961,976 | 632,088 |
| Events in quadrant D | 3,683,773 | 576,479 |
| Mode M0 | |||
|---|---|---|---|
| Quadrant | BADHDUFLAG | Total packets | Discarded packets |
| A | 0 | 12692 | 2 |
| B | 0 | 12083 | 2 |
| C | 0 | 12435 | 2 |
| D | 0 | 14937 | 2 |
| Mode M9 | |||
|---|---|---|---|
| Quadrant | BADHDUFLAG | Total packets | Discarded packets |
| A | 0 | 22 | 0 |
| B | 0 | 23 | 0 |
| C | 0 | 23 | 0 |
| D | 0 | 23 | 0 |
| Mode SS | |||
|---|---|---|---|
| Quadrant | BADHDUFLAG | Total packets | Discarded packets |
| A | 0 | 118 | 0 |
| B | 0 | 118 | 0 |
| C | 0 | 118 | 0 |
| D | 0 | 118 | 0 |
| Quadrant | Total seconds | Saturated seconds | Saturation percentage |
|---|---|---|---|
| A | 5806 | 16 | 0.275577% |
| B | 5806 | 34 | 0.585601% |
| C | 5806 | 24 | 0.413365% |
| D | 5806 | 138 | 2.376852% |
Noise dominated data is calculated using 1-second bins in cleaned event files. If a bin has >2000 counts, and if more than 50% of those come from <1% of pixels, then it is considered to be noise-dominated and hence unusable.
| Quadrant | # 1 sec bins | Bins with >0 counts | Bins with >2000 counts | High rate bins dominated by noise | Noise dominated (total time) | Noise dominated (detector-on time) | Marked lightcurve |
|---|---|---|---|---|---|---|---|
| A | 7328 | 5807 | 6 | 6 | 0.08% | 0.10% | 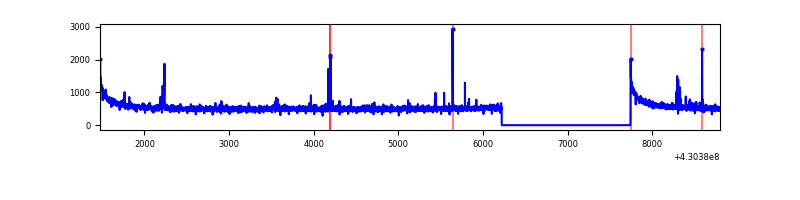 |
| B | 7328 | 5807 | 24 | 24 | 0.33% | 0.41% | 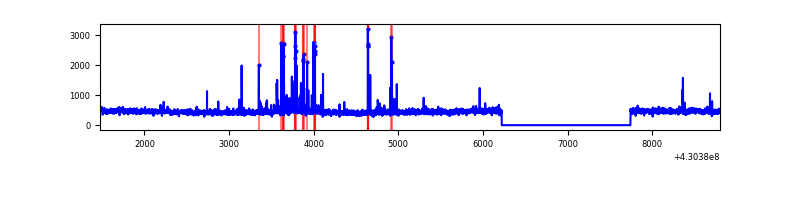 |
| C | 7328 | 5807 | 16 | 16 | 0.22% | 0.28% | 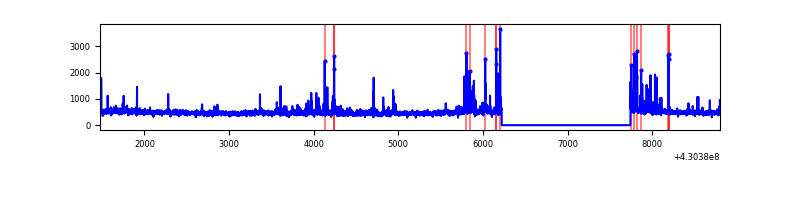 |
| D | 7328 | 5807 | 139 | 139 | 1.90% | 2.39% | 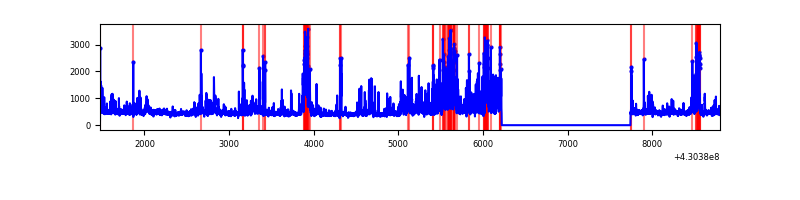 |
Top three noisy pixels from each quadrant. If the there are fewer than three noisy pixels in the level2.evt file, extra rows are filled as -1
| Pixel properties | Quadrant properties | ||||||
|---|---|---|---|---|---|---|---|
| Quadrant | DetID | PixID | Counts | Sigma | Mean | Median | Sigma |
| A | 10 | 83 | 615156 | 4670.37 | 643 | 629 | 131.6 |
| A | 13 | 248 | 39809 | 297.77 | 643 | 629 | 131.6 |
| A | 2 | 79 | 9119 | 64.52 | 643 | 629 | 131.6 |
| B | 15 | 32 | 66000 | 526.08 | 633 | 614 | 124.3 |
| B | 15 | 85 | 45173 | 358.51 | 633 | 614 | 124.3 |
| B | 5 | 172 | 35951 | 284.31 | 633 | 614 | 124.3 |
| C | 15 | 214 | 244551 | 1677.77 | 621 | 625 | 145.4 |
| C | 4 | 254 | 222047 | 1522.98 | 621 | 625 | 145.4 |
| C | 3 | 233 | 57048 | 388.09 | 621 | 625 | 145.4 |
| D | 1 | 52 | 797558 | 5236.84 | 621 | 604 | 152.2 |
| D | 2 | 249 | 199572 | 1307.43 | 621 | 604 | 152.2 |
| D | 5 | 171 | 53103 | 344.97 | 621 | 604 | 152.2 |
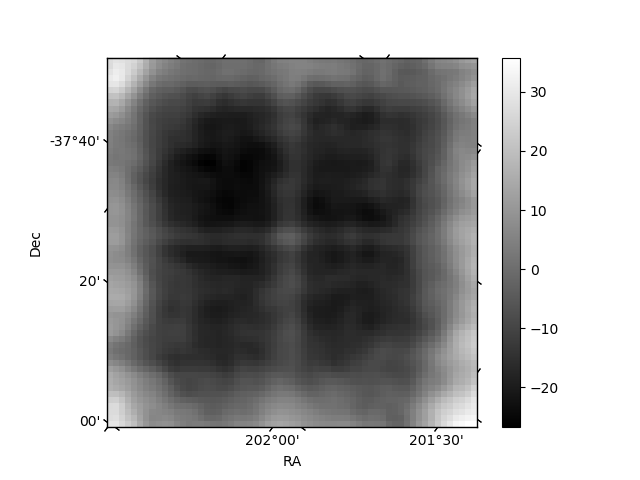
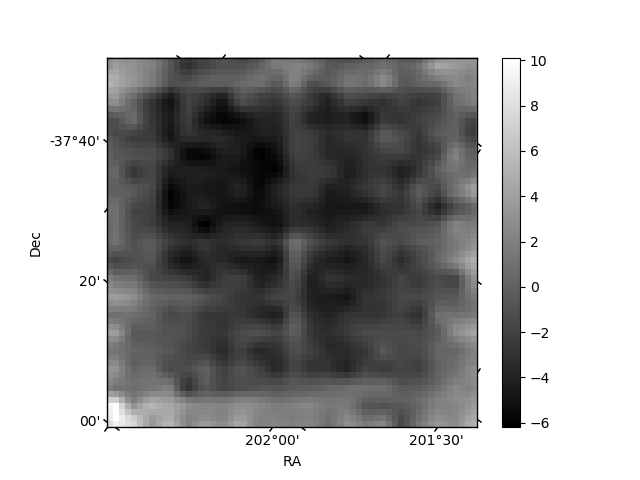
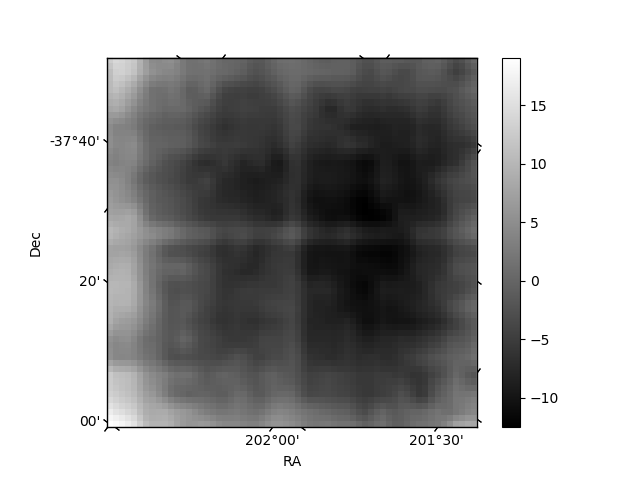
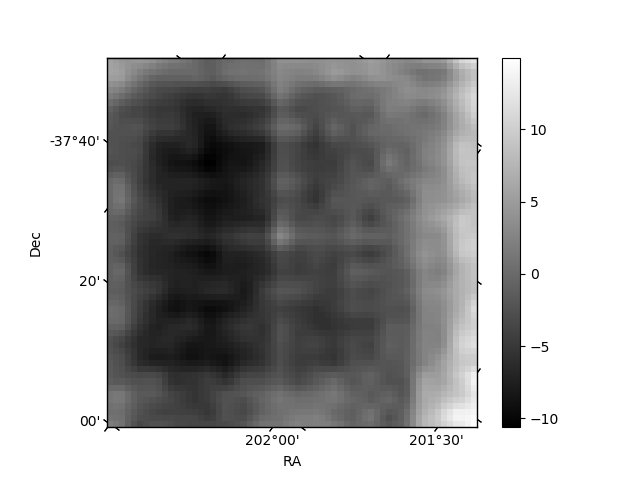
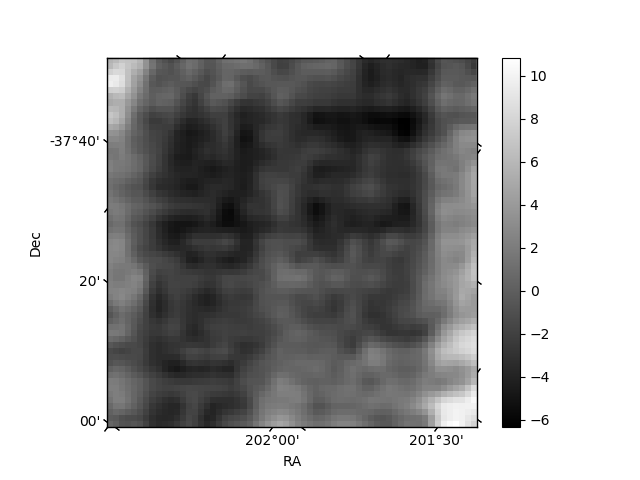
Histogram calculated using DETX and DETY for each event in the final _common_clean file
| Quadrant A | 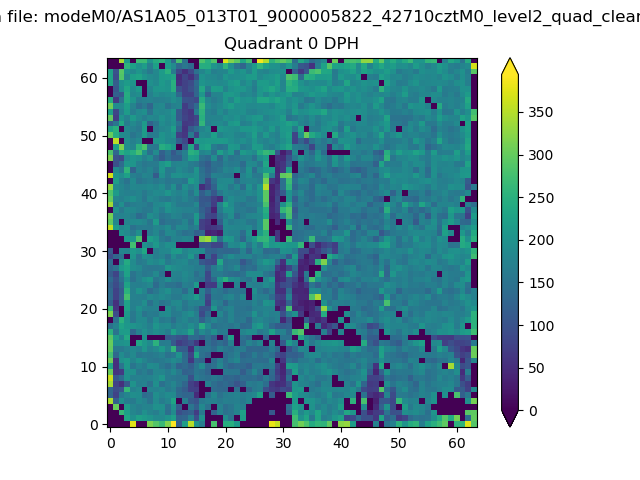 |
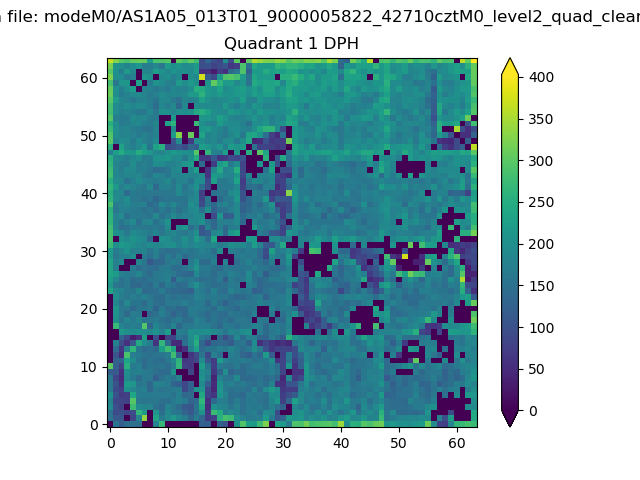 |
Quadrant B |
|---|---|---|---|
| Quadrant D | 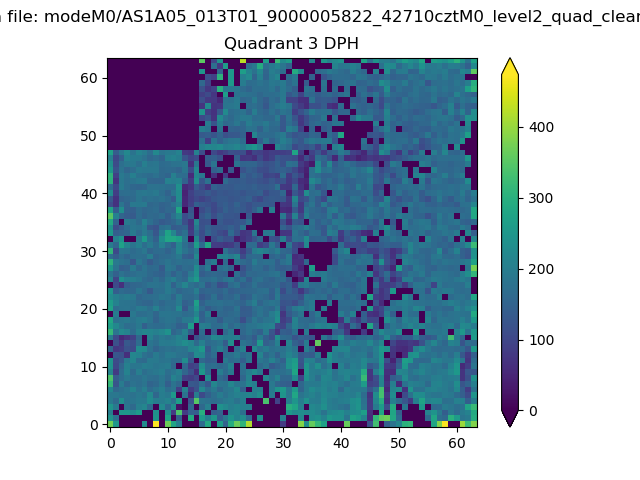 |
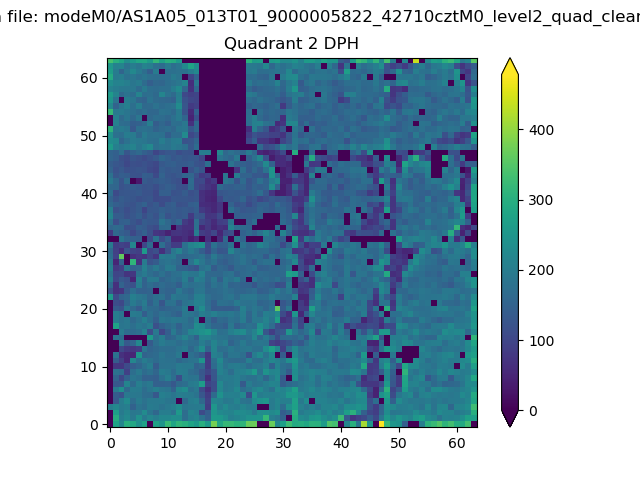 |
Quadrant C |
| Plot type | Count rate plots | Images |
|---|---|---|
| Comparison with Poisson distribution Blue bars denote a histogram of data divided into 1 sec bins. Red curve is a Poisson curve with rate = median count rate of data. |
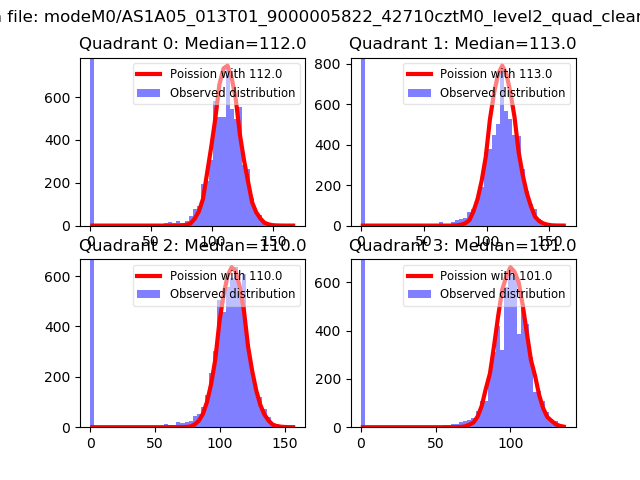 |
 |
| Quadrant-wise count rates Data is divided into 100 sec bins |
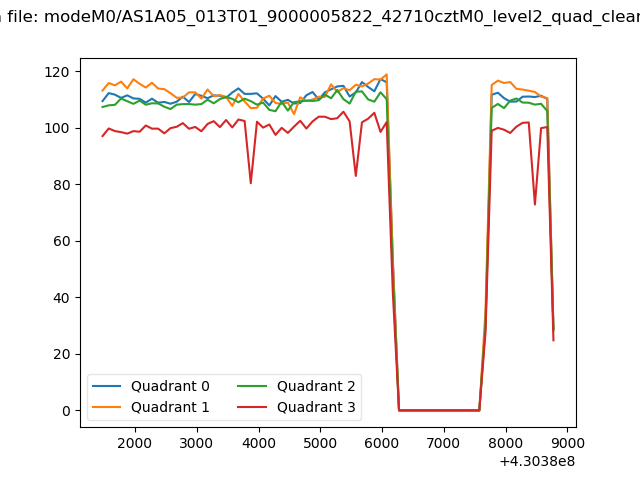 |
|
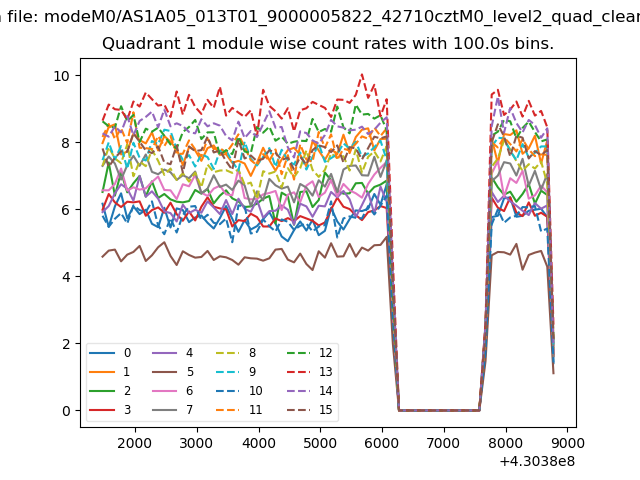
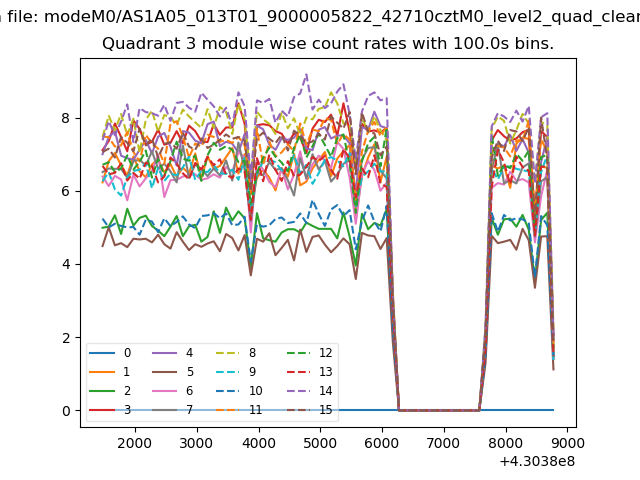
| Module-wise count rates for Quadrant A Data is divided into 100 sec bins |
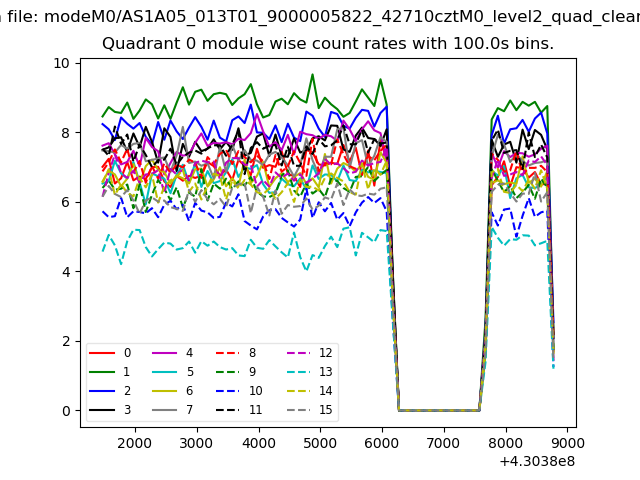 |
 |
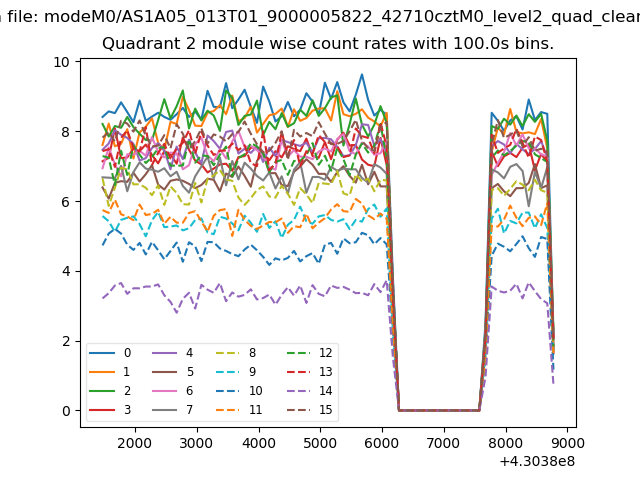
| Module-wise count rates for Quadrant B Data is divided into 100 sec bins |
 |
 |
| Module-wise count rates for Quadrant C Data is divided into 100 sec bins |
 |
 |
| Module-wise count rates for Quadrant D Data is divided into 100 sec bins |
 |
 |
| Parameter | Plot |
|---|---|
| CZT HV Monitor | 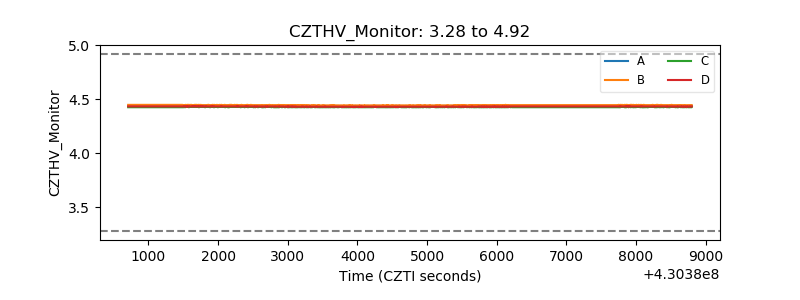 |
| D_VDD | 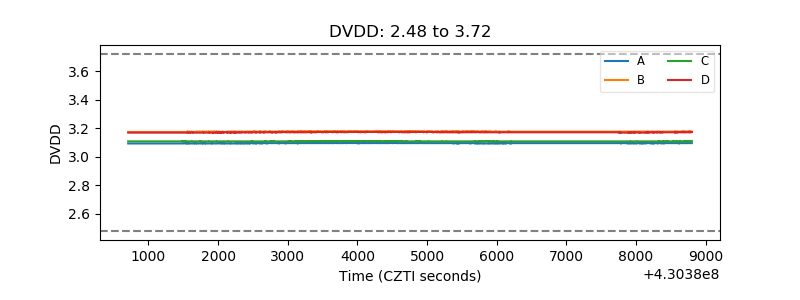 |
| Temperature 1 | 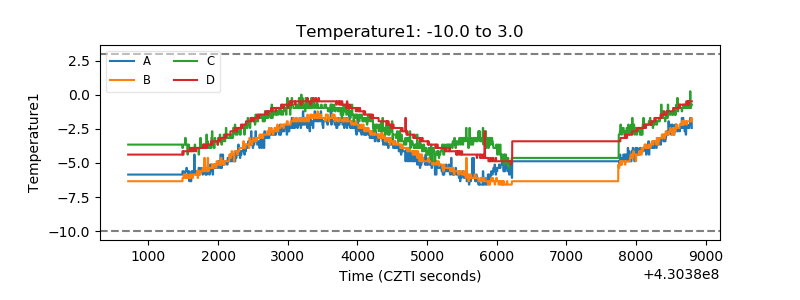 |
| Veto HV Monitor | 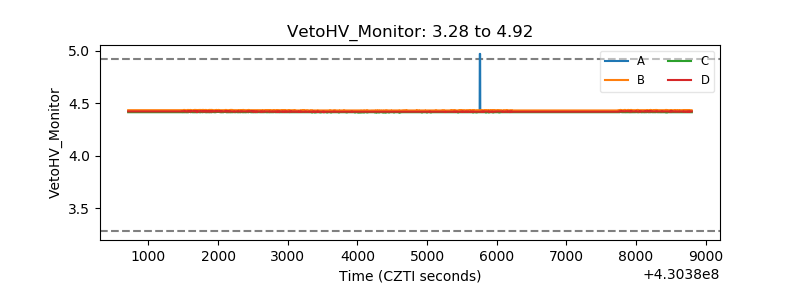 |
| Veto LLD | 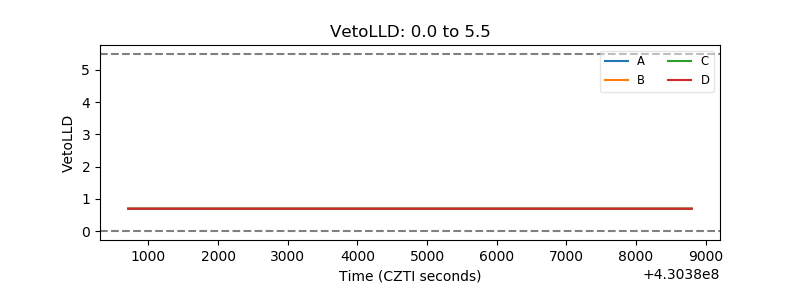 |
| Alpha Counter | 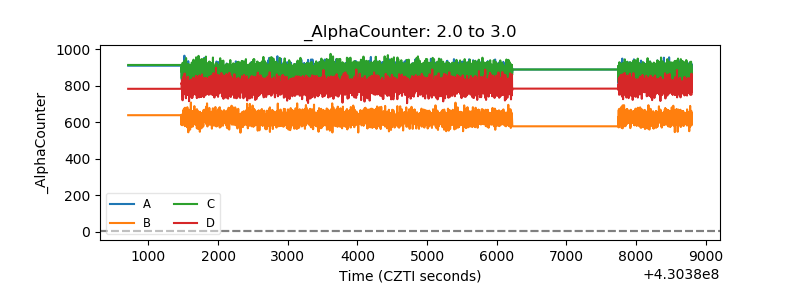 |
| _CPM_Rate | 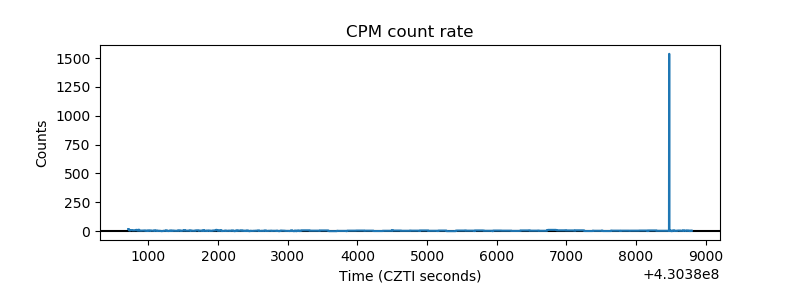 |
| CZT Counter | 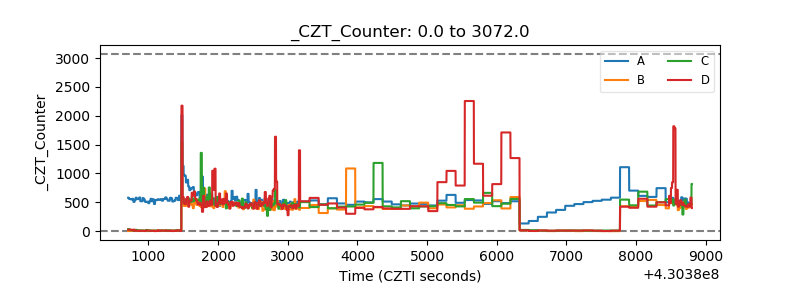 |
| +2.5 Volts monitor | 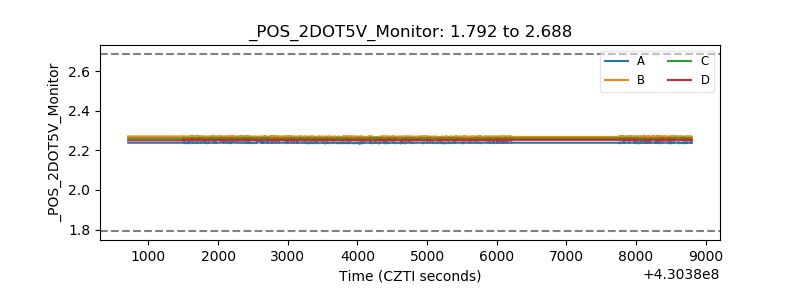 |
| +5 Volts monitor | 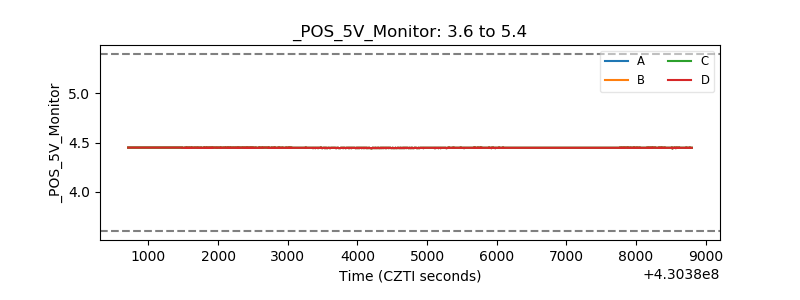 |
| _ROLL_ROT | 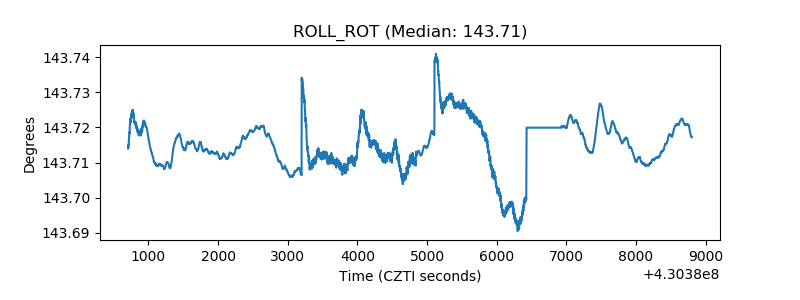 |
| _Roll_DEC | 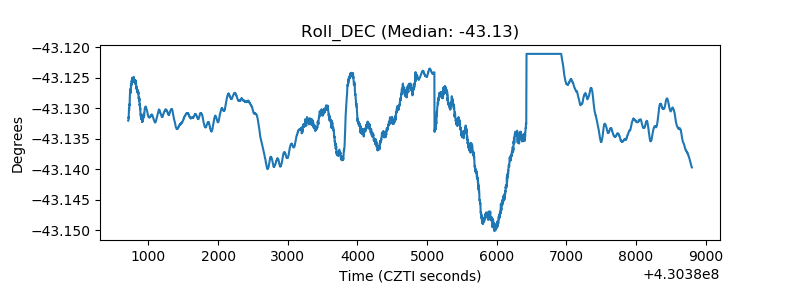 |
| _Roll_RA | 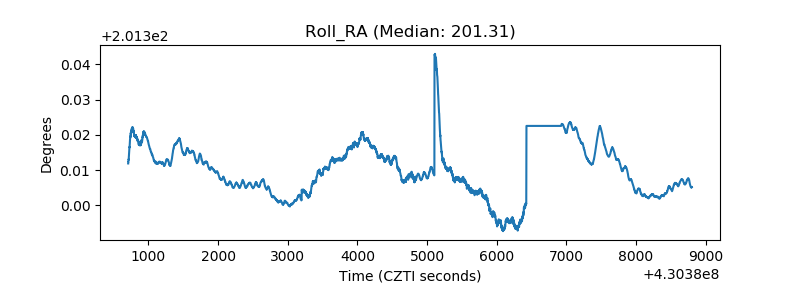 |
| Veto Counter | 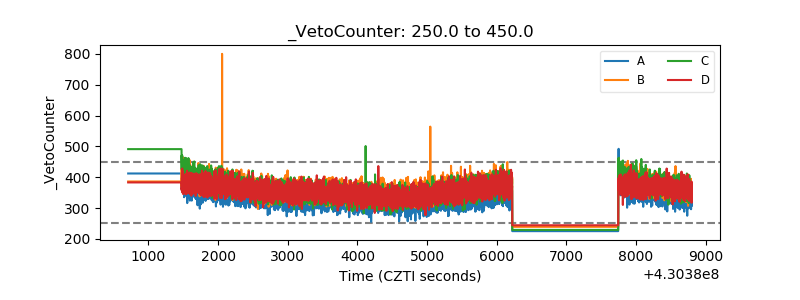 |