| Param | Original file | Final file |
|---|---|---|
| Filename | modeM0/AS1A05_013T01_9000005822_42711cztM0_level2.fits | modeM0/AS1A05_013T01_9000005822_42711cztM0_level2_quad_clean.evt |
| Size (bytes) | 363,412,800 | 96,952,320 |
| Size | 346.6 MB | 92.5 MB |
| Events in quadrant A | 3,252,642 | 651,321 |
| Events in quadrant B | 2,717,717 | 657,751 |
| Events in quadrant C | 3,108,177 | 635,119 |
| Events in quadrant D | 3,915,296 | 579,668 |
| Mode M0 | |||
|---|---|---|---|
| Quadrant | BADHDUFLAG | Total packets | Discarded packets |
| A | 0 | 13047 | 2 |
| B | 0 | 12120 | 2 |
| C | 0 | 12934 | 2 |
| D | 0 | 15605 | 2 |
| Mode M9 | |||
|---|---|---|---|
| Quadrant | BADHDUFLAG | Total packets | Discarded packets |
| A | 0 | 20 | 0 |
| B | 0 | 21 | 0 |
| C | 0 | 21 | 0 |
| D | 0 | 21 | 0 |
| Mode SS | |||
|---|---|---|---|
| Quadrant | BADHDUFLAG | Total packets | Discarded packets |
| A | 0 | 120 | 0 |
| B | 0 | 120 | 0 |
| C | 0 | 120 | 0 |
| D | 0 | 120 | 0 |
| Quadrant | Total seconds | Saturated seconds | Saturation percentage |
|---|---|---|---|
| A | 5891 | 20 | 0.339501% |
| B | 5891 | 13 | 0.220676% |
| C | 5891 | 41 | 0.695977% |
| D | 5891 | 141 | 2.393482% |
Noise dominated data is calculated using 1-second bins in cleaned event files. If a bin has >2000 counts, and if more than 50% of those come from <1% of pixels, then it is considered to be noise-dominated and hence unusable.
| Quadrant | # 1 sec bins | Bins with >0 counts | Bins with >2000 counts | High rate bins dominated by noise | Noise dominated (total time) | Noise dominated (detector-on time) | Marked lightcurve |
|---|---|---|---|---|---|---|---|
| A | 7204 | 5892 | 11 | 11 | 0.15% | 0.19% | 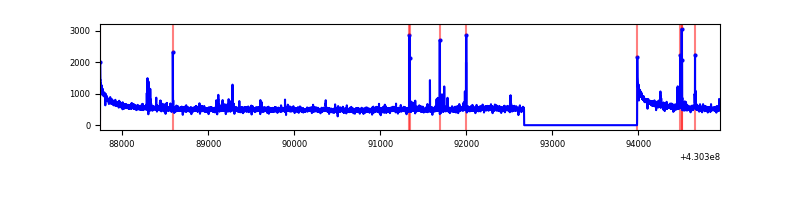 |
| B | 7204 | 5892 | 11 | 11 | 0.15% | 0.19% | 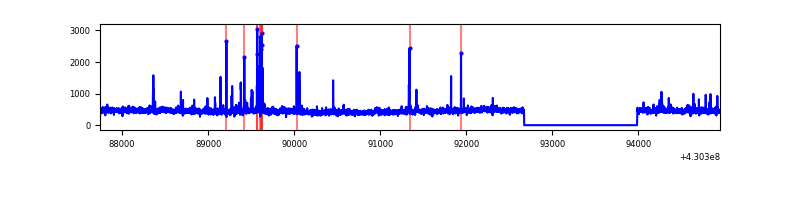 |
| C | 7204 | 5892 | 37 | 37 | 0.51% | 0.63% | 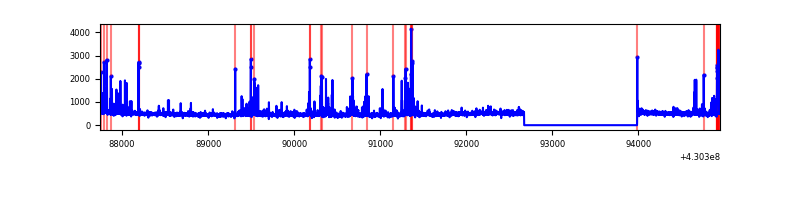 |
| D | 7204 | 5892 | 130 | 130 | 1.80% | 2.21% | 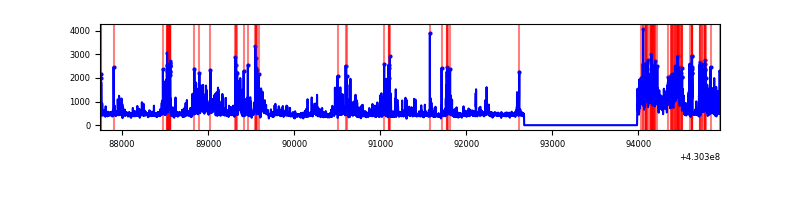 |
Top three noisy pixels from each quadrant. If the there are fewer than three noisy pixels in the level2.evt file, extra rows are filled as -1
| Pixel properties | Quadrant properties | ||||||
|---|---|---|---|---|---|---|---|
| Quadrant | DetID | PixID | Counts | Sigma | Mean | Median | Sigma |
| A | 10 | 83 | 641073 | 4749.88 | 651 | 635 | 134.8 |
| A | 13 | 248 | 64210 | 471.51 | 651 | 635 | 134.8 |
| A | 15 | 237 | 23752 | 171.45 | 651 | 635 | 134.8 |
| B | 15 | 32 | 41605 | 325.88 | 642 | 624 | 125.8 |
| B | 0 | 229 | 37076 | 289.87 | 642 | 624 | 125.8 |
| B | 5 | 255 | 32397 | 252.66 | 642 | 624 | 125.8 |
| C | 4 | 254 | 367168 | 2500.28 | 629 | 634 | 146.6 |
| C | 15 | 214 | 246171 | 1674.91 | 629 | 634 | 146.6 |
| C | 3 | 233 | 25482 | 169.5 | 629 | 634 | 146.6 |
| D | 2 | 249 | 762223 | 4892.04 | 631 | 611 | 155.7 |
| D | 1 | 47 | 174027 | 1113.9 | 631 | 611 | 155.7 |
| D | 1 | 52 | 140602 | 899.2 | 631 | 611 | 155.7 |
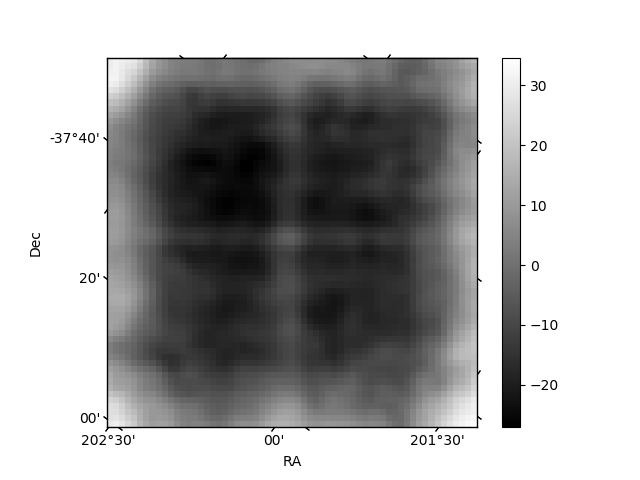
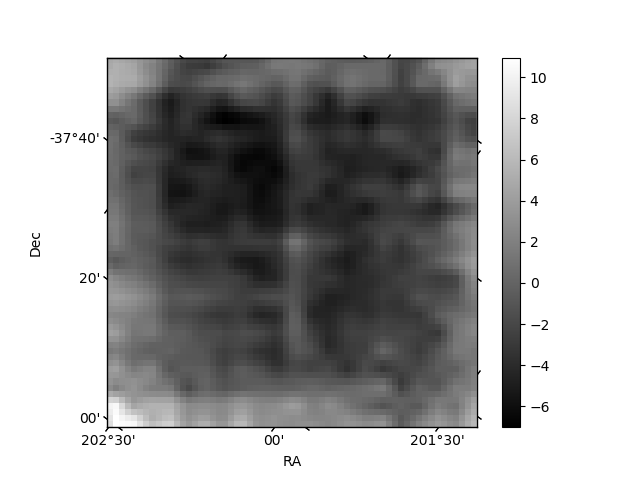
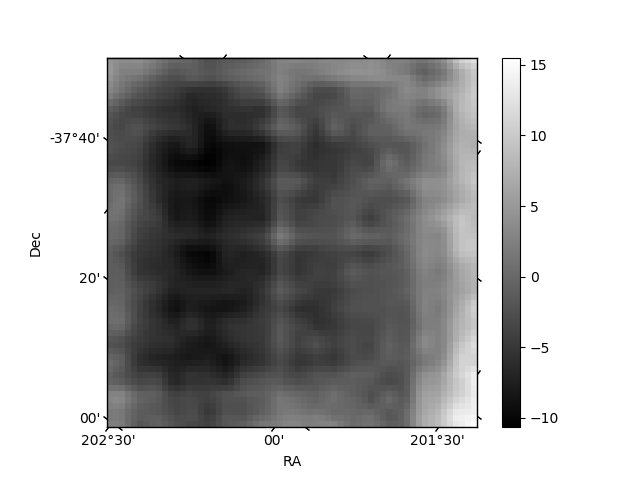
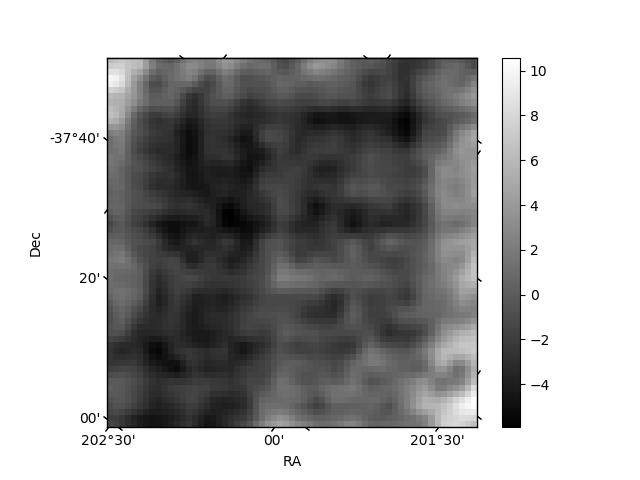
Histogram calculated using DETX and DETY for each event in the final _common_clean file
| Quadrant A | 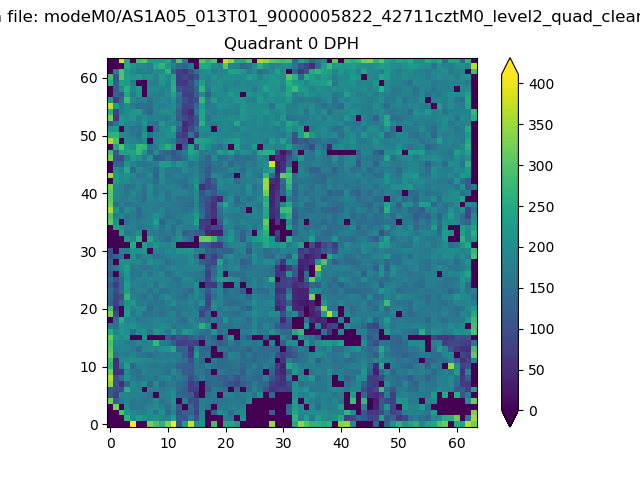 |
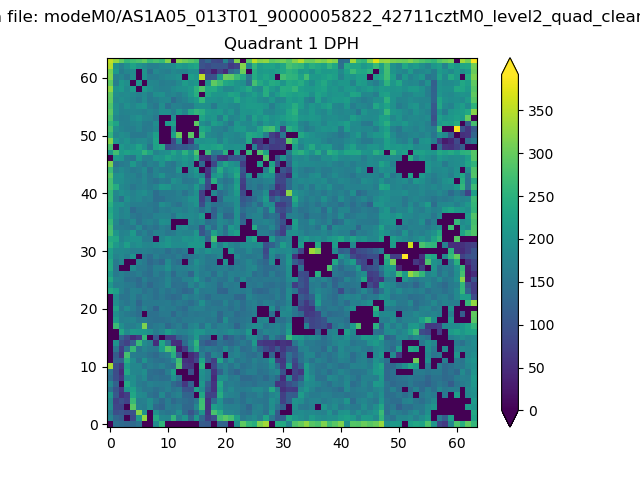 |
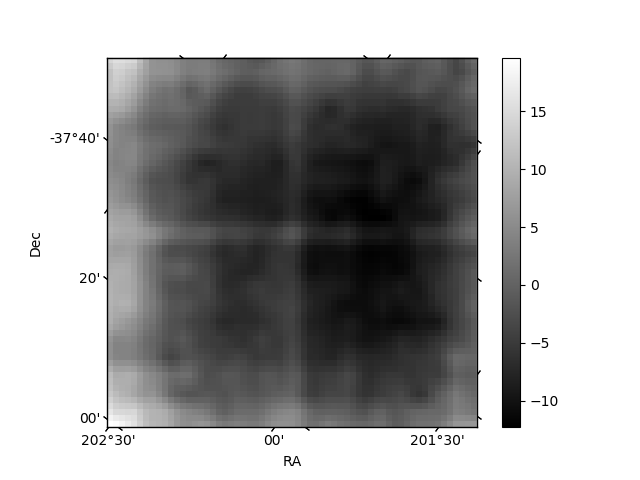
Quadrant B |
|---|---|---|---|
| Quadrant D | 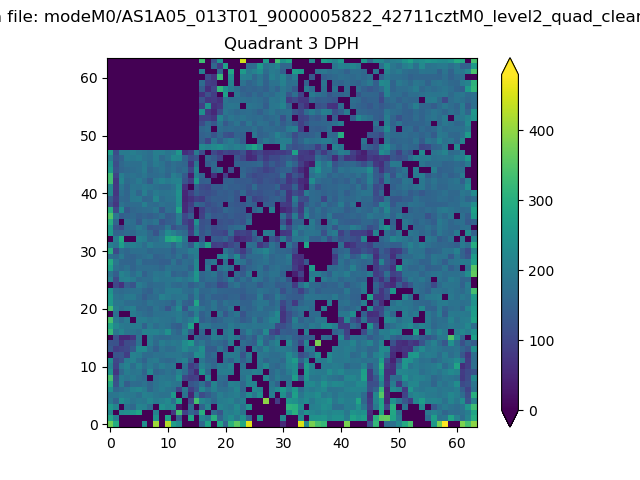 |
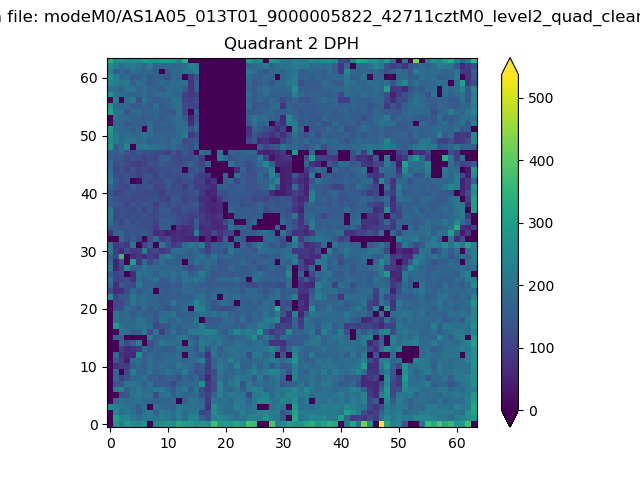 |
Quadrant C |
| Plot type | Count rate plots | Images |
|---|---|---|
| Comparison with Poisson distribution Blue bars denote a histogram of data divided into 1 sec bins. Red curve is a Poisson curve with rate = median count rate of data. |
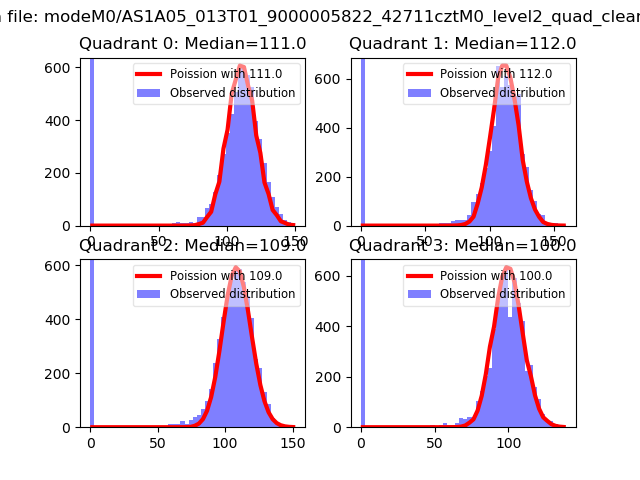 |
 |
| Quadrant-wise count rates Data is divided into 100 sec bins |
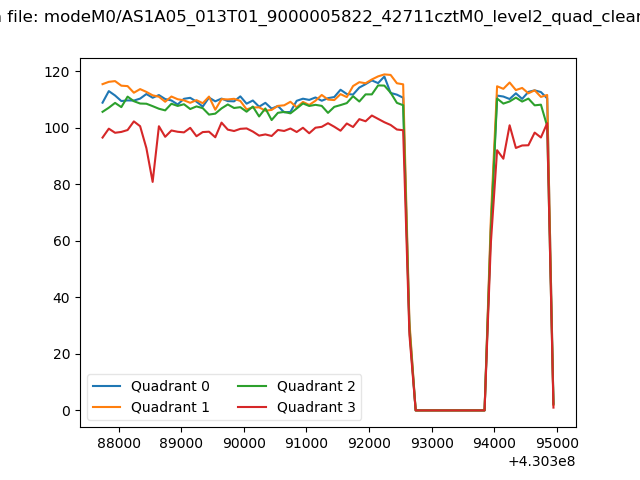 |
|
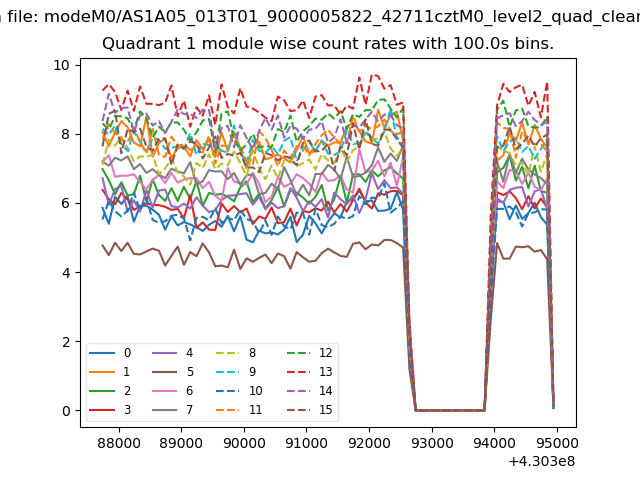
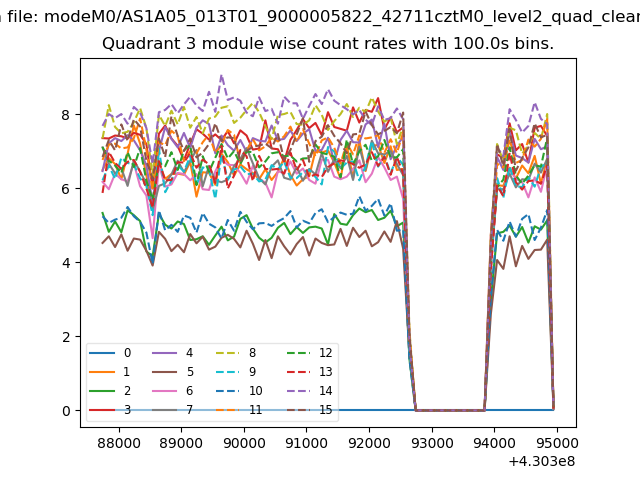
| Module-wise count rates for Quadrant A Data is divided into 100 sec bins |
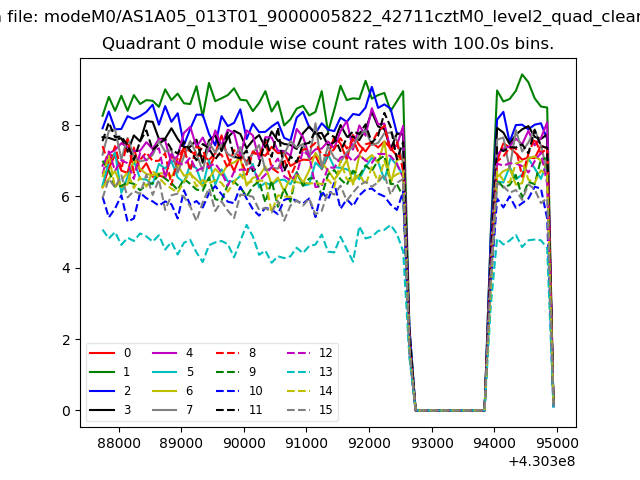 |
 |
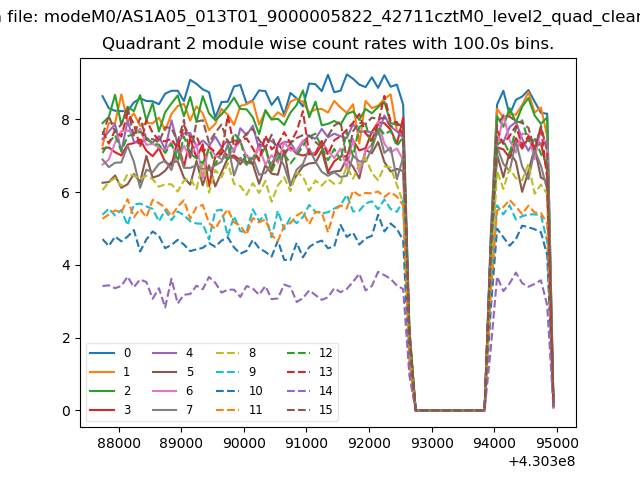
| Module-wise count rates for Quadrant B Data is divided into 100 sec bins |
 |
 |
| Module-wise count rates for Quadrant C Data is divided into 100 sec bins |
 |
 |
| Module-wise count rates for Quadrant D Data is divided into 100 sec bins |
 |
 |
| Parameter | Plot |
|---|---|
| CZT HV Monitor | 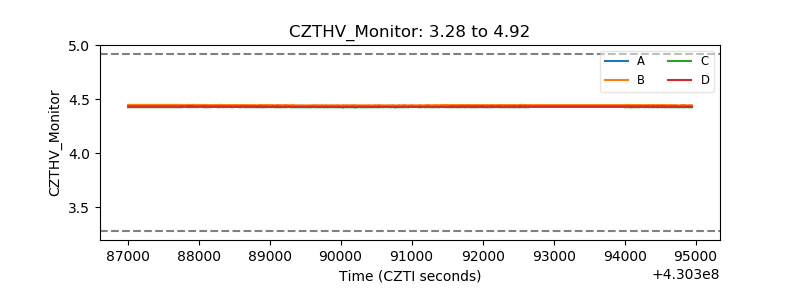 |
| D_VDD | 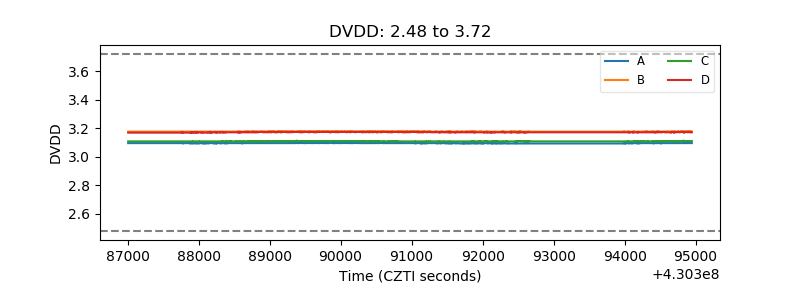 |
| Temperature 1 | 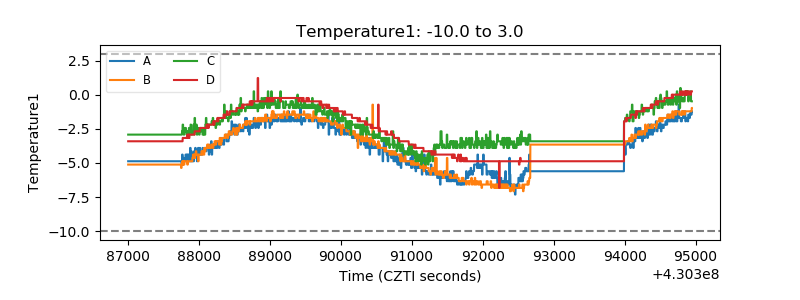 |
| Veto HV Monitor | 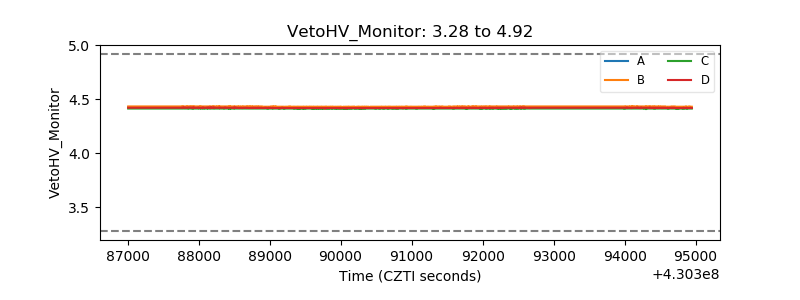 |
| Veto LLD | 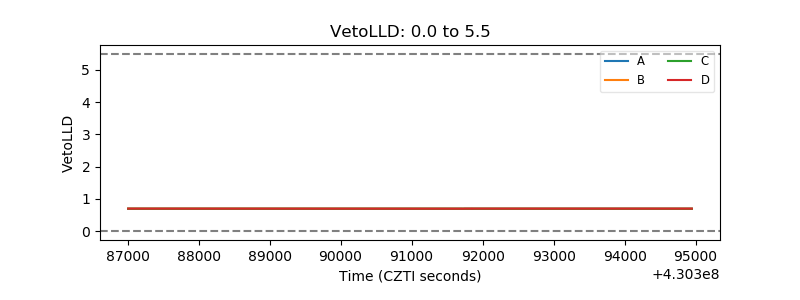 |
| Alpha Counter | 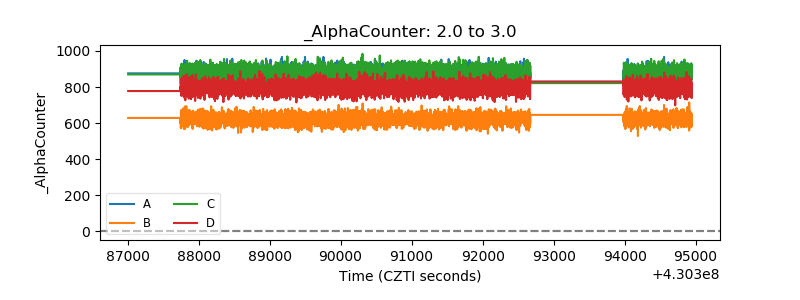 |
| _CPM_Rate | 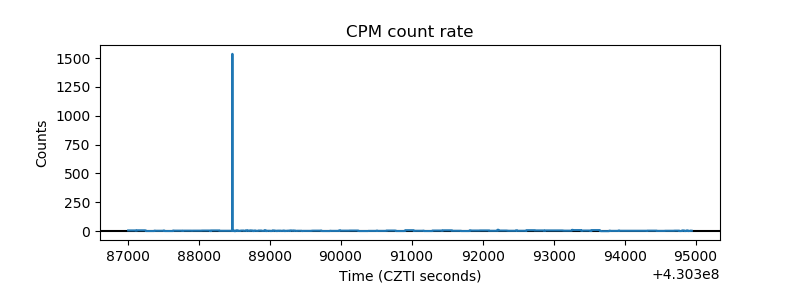 |
| CZT Counter | 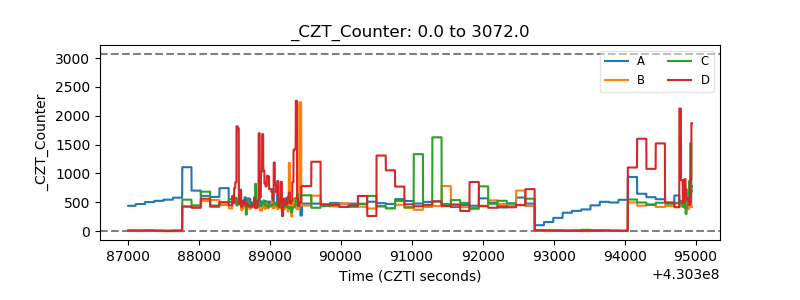 |
| +2.5 Volts monitor | 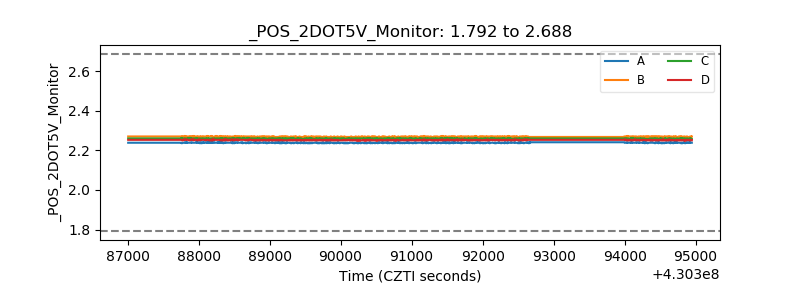 |
| +5 Volts monitor | 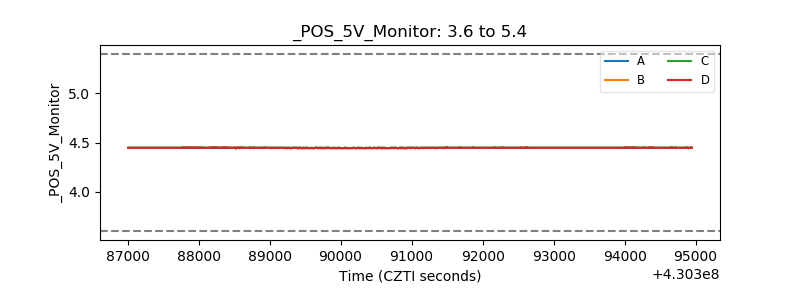 |
| _ROLL_ROT | 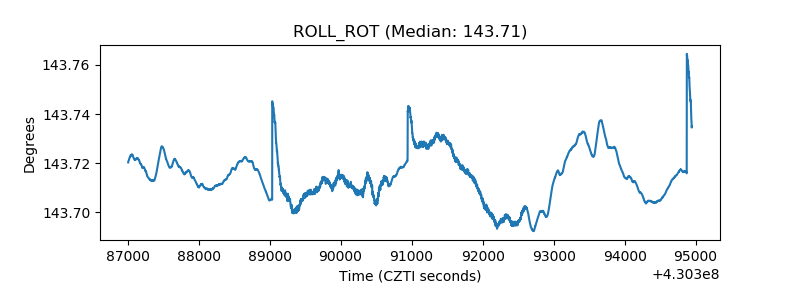 |
| _Roll_DEC | 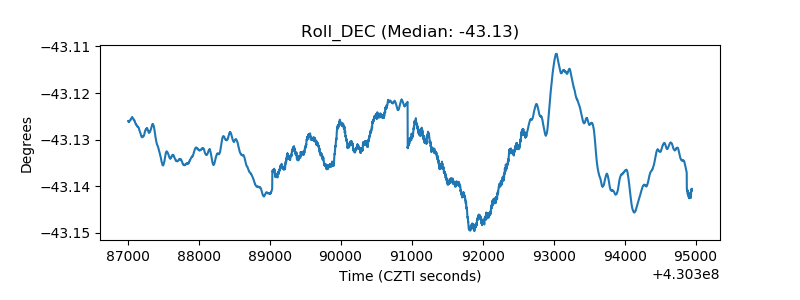 |
| _Roll_RA | 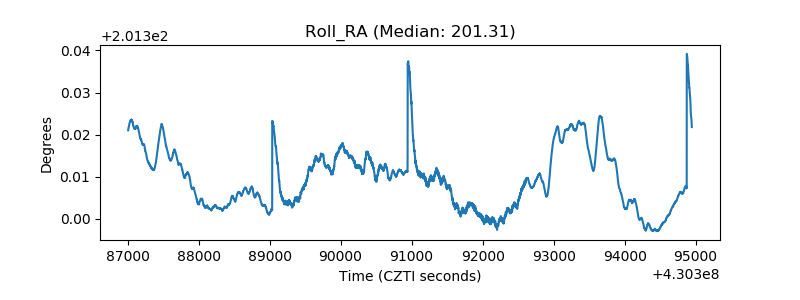 |
| Veto Counter | 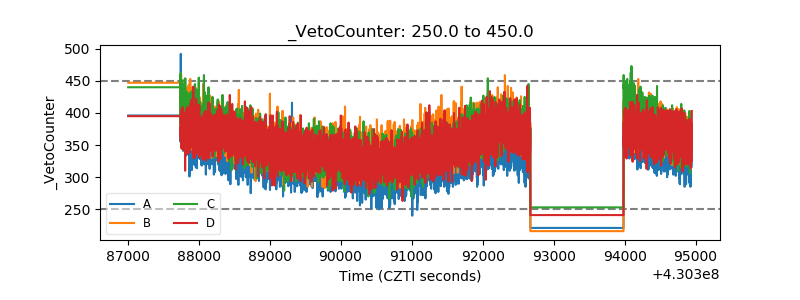 |