| Param | Original file | Final file |
|---|---|---|
| Filename | modeM0/AS1A05_013T01_9000005822_42712cztM0_level2.fits | modeM0/AS1A05_013T01_9000005822_42712cztM0_level2_quad_clean.evt |
| Size (bytes) | 383,310,720 | 98,527,680 |
| Size | 365.6 MB | 94.0 MB |
| Events in quadrant A | 3,421,322 | 663,821 |
| Events in quadrant B | 2,838,968 | 670,318 |
| Events in quadrant C | 3,116,290 | 643,767 |
| Events in quadrant D | 4,343,396 | 584,418 |
| Mode M0 | |||
|---|---|---|---|
| Quadrant | BADHDUFLAG | Total packets | Discarded packets |
| A | 0 | 13661 | 2 |
| B | 0 | 12565 | 2 |
| C | 0 | 13036 | 2 |
| D | 0 | 16976 | 2 |
| Mode M9 | |||
|---|---|---|---|
| Quadrant | BADHDUFLAG | Total packets | Discarded packets |
| A | 0 | 17 | 0 |
| B | 0 | 18 | 0 |
| C | 0 | 18 | 0 |
| D | 0 | 18 | 0 |
| Mode SS | |||
|---|---|---|---|
| Quadrant | BADHDUFLAG | Total packets | Discarded packets |
| A | 0 | 122 | 0 |
| B | 0 | 122 | 0 |
| C | 0 | 122 | 0 |
| D | 0 | 122 | 0 |
| Quadrant | Total seconds | Saturated seconds | Saturation percentage |
|---|---|---|---|
| A | 6028 | 38 | 0.630392% |
| B | 6028 | 22 | 0.364964% |
| C | 6028 | 48 | 0.796284% |
| D | 6028 | 273 | 4.528865% |
Noise dominated data is calculated using 1-second bins in cleaned event files. If a bin has >2000 counts, and if more than 50% of those come from <1% of pixels, then it is considered to be noise-dominated and hence unusable.
| Quadrant | # 1 sec bins | Bins with >0 counts | Bins with >2000 counts | High rate bins dominated by noise | Noise dominated (total time) | Noise dominated (detector-on time) | Marked lightcurve |
|---|---|---|---|---|---|---|---|
| A | 7311 | 6029 | 23 | 23 | 0.31% | 0.38% | 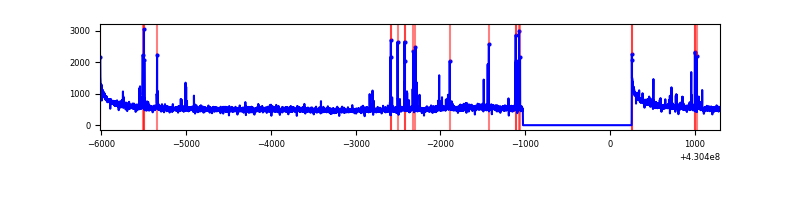 |
| B | 7311 | 6029 | 12 | 12 | 0.16% | 0.20% | 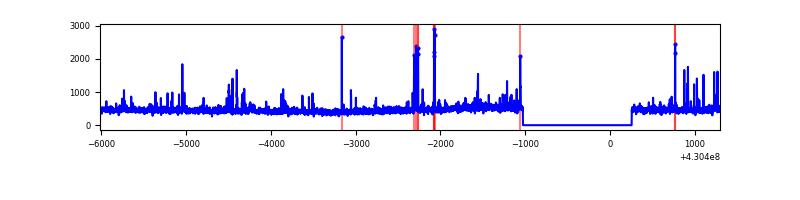 |
| C | 7311 | 6029 | 47 | 47 | 0.64% | 0.78% | 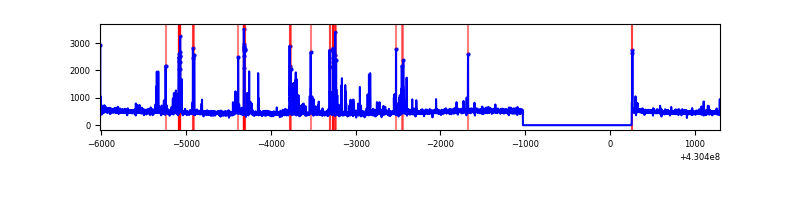 |
| D | 7311 | 6029 | 247 | 247 | 3.38% | 4.10% | 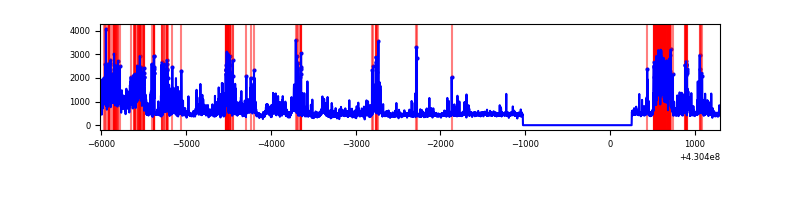 |
Top three noisy pixels from each quadrant. If the there are fewer than three noisy pixels in the level2.evt file, extra rows are filled as -1
| Pixel properties | Quadrant properties | ||||||
|---|---|---|---|---|---|---|---|
| Quadrant | DetID | PixID | Counts | Sigma | Mean | Median | Sigma |
| A | 10 | 83 | 666310 | 4841.36 | 665 | 652 | 137.5 |
| A | 13 | 248 | 128490 | 929.77 | 665 | 652 | 137.5 |
| A | 15 | 237 | 41660 | 298.25 | 665 | 652 | 137.5 |
| B | 10 | 246 | 54074 | 415.28 | 658 | 641 | 128.7 |
| B | 5 | 255 | 53484 | 410.69 | 658 | 641 | 128.7 |
| B | 12 | 18 | 50111 | 384.48 | 658 | 641 | 128.7 |
| C | 4 | 254 | 313273 | 2070.1 | 641 | 645 | 151.0 |
| C | 15 | 214 | 256531 | 1694.38 | 641 | 645 | 151.0 |
| C | 3 | 233 | 34511 | 224.25 | 641 | 645 | 151.0 |
| D | 2 | 249 | 820960 | 5251.22 | 637 | 619 | 156.2 |
| D | 1 | 52 | 469321 | 3000.29 | 637 | 619 | 156.2 |
| D | 13 | 249 | 150915 | 962.09 | 637 | 619 | 156.2 |
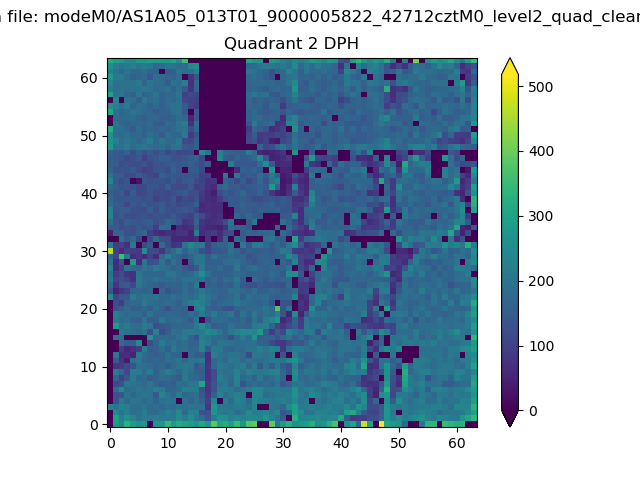
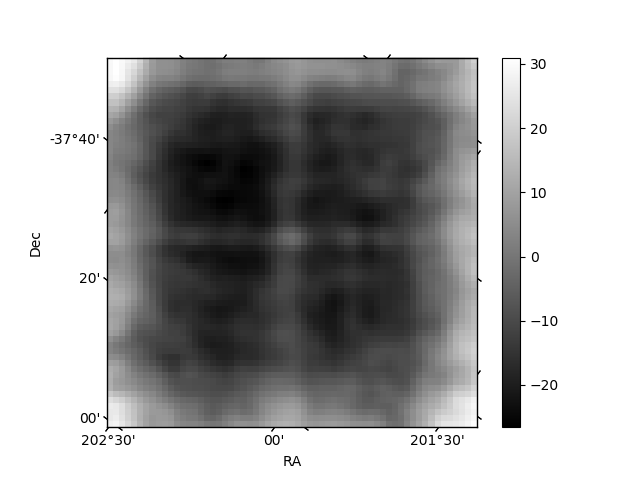
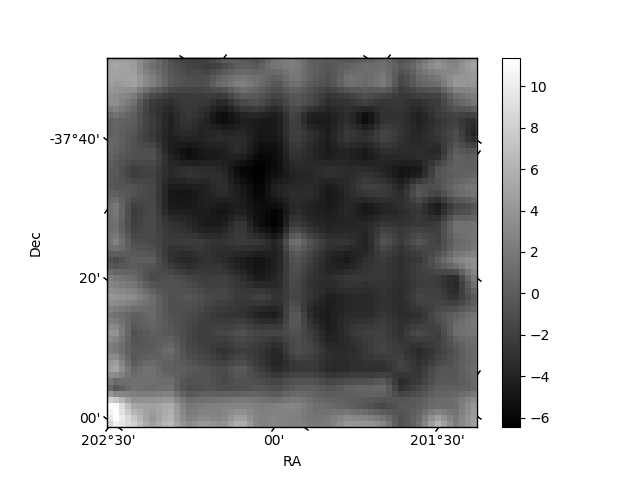
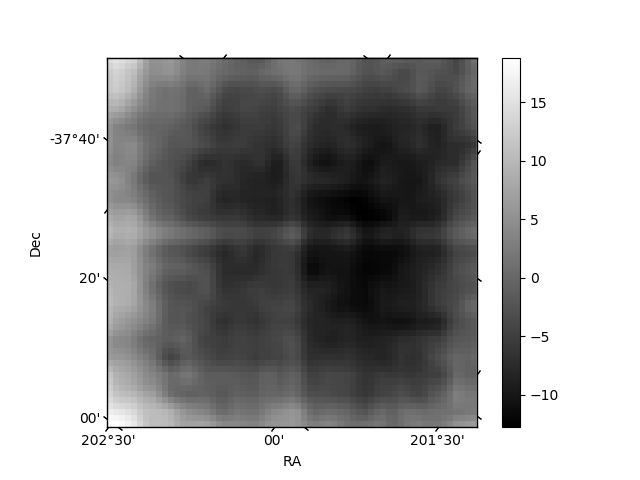
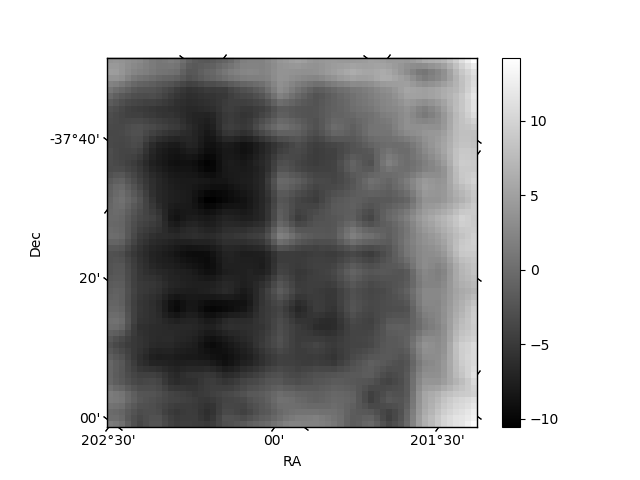
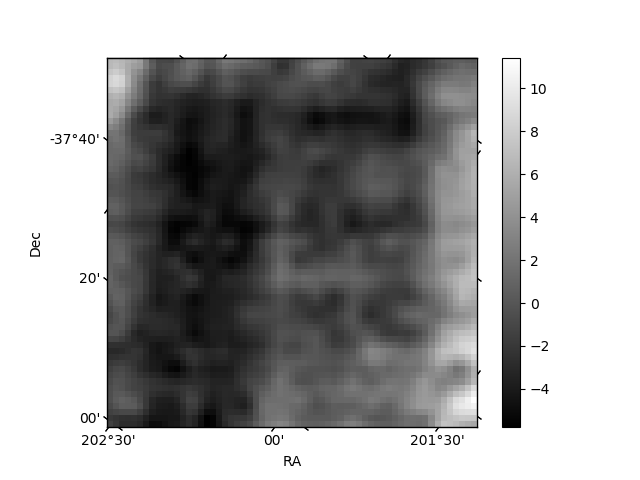
Histogram calculated using DETX and DETY for each event in the final _common_clean file
| Quadrant A | 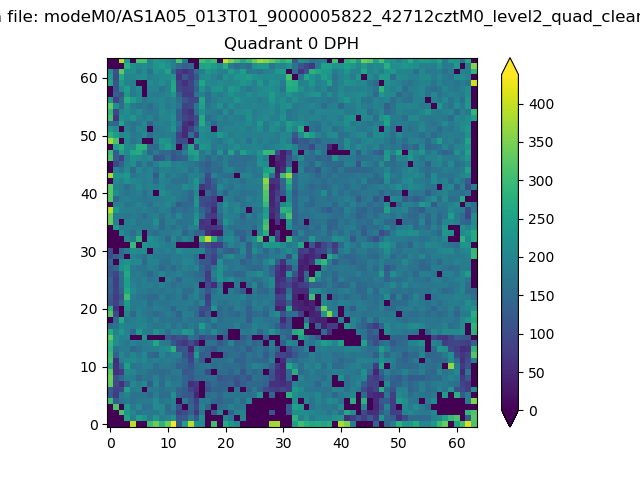 |
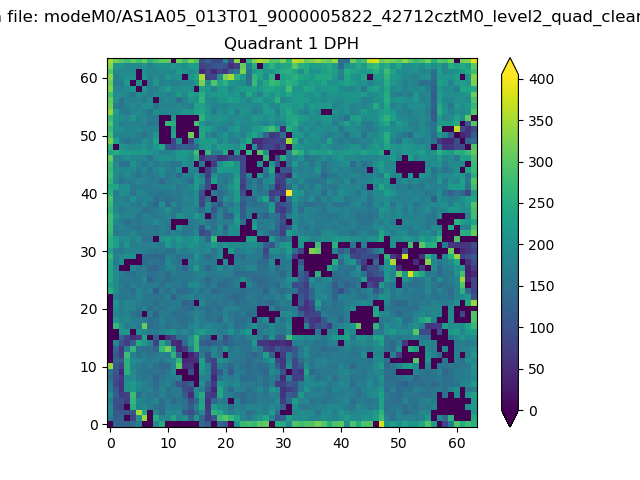 |
Quadrant B |
|---|---|---|---|
| Quadrant D | 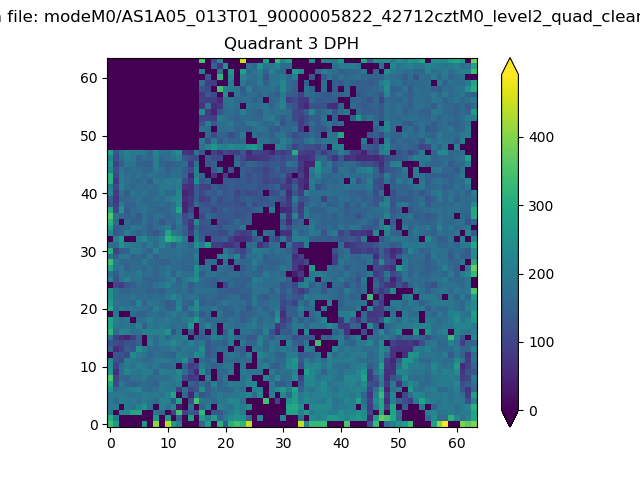 |
 |
Quadrant C |
| Plot type | Count rate plots | Images |
|---|---|---|
| Comparison with Poisson distribution Blue bars denote a histogram of data divided into 1 sec bins. Red curve is a Poisson curve with rate = median count rate of data. |
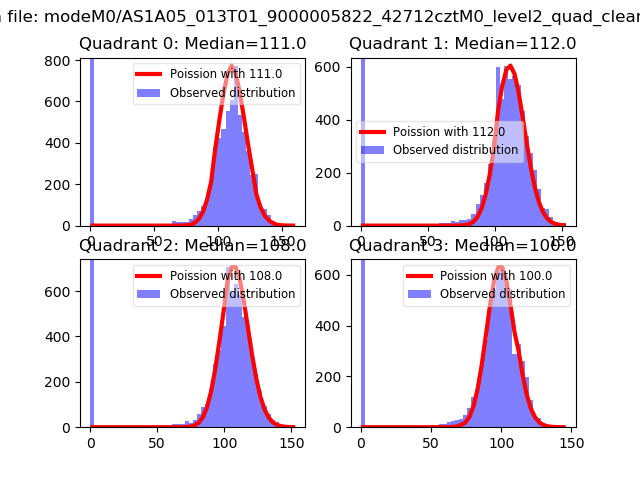 |
 |
| Quadrant-wise count rates Data is divided into 100 sec bins |
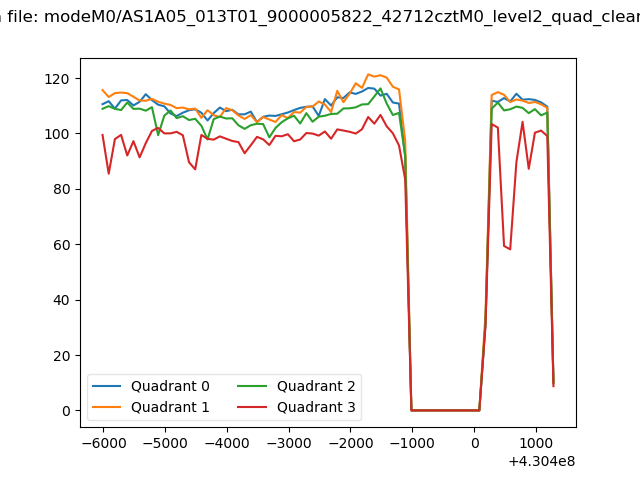 |
|
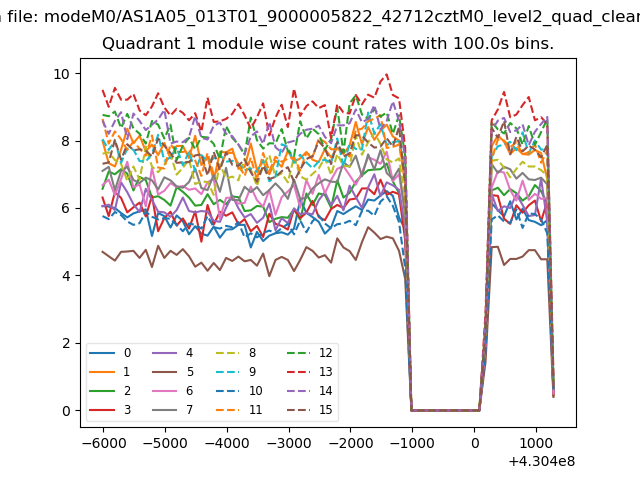
| Module-wise count rates for Quadrant A Data is divided into 100 sec bins |
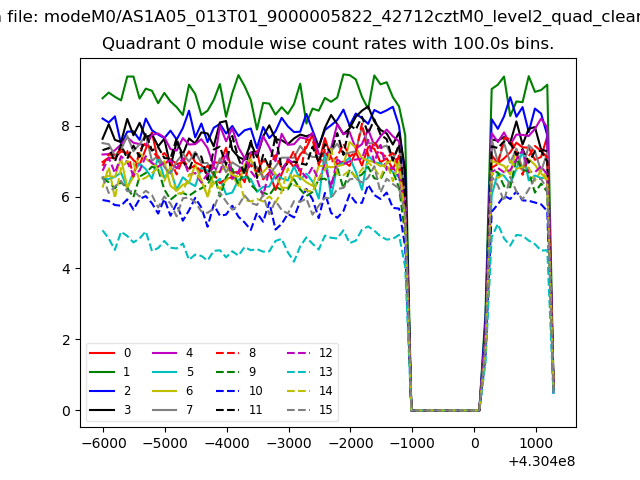 |
 |
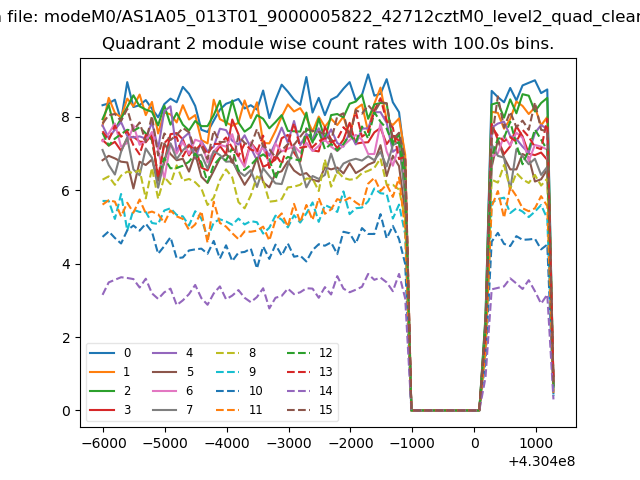
| Module-wise count rates for Quadrant B Data is divided into 100 sec bins |
 |
 |
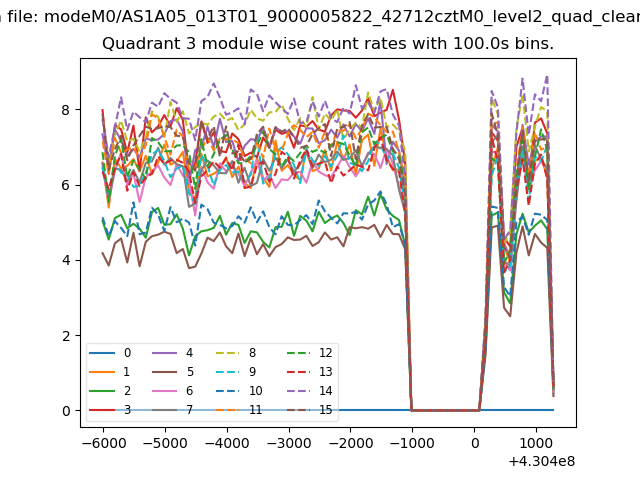
| Module-wise count rates for Quadrant C Data is divided into 100 sec bins |
 |
 |
| Module-wise count rates for Quadrant D Data is divided into 100 sec bins |
 |
 |
| Parameter | Plot |
|---|---|
| CZT HV Monitor | 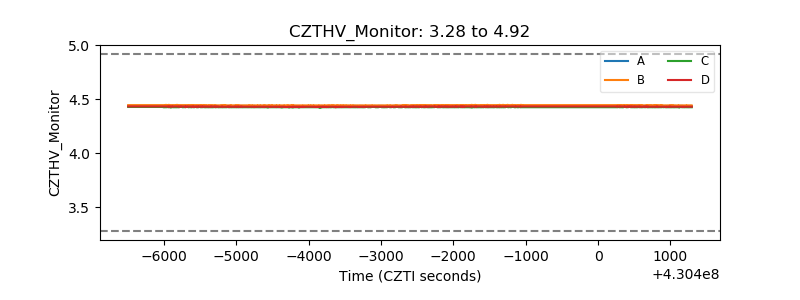 |
| D_VDD | 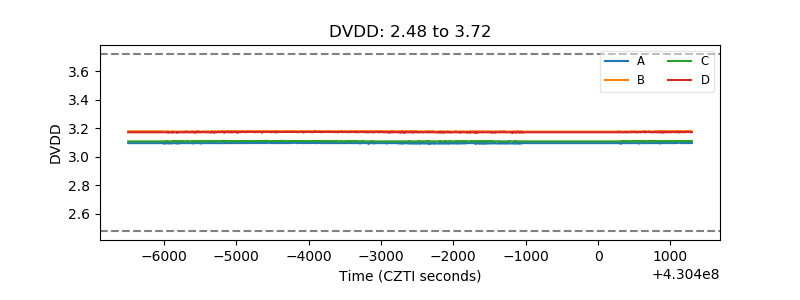 |
| Temperature 1 | 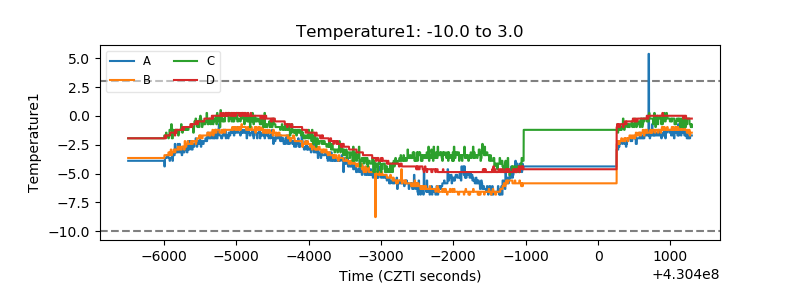 |
| Veto HV Monitor |  |
| Veto LLD | 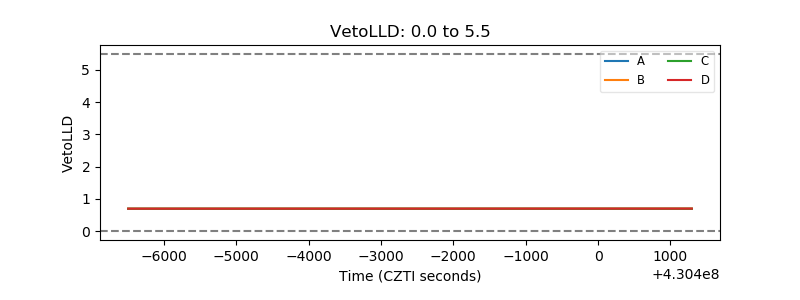 |
| Alpha Counter | 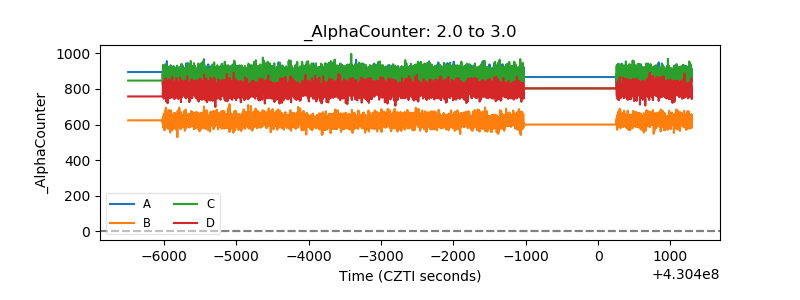 |
| _CPM_Rate | 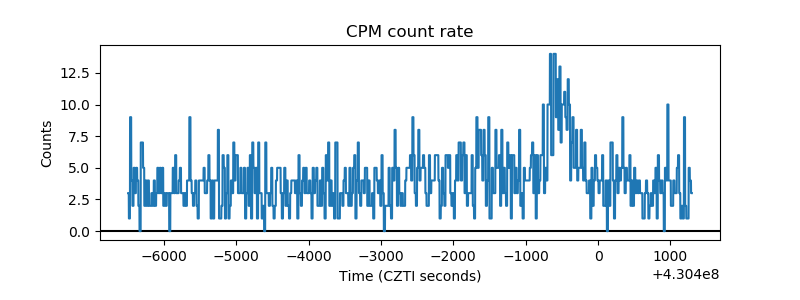 |
| CZT Counter | 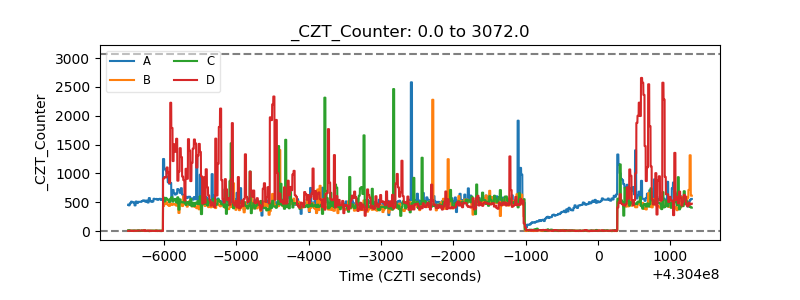 |
| +2.5 Volts monitor | 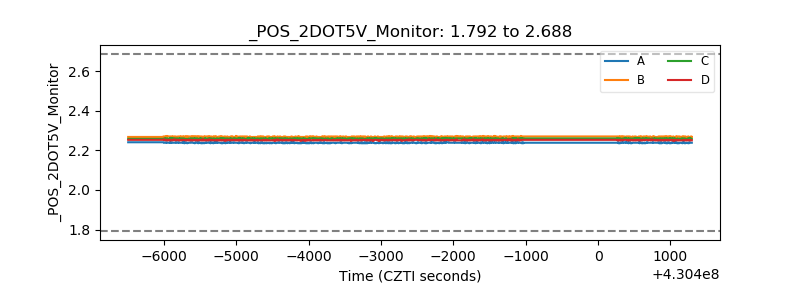 |
| +5 Volts monitor | 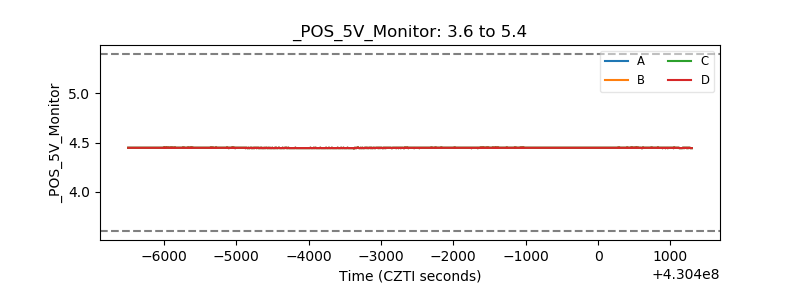 |
| _ROLL_ROT | 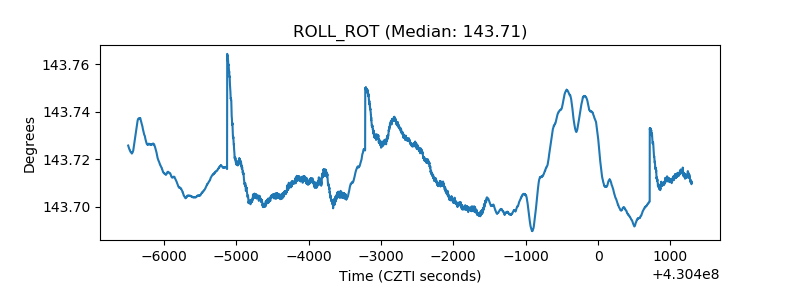 |
| _Roll_DEC | 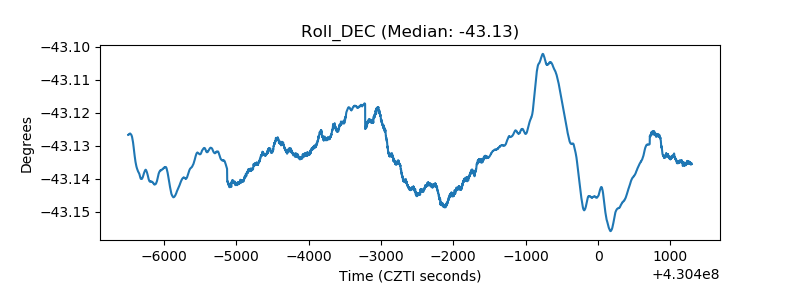 |
| _Roll_RA | 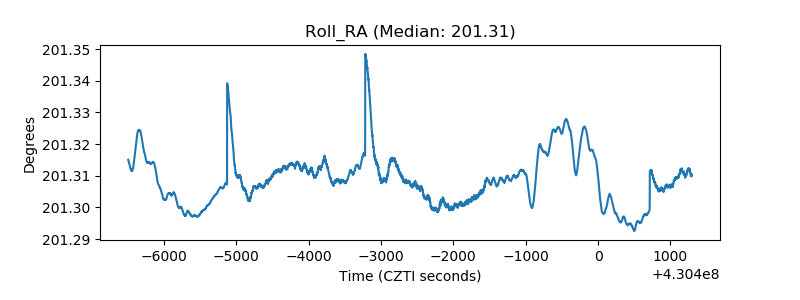 |
| Veto Counter | 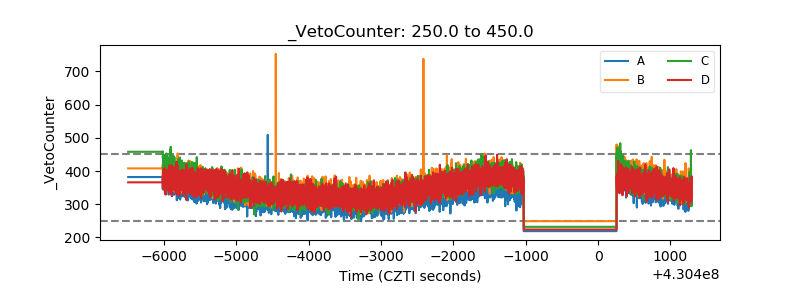 |