| Param | Original file | Final file |
|---|---|---|
| Filename | modeM0/AS1A05_013T01_9000005822_42714cztM0_level2.fits | modeM0/AS1A05_013T01_9000005822_42714cztM0_level2_quad_clean.evt |
| Size (bytes) | 643,985,280 | 169,162,560 |
| Size | 614.2 MB | 161.3 MB |
| Events in quadrant A | 5,790,965 | 1,144,734 |
| Events in quadrant B | 5,058,347 | 1,149,845 |
| Events in quadrant C | 4,957,206 | 1,111,983 |
| Events in quadrant D | 7,209,066 | 980,992 |
| Mode M0 | |||
|---|---|---|---|
| Quadrant | BADHDUFLAG | Total packets | Discarded packets |
| A | 0 | 23367 | 2 |
| B | 0 | 22418 | 3 |
| C | 0 | 21582 | 2 |
| D | 0 | 28666 | 2 |
| Mode M9 | |||
|---|---|---|---|
| Quadrant | BADHDUFLAG | Total packets | Discarded packets |
| A | 0 | 28 | 0 |
| B | 0 | 28 | 0 |
| C | 0 | 28 | 0 |
| D | 0 | 28 | 0 |
| Mode SS | |||
|---|---|---|---|
| Quadrant | BADHDUFLAG | Total packets | Discarded packets |
| A | 0 | 216 | 0 |
| B | 0 | 216 | 0 |
| C | 0 | 216 | 0 |
| D | 0 | 216 | 0 |
| Quadrant | Total seconds | Saturated seconds | Saturation percentage |
|---|---|---|---|
| A | 10600 | 64 | 0.603774% |
| B | 10600 | 83 | 0.783019% |
| C | 10600 | 7 | 0.066038% |
| D | 10600 | 637 | 6.009434% |
Noise dominated data is calculated using 1-second bins in cleaned event files. If a bin has >2000 counts, and if more than 50% of those come from <1% of pixels, then it is considered to be noise-dominated and hence unusable.
| Quadrant | # 1 sec bins | Bins with >0 counts | Bins with >2000 counts | High rate bins dominated by noise | Noise dominated (total time) | Noise dominated (detector-on time) | Marked lightcurve |
|---|---|---|---|---|---|---|---|
| A | 13374 | 10602 | 44 | 44 | 0.33% | 0.42% | 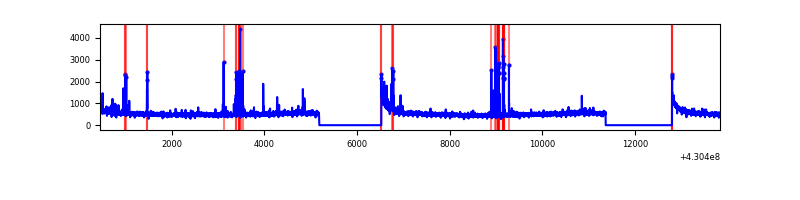 |
| B | 13374 | 10602 | 59 | 59 | 0.44% | 0.56% | 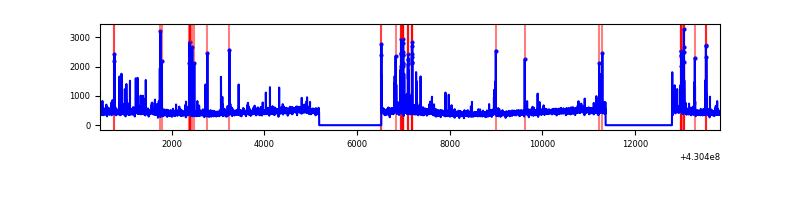 |
| C | 13374 | 10602 | 2 | 2 | 0.01% | 0.02% | 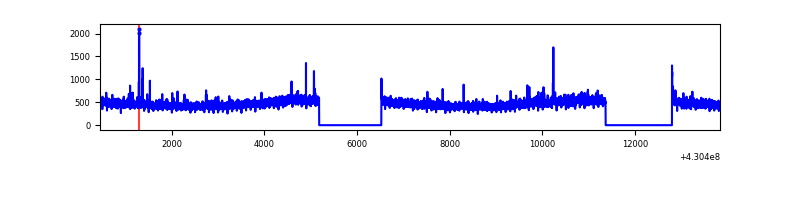 |
| D | 13374 | 10602 | 617 | 617 | 4.61% | 5.82% | 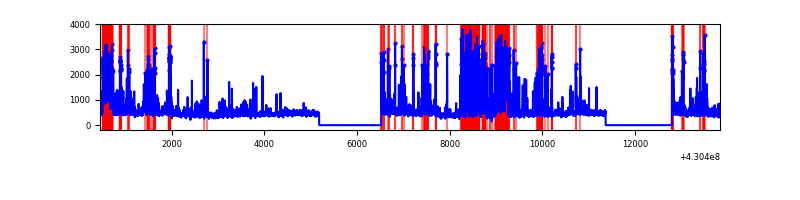 |
Top three noisy pixels from each quadrant. If the there are fewer than three noisy pixels in the level2.evt file, extra rows are filled as -1
| Pixel properties | Quadrant properties | ||||||
|---|---|---|---|---|---|---|---|
| Quadrant | DetID | PixID | Counts | Sigma | Mean | Median | Sigma |
| A | 10 | 83 | 1042703 | 4390.13 | 1157 | 1133 | 237.3 |
| A | 15 | 237 | 138369 | 578.44 | 1157 | 1133 | 237.3 |
| A | 13 | 248 | 106935 | 445.95 | 1157 | 1133 | 237.3 |
| B | 5 | 255 | 189640 | 835.72 | 1149 | 1115 | 225.6 |
| B | 15 | 85 | 91871 | 402.31 | 1149 | 1115 | 225.6 |
| B | 5 | 172 | 71944 | 313.98 | 1149 | 1115 | 225.6 |
| C | 15 | 214 | 441555 | 1679.72 | 1122 | 1129 | 262.2 |
| C | 3 | 233 | 62834 | 235.33 | 1122 | 1129 | 262.2 |
| C | 0 | 239 | 27409 | 100.23 | 1122 | 1129 | 262.2 |
| D | 2 | 249 | 1717876 | 6354.65 | 1103 | 1072 | 270.2 |
| D | 12 | 233 | 250865 | 924.59 | 1103 | 1072 | 270.2 |
| D | 13 | 249 | 204995 | 754.81 | 1103 | 1072 | 270.2 |
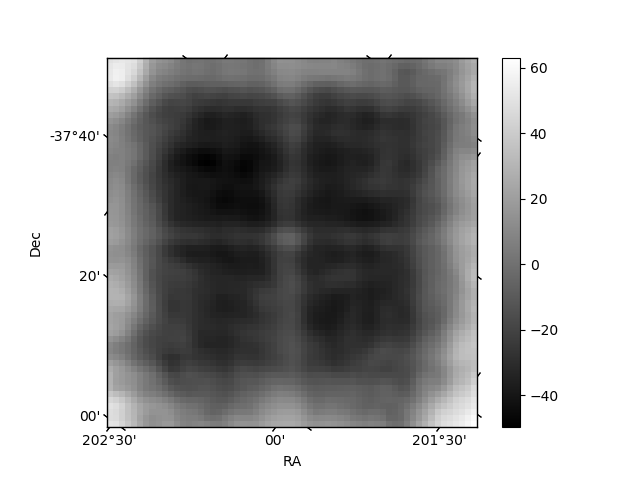
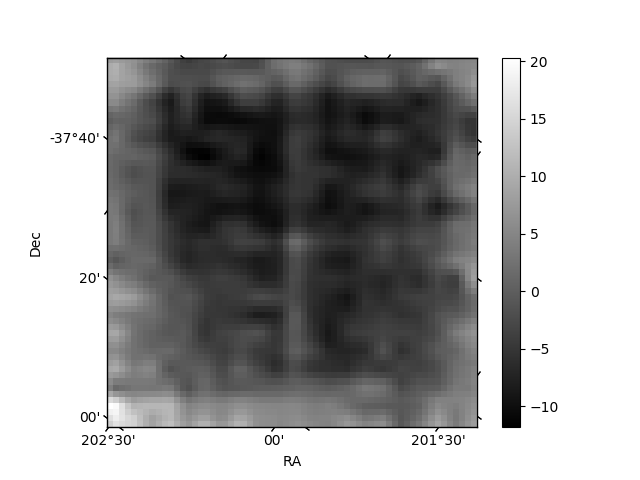
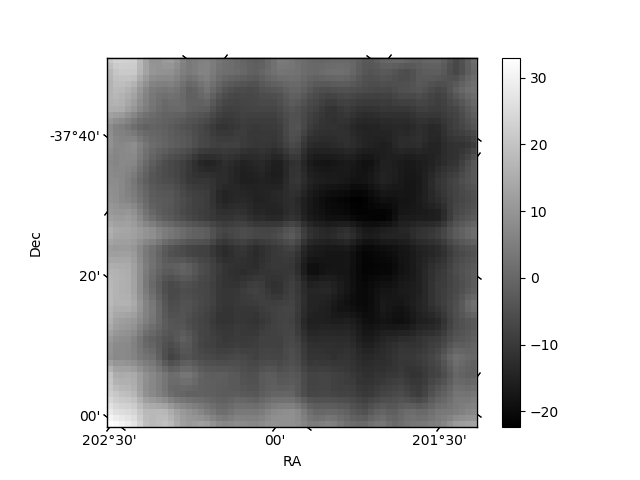
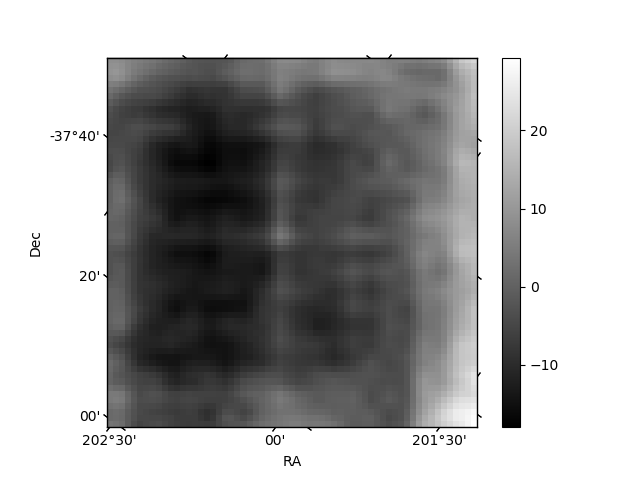
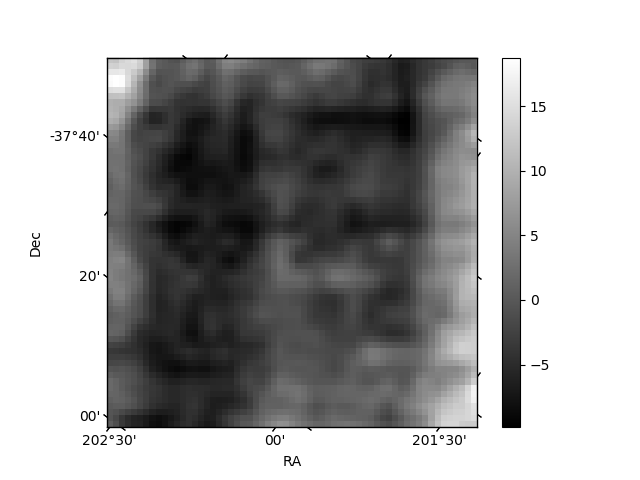
Histogram calculated using DETX and DETY for each event in the final _common_clean file
| Quadrant A | 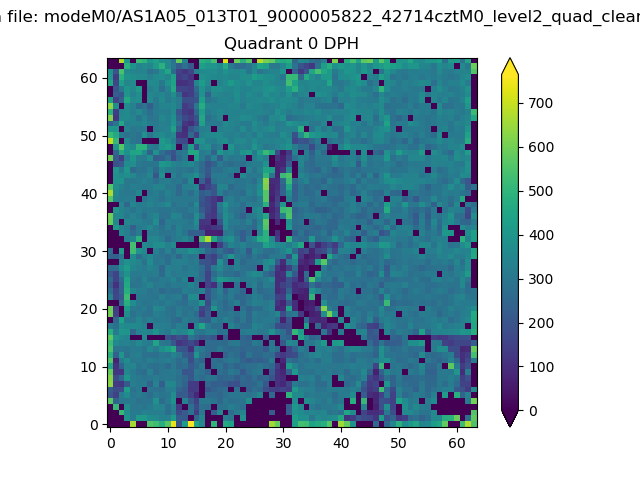 |
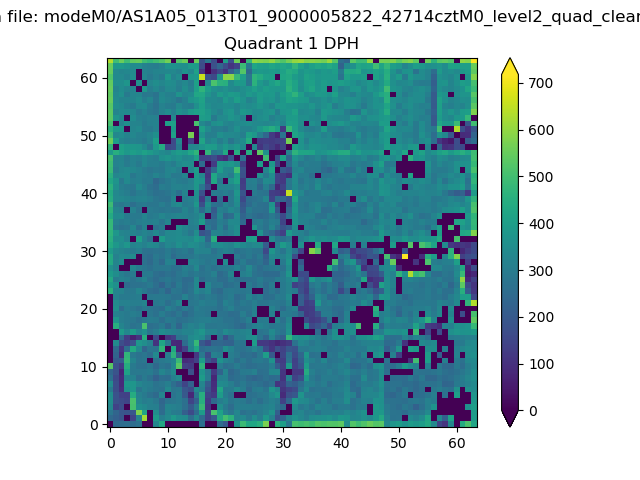 |
Quadrant B |
|---|---|---|---|
| Quadrant D | 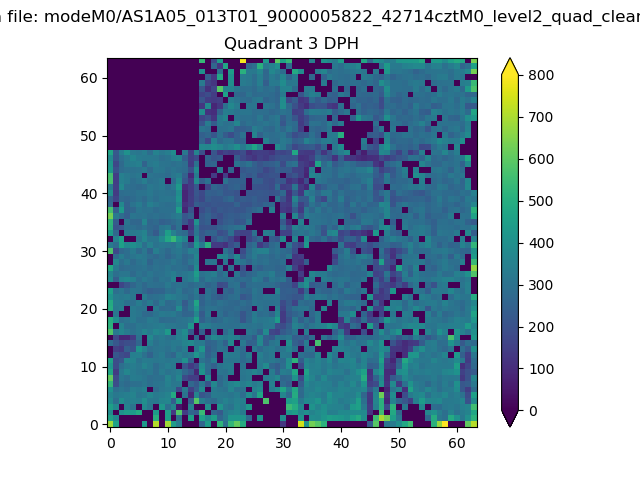 |
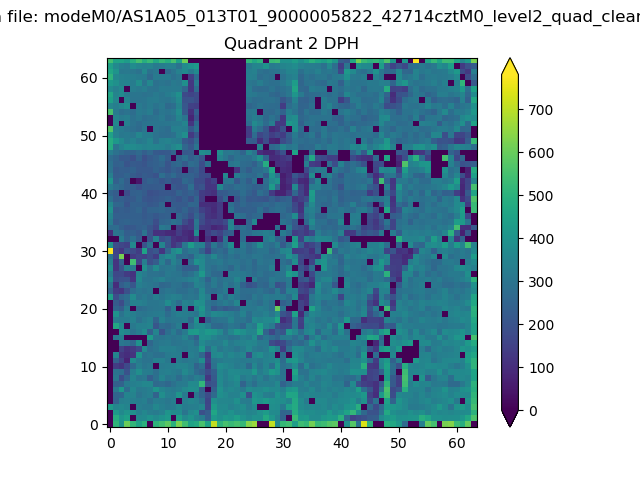 |
Quadrant C |
| Plot type | Count rate plots | Images |
|---|---|---|
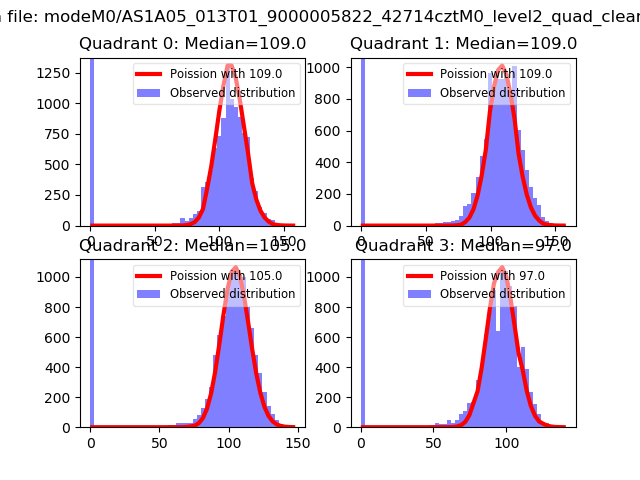
| Comparison with Poisson distribution Blue bars denote a histogram of data divided into 1 sec bins. Red curve is a Poisson curve with rate = median count rate of data. |
 |
 |
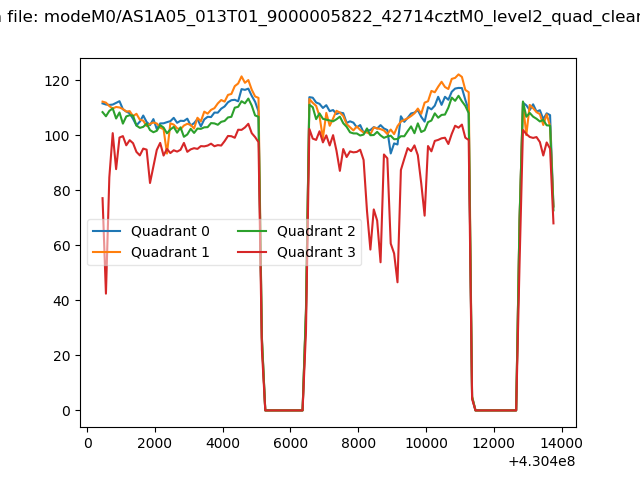
| Quadrant-wise count rates Data is divided into 100 sec bins |
 |
|
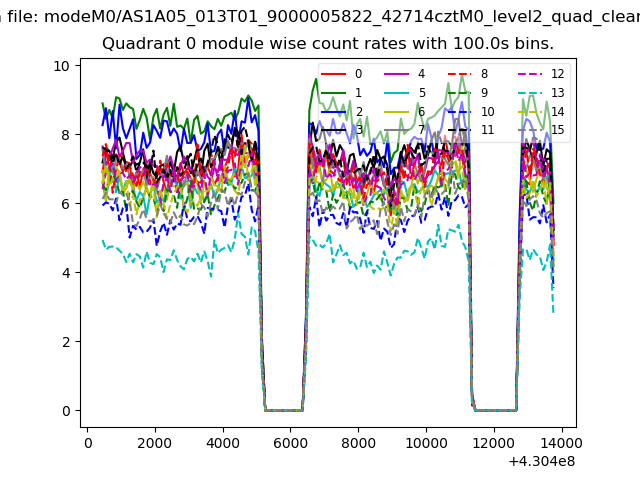
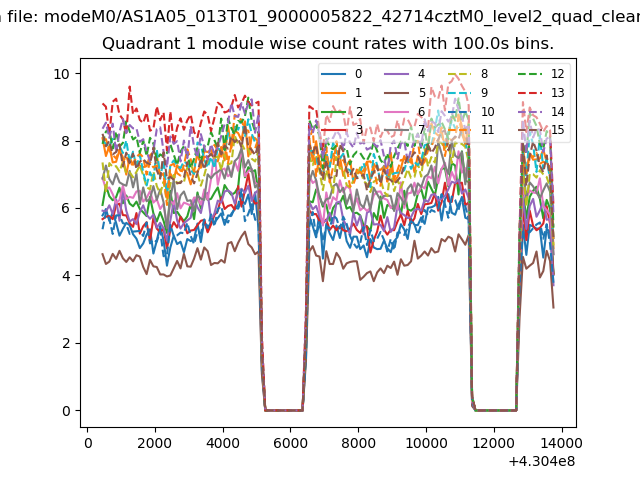
| Module-wise count rates for Quadrant A Data is divided into 100 sec bins |
 |
 |
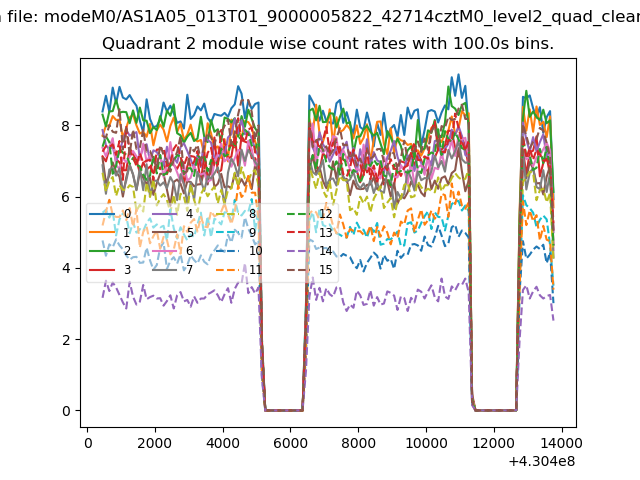
| Module-wise count rates for Quadrant B Data is divided into 100 sec bins |
 |
 |
| Module-wise count rates for Quadrant C Data is divided into 100 sec bins |
 |
 |
| Module-wise count rates for Quadrant D Data is divided into 100 sec bins |
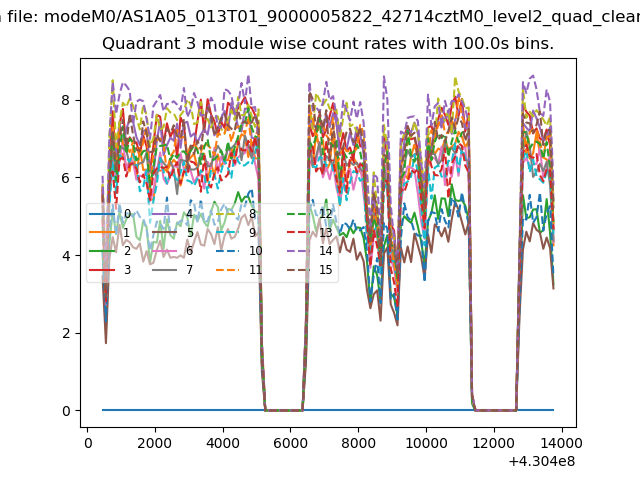 |
 |
| Parameter | Plot |
|---|---|
| CZT HV Monitor | 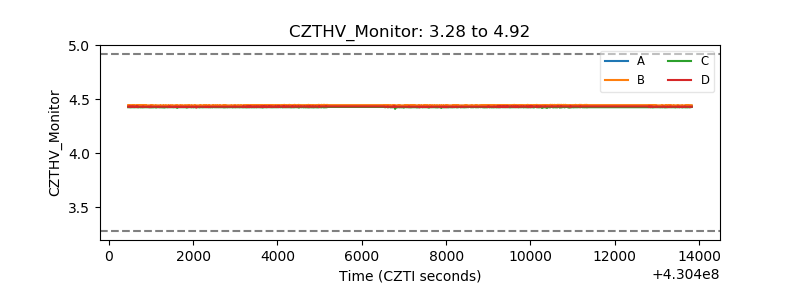 |
| D_VDD | 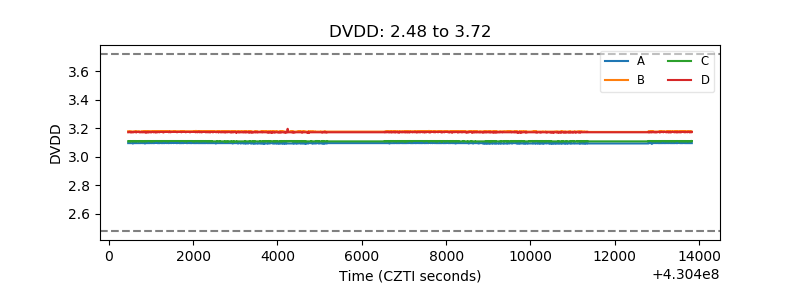 |
| Temperature 1 | 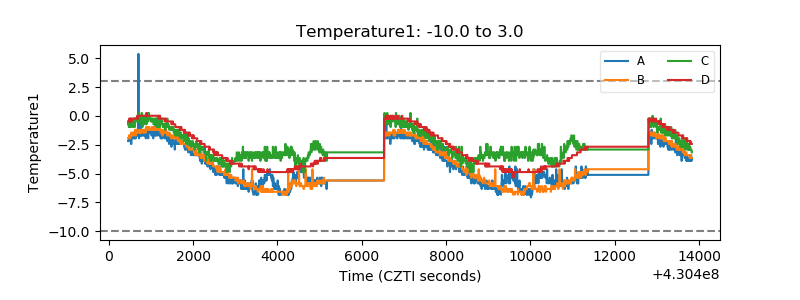 |
| Veto HV Monitor | 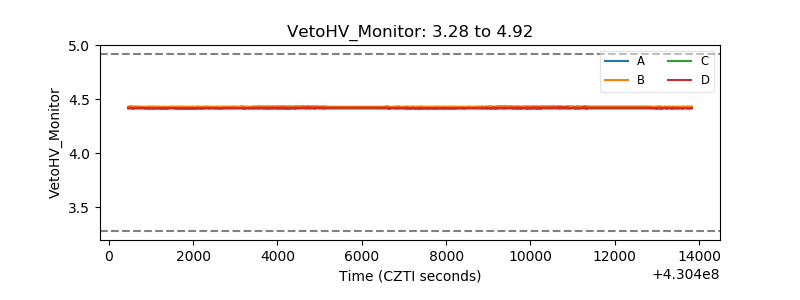 |
| Veto LLD | 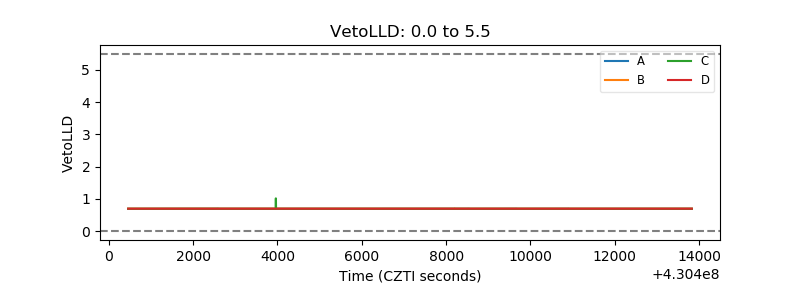 |
| Alpha Counter | 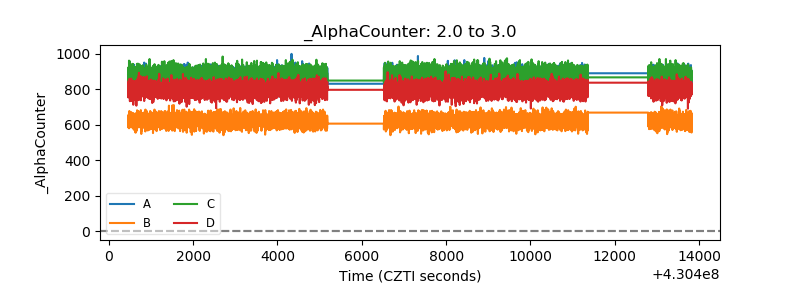 |
| _CPM_Rate | 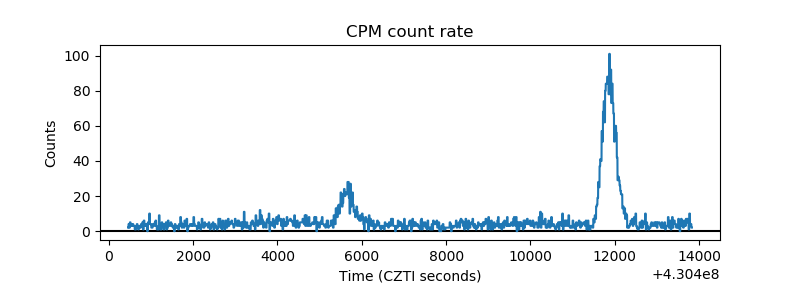 |
| CZT Counter | 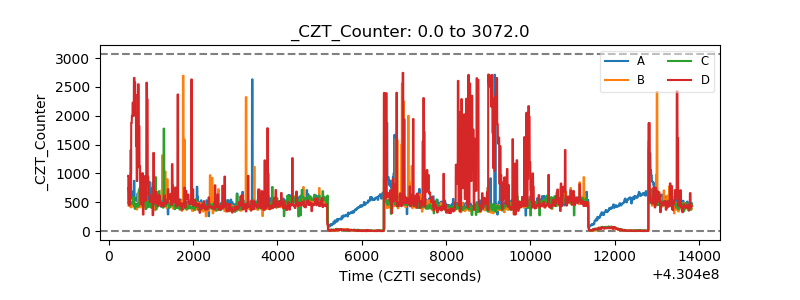 |
| +2.5 Volts monitor | 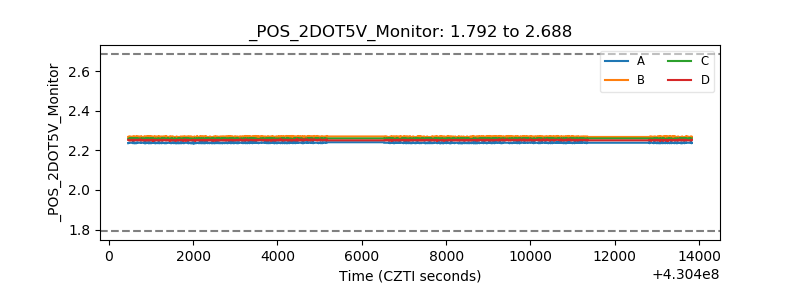 |
| +5 Volts monitor | 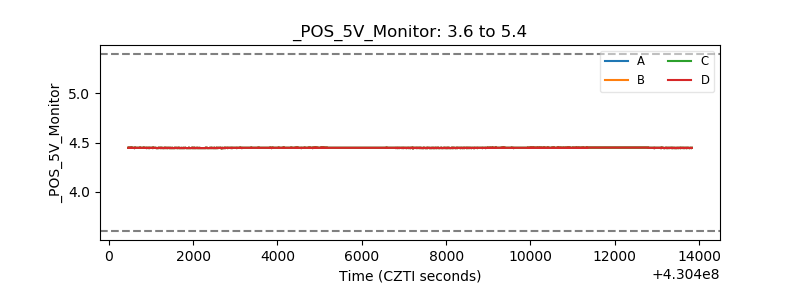 |
| _ROLL_ROT | 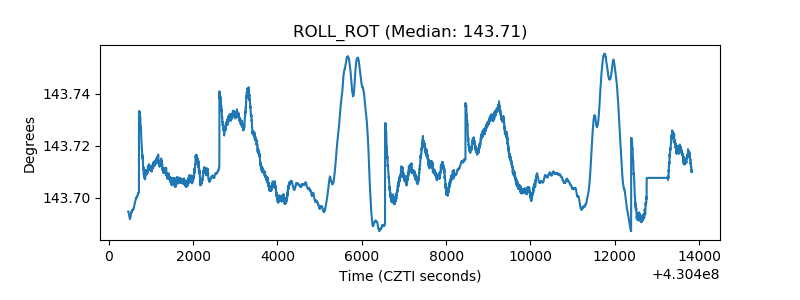 |
| _Roll_DEC | 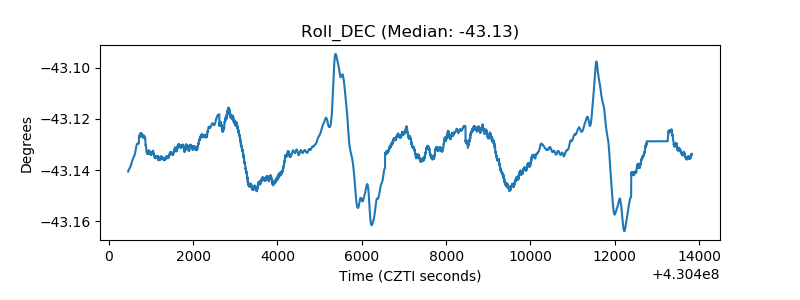 |
| _Roll_RA | 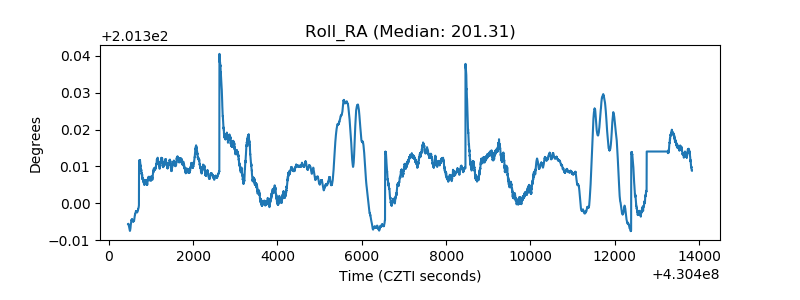 |
| Veto Counter | 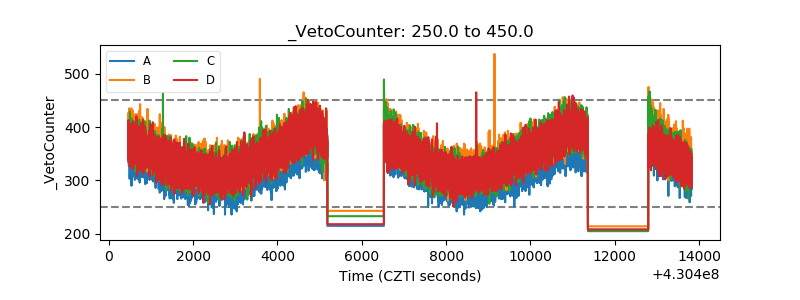 |