| Param | Original file | Final file |
|---|---|---|
| Filename | modeM0/AS1A05_013T01_9000005822_42715cztM0_level2.fits | modeM0/AS1A05_013T01_9000005822_42715cztM0_level2_quad_clean.evt |
| Size (bytes) | 316,437,120 | 89,239,680 |
| Size | 301.8 MB | 85.1 MB |
| Events in quadrant A | 2,952,548 | 600,249 |
| Events in quadrant B | 2,868,542 | 596,209 |
| Events in quadrant C | 2,620,895 | 581,094 |
| Events in quadrant D | 2,842,438 | 539,537 |
| Mode M0 | |||
|---|---|---|---|
| Quadrant | BADHDUFLAG | Total packets | Discarded packets |
| A | 0 | 12073 | 1 |
| B | 0 | 12293 | 1 |
| C | 0 | 11400 | 1 |
| D | 0 | 12412 | 1 |
| Mode M9 | |||
|---|---|---|---|
| Quadrant | BADHDUFLAG | Total packets | Discarded packets |
| A | 0 | 16 | 0 |
| B | 0 | 16 | 0 |
| C | 0 | 16 | 0 |
| D | 0 | 16 | 0 |
| Mode SS | |||
|---|---|---|---|
| Quadrant | BADHDUFLAG | Total packets | Discarded packets |
| A | 0 | 110 | 0 |
| B | 0 | 110 | 0 |
| C | 0 | 110 | 0 |
| D | 0 | 110 | 0 |
| Quadrant | Total seconds | Saturated seconds | Saturation percentage |
|---|---|---|---|
| A | 5504 | 9 | 0.163517% |
| B | 5505 | 121 | 2.198002% |
| C | 5505 | 8 | 0.145322% |
| D | 5505 | 64 | 1.162579% |
Noise dominated data is calculated using 1-second bins in cleaned event files. If a bin has >2000 counts, and if more than 50% of those come from <1% of pixels, then it is considered to be noise-dominated and hence unusable.
| Quadrant | # 1 sec bins | Bins with >0 counts | Bins with >2000 counts | High rate bins dominated by noise | Noise dominated (total time) | Noise dominated (detector-on time) | Marked lightcurve |
|---|---|---|---|---|---|---|---|
| A | 7088 | 5505 | 4 | 4 | 0.06% | 0.07% | 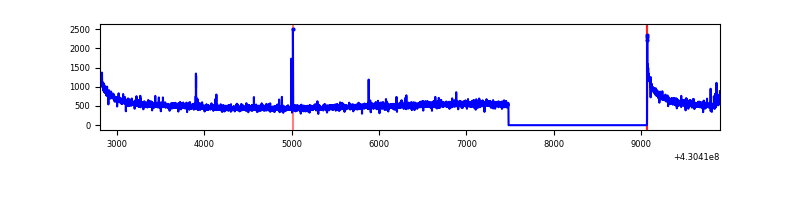 |
| B | 7089 | 5506 | 95 | 95 | 1.34% | 1.73% | 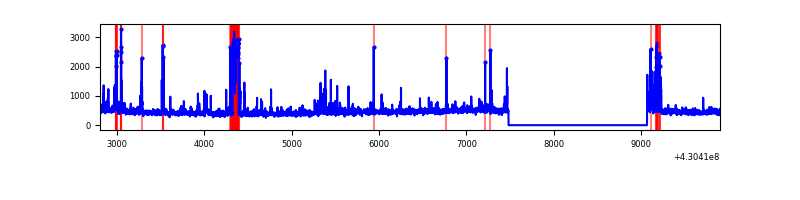 |
| C | 7089 | 5506 | 6 | 6 | 0.08% | 0.11% | 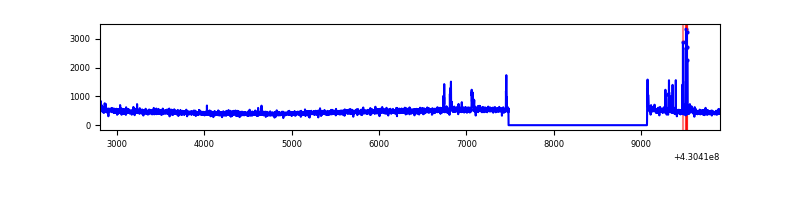 |
| D | 7089 | 5506 | 66 | 66 | 0.93% | 1.20% | 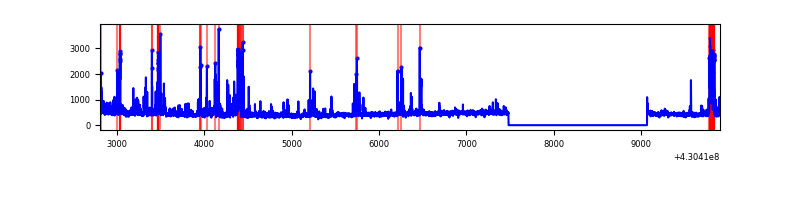 |
Top three noisy pixels from each quadrant. If the there are fewer than three noisy pixels in the level2.evt file, extra rows are filled as -1
| Pixel properties | Quadrant properties | ||||||
|---|---|---|---|---|---|---|---|
| Quadrant | DetID | PixID | Counts | Sigma | Mean | Median | Sigma |
| A | 10 | 83 | 595975 | 4763.99 | 599 | 586 | 125.0 |
| A | 12 | 189 | 16457 | 126.99 | 599 | 586 | 125.0 |
| A | 13 | 254 | 9083 | 67.98 | 599 | 586 | 125.0 |
| B | 5 | 172 | 197874 | 1698.32 | 592 | 575 | 116.2 |
| B | 15 | 85 | 130017 | 1114.22 | 592 | 575 | 116.2 |
| B | 12 | 18 | 58024 | 494.51 | 592 | 575 | 116.2 |
| C | 15 | 214 | 229768 | 1670.97 | 581 | 585 | 137.2 |
| C | 0 | 239 | 72584 | 524.94 | 581 | 585 | 137.2 |
| C | 3 | 233 | 38827 | 278.82 | 581 | 585 | 137.2 |
| D | 2 | 249 | 250446 | 1766.23 | 578 | 562 | 141.5 |
| D | 12 | 233 | 183598 | 1293.73 | 578 | 562 | 141.5 |
| D | 13 | 249 | 73350 | 514.48 | 578 | 562 | 141.5 |
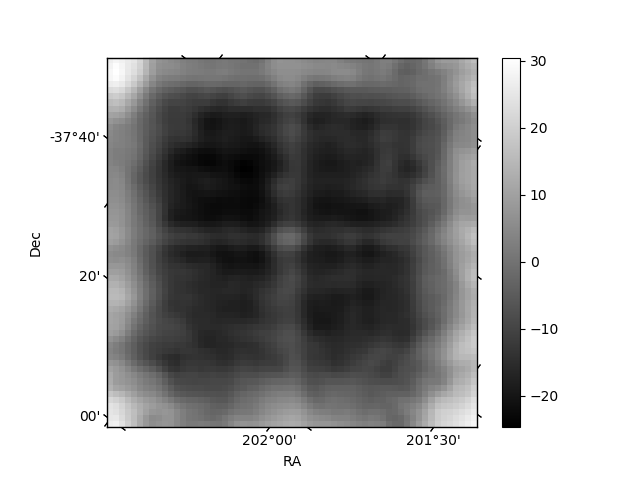
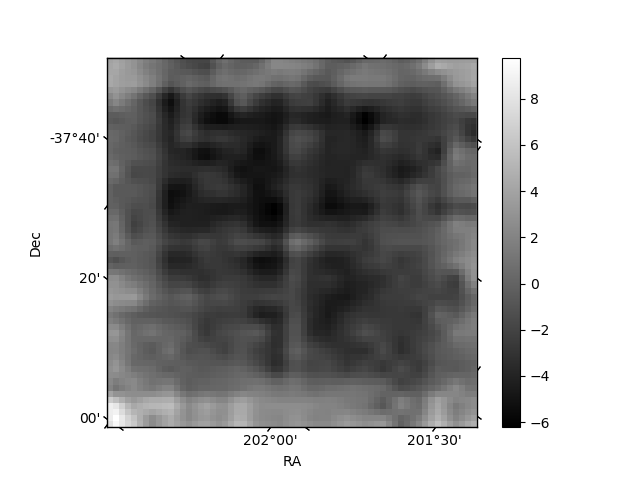
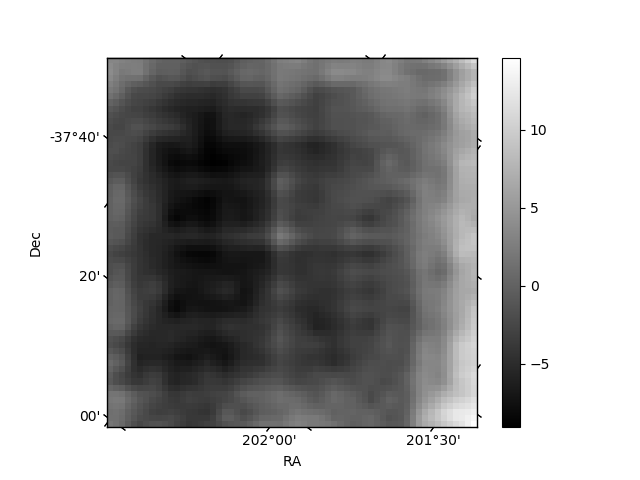
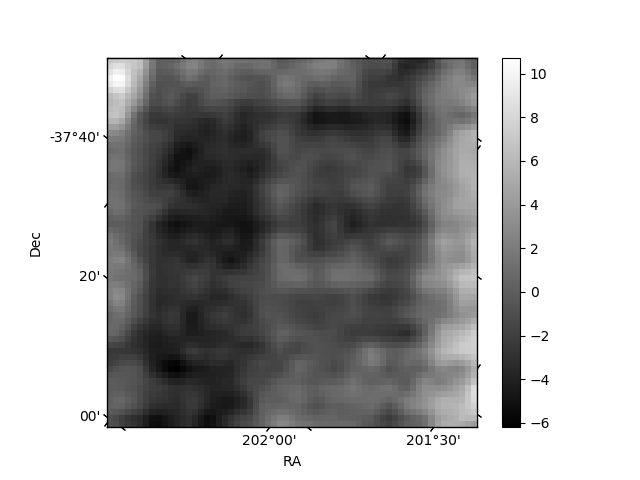
Histogram calculated using DETX and DETY for each event in the final _common_clean file
| Quadrant A | 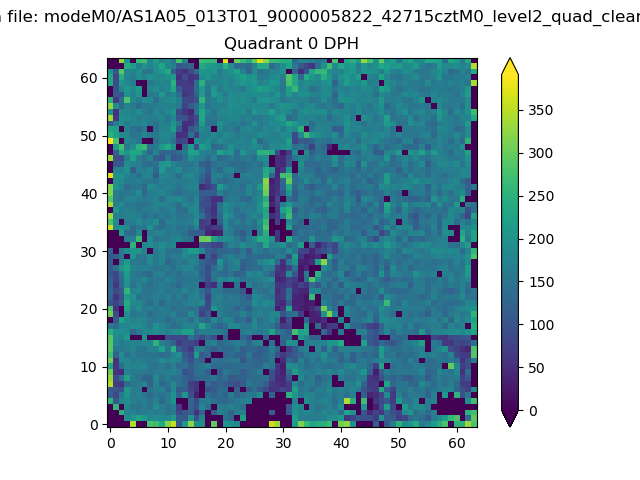 |
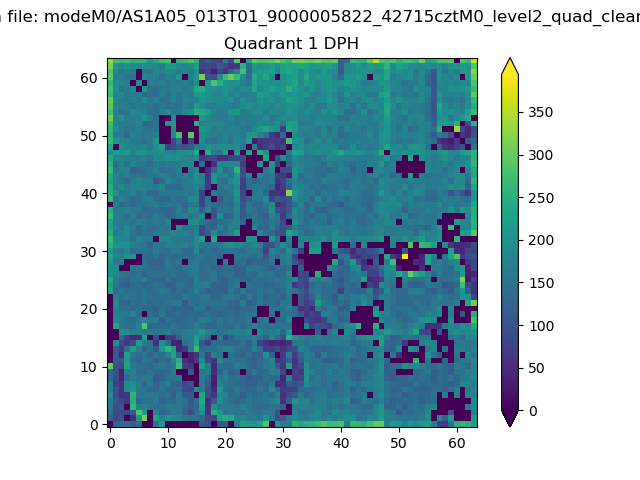 |
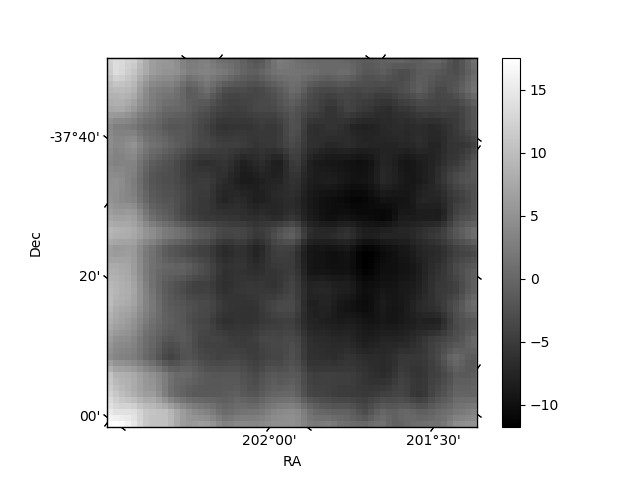
Quadrant B |
|---|---|---|---|
| Quadrant D | 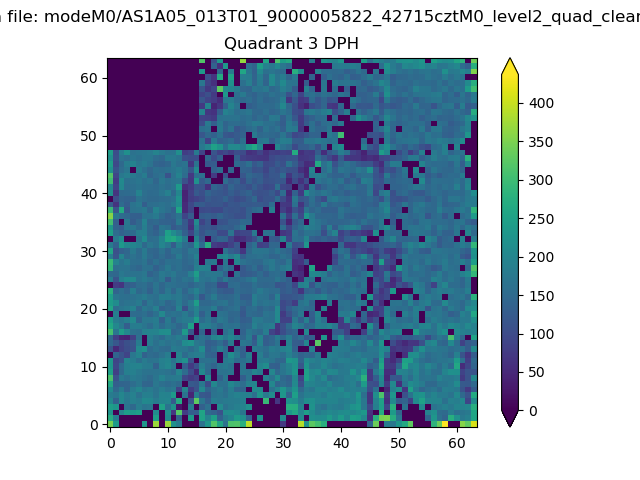 |
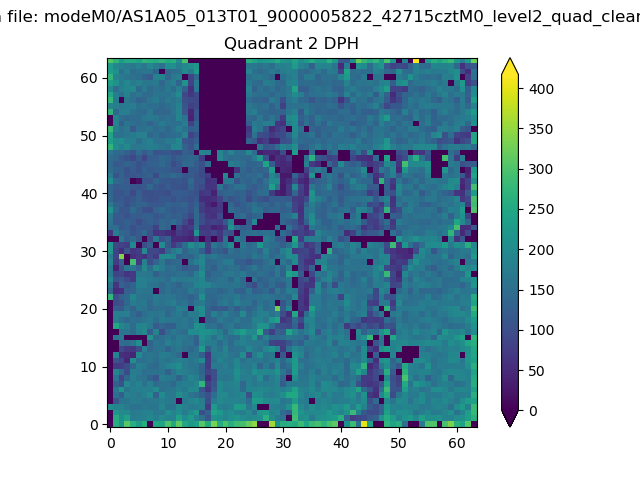 |
Quadrant C |
| Plot type | Count rate plots | Images |
|---|---|---|
| Comparison with Poisson distribution Blue bars denote a histogram of data divided into 1 sec bins. Red curve is a Poisson curve with rate = median count rate of data. |
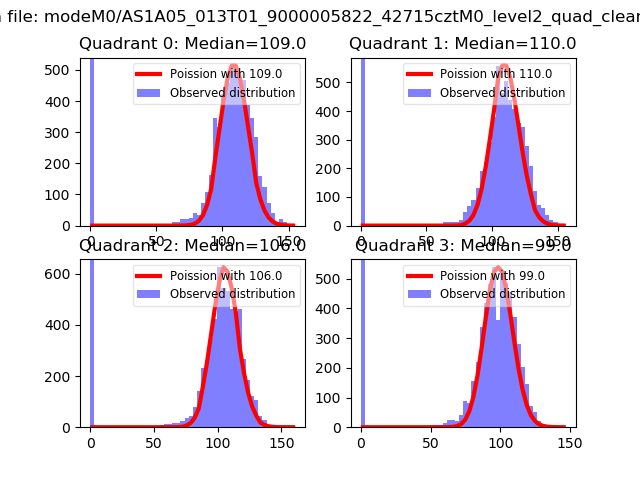 |
 |
| Quadrant-wise count rates Data is divided into 100 sec bins |
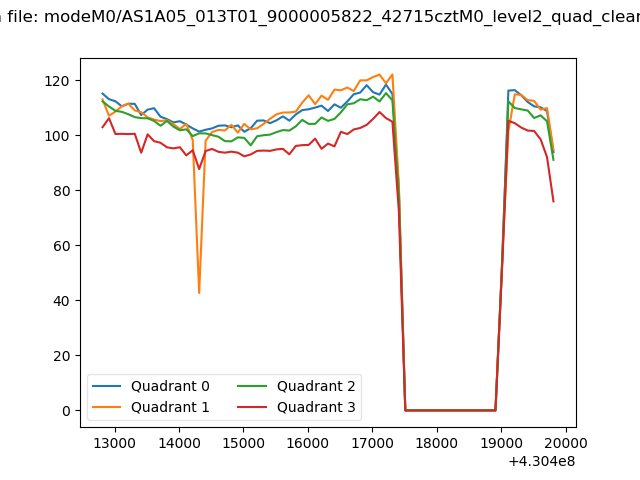 |
|
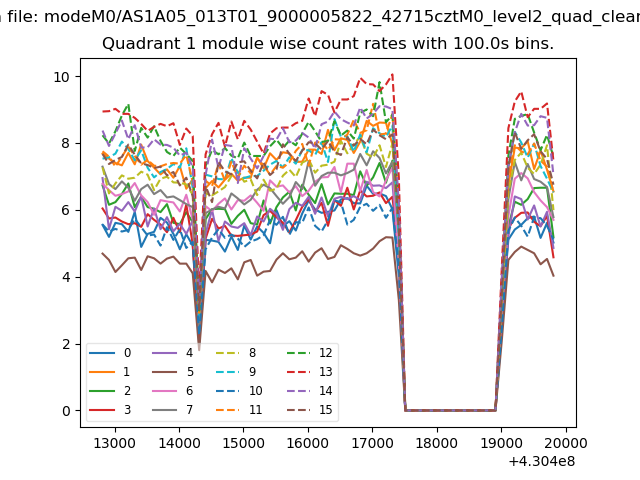
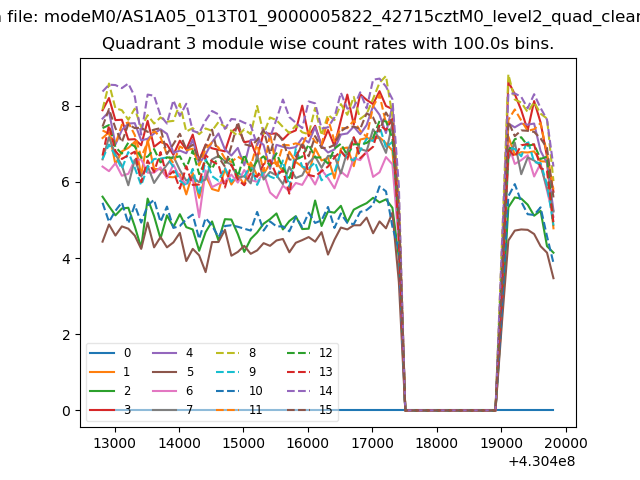
| Module-wise count rates for Quadrant A Data is divided into 100 sec bins |
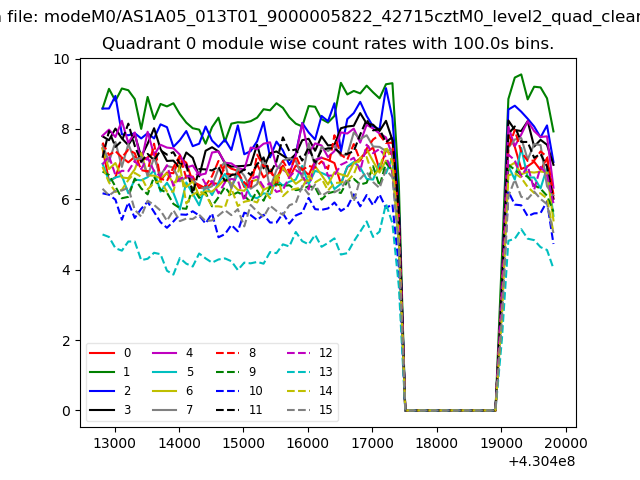 |
 |
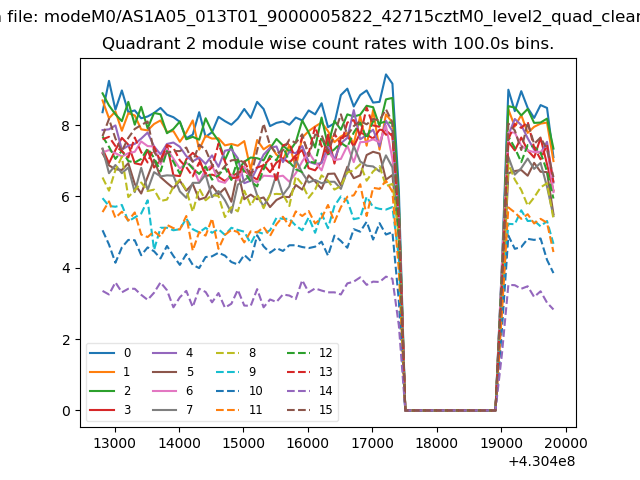
| Module-wise count rates for Quadrant B Data is divided into 100 sec bins |
 |
 |
| Module-wise count rates for Quadrant C Data is divided into 100 sec bins |
 |
 |
| Module-wise count rates for Quadrant D Data is divided into 100 sec bins |
 |
 |
| Parameter | Plot |
|---|---|
| CZT HV Monitor |  |
| D_VDD | 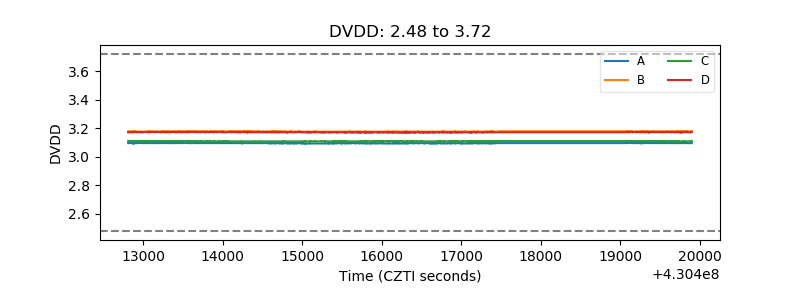 |
| Temperature 1 | 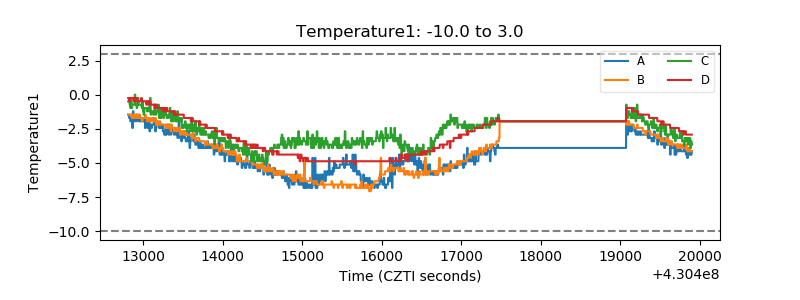 |
| Veto HV Monitor | 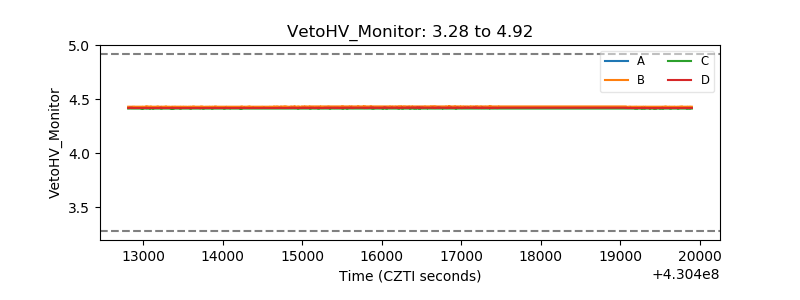 |
| Veto LLD | 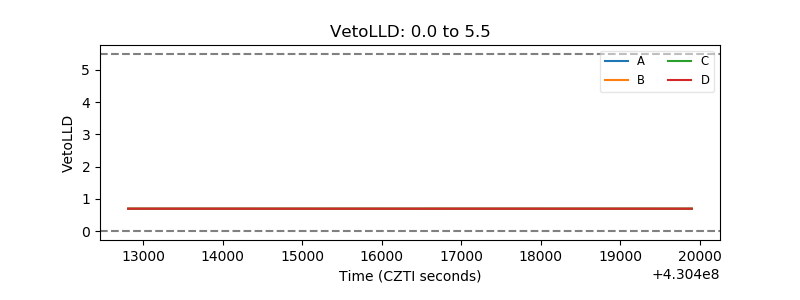 |
| Alpha Counter | 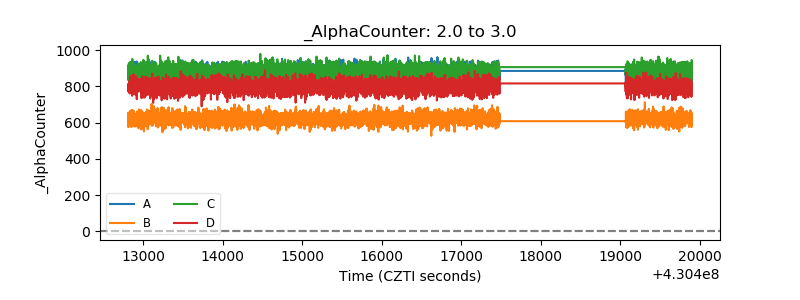 |
| _CPM_Rate | 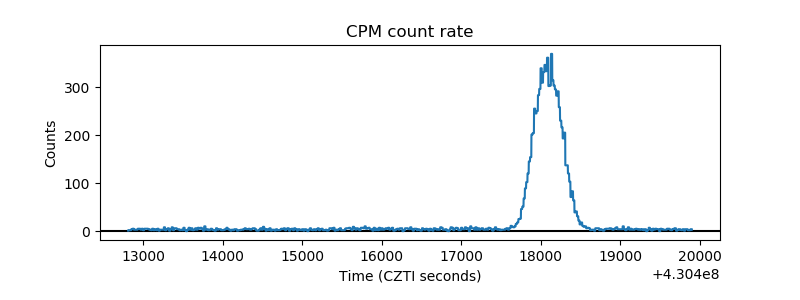 |
| CZT Counter | 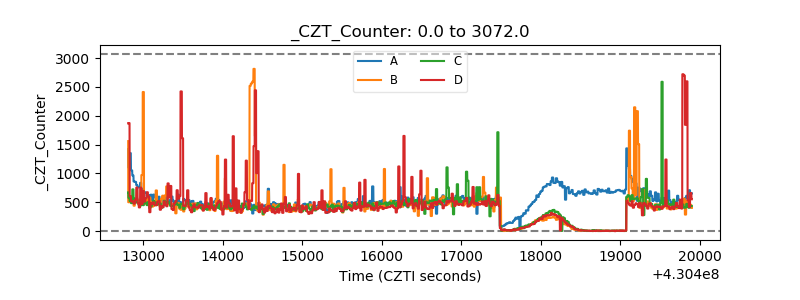 |
| +2.5 Volts monitor | 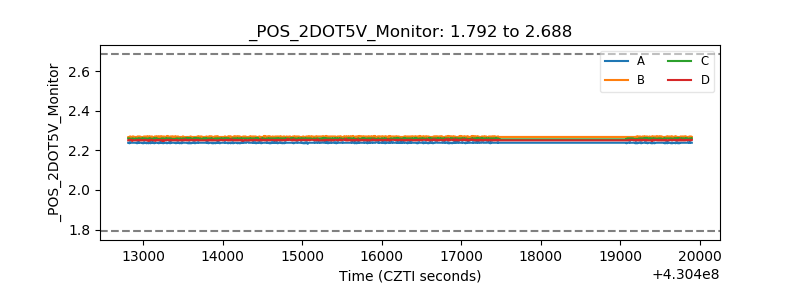 |
| +5 Volts monitor | 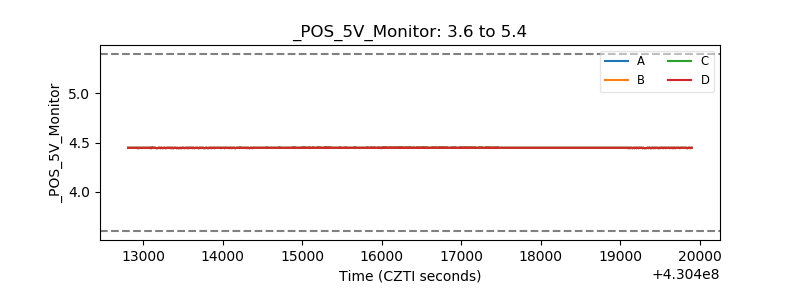 |
| _ROLL_ROT | 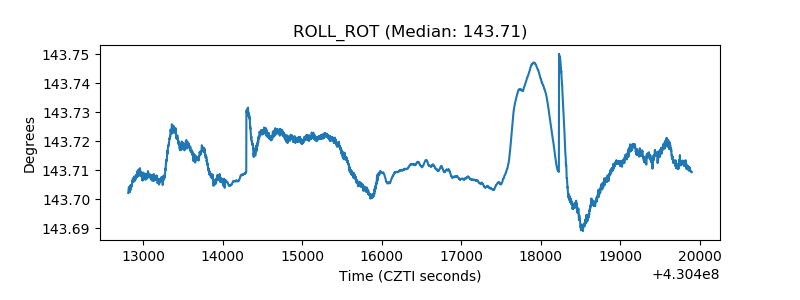 |
| _Roll_DEC | 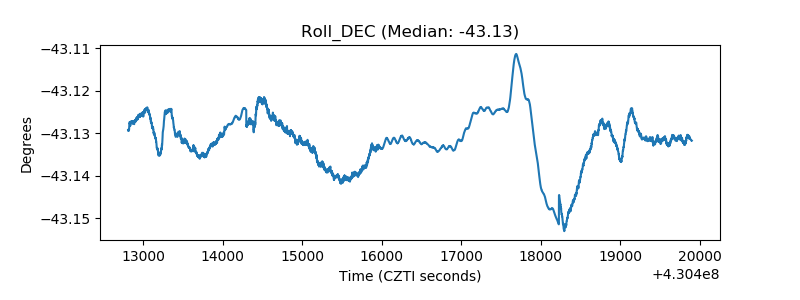 |
| _Roll_RA | 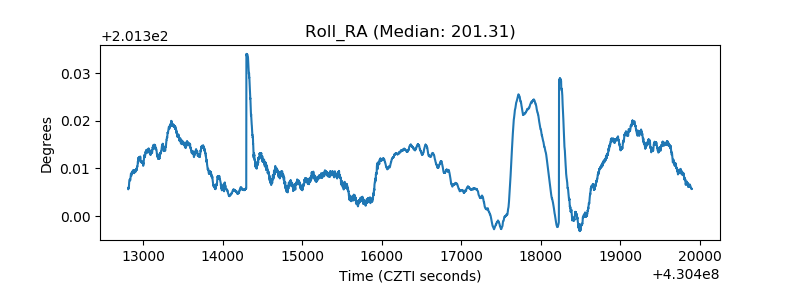 |
| Veto Counter | 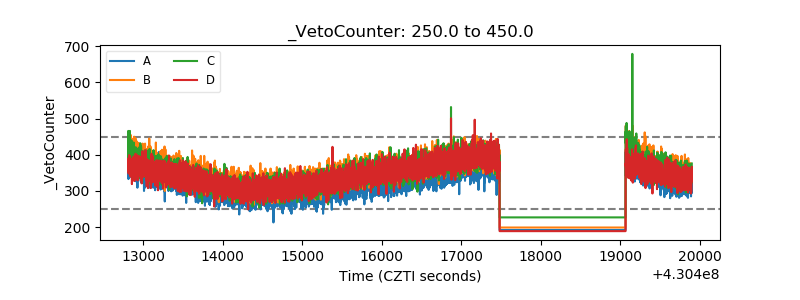 |