| Param | Original file | Final file |
|---|---|---|
| Filename | modeM0/AS1A05_013T01_9000005822_42716cztM0_level2.fits | modeM0/AS1A05_013T01_9000005822_42716cztM0_level2_quad_clean.evt |
| Size (bytes) | 314,988,480 | 89,723,520 |
| Size | 300.4 MB | 85.6 MB |
| Events in quadrant A | 3,130,615 | 604,222 |
| Events in quadrant B | 2,646,265 | 611,626 |
| Events in quadrant C | 2,577,267 | 583,541 |
| Events in quadrant D | 2,878,801 | 533,361 |
| Mode M0 | |||
|---|---|---|---|
| Quadrant | BADHDUFLAG | Total packets | Discarded packets |
| A | 0 | 12714 | 2 |
| B | 0 | 11731 | 2 |
| C | 0 | 11217 | 2 |
| D | 0 | 12575 | 2 |
| Mode M9 | |||
|---|---|---|---|
| Quadrant | BADHDUFLAG | Total packets | Discarded packets |
| A | 0 | 25 | 0 |
| B | 0 | 26 | 0 |
| C | 0 | 26 | 0 |
| D | 0 | 26 | 0 |
| Mode SS | |||
|---|---|---|---|
| Quadrant | BADHDUFLAG | Total packets | Discarded packets |
| A | 0 | 114 | 0 |
| B | 0 | 114 | 0 |
| C | 0 | 114 | 0 |
| D | 0 | 114 | 0 |
| Quadrant | Total seconds | Saturated seconds | Saturation percentage |
|---|---|---|---|
| A | 5477 | 16 | 0.292131% |
| B | 5477 | 48 | 0.876392% |
| C | 5477 | 10 | 0.182582% |
| D | 5477 | 111 | 2.026657% |
Noise dominated data is calculated using 1-second bins in cleaned event files. If a bin has >2000 counts, and if more than 50% of those come from <1% of pixels, then it is considered to be noise-dominated and hence unusable.
| Quadrant | # 1 sec bins | Bins with >0 counts | Bins with >2000 counts | High rate bins dominated by noise | Noise dominated (total time) | Noise dominated (detector-on time) | Marked lightcurve |
|---|---|---|---|---|---|---|---|
| A | 7150 | 5478 | 8 | 8 | 0.11% | 0.15% | 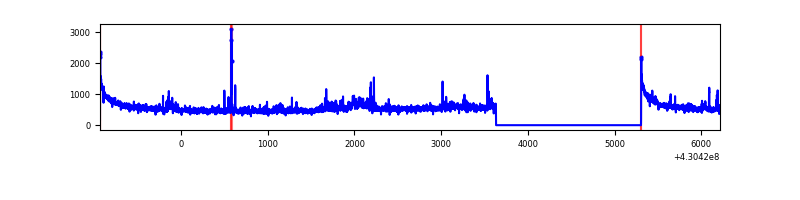 |
| B | 7150 | 5478 | 31 | 31 | 0.43% | 0.57% | 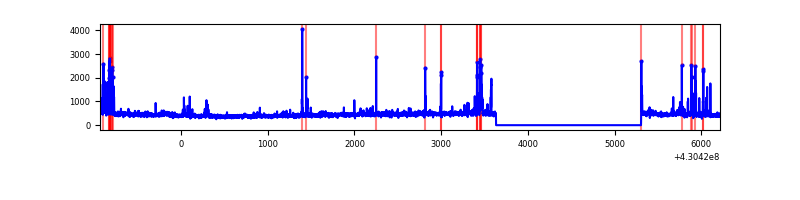 |
| C | 7150 | 5478 | 6 | 6 | 0.08% | 0.11% | 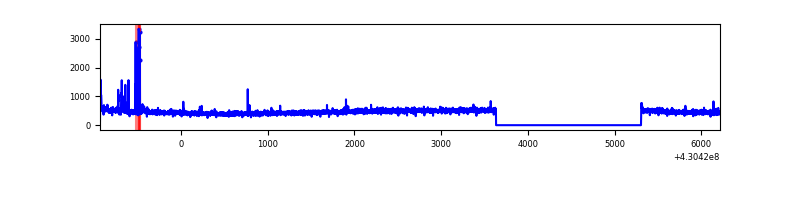 |
| D | 7150 | 5478 | 113 | 113 | 1.58% | 2.06% | 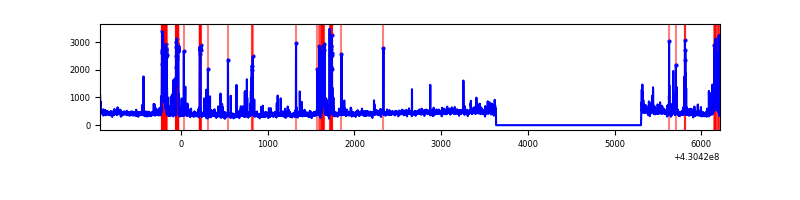 |
Top three noisy pixels from each quadrant. If the there are fewer than three noisy pixels in the level2.evt file, extra rows are filled as -1
| Pixel properties | Quadrant properties | ||||||
|---|---|---|---|---|---|---|---|
| Quadrant | DetID | PixID | Counts | Sigma | Mean | Median | Sigma |
| A | 10 | 83 | 587743 | 4813.09 | 596 | 583 | 122.0 |
| A | 12 | 189 | 173209 | 1415.06 | 596 | 583 | 122.0 |
| A | 15 | 237 | 17152 | 135.82 | 596 | 583 | 122.0 |
| B | 5 | 255 | 119971 | 1024.78 | 593 | 576 | 116.5 |
| B | 15 | 85 | 78800 | 671.41 | 593 | 576 | 116.5 |
| B | 5 | 172 | 46777 | 396.55 | 593 | 576 | 116.5 |
| C | 15 | 214 | 229349 | 1685.03 | 577 | 581 | 135.8 |
| C | 0 | 239 | 56369 | 410.92 | 577 | 581 | 135.8 |
| C | 3 | 233 | 27433 | 197.78 | 577 | 581 | 135.8 |
| D | 12 | 233 | 243173 | 1733.04 | 572 | 556 | 140.0 |
| D | 2 | 249 | 172600 | 1228.93 | 572 | 556 | 140.0 |
| D | 12 | 6 | 127075 | 903.74 | 572 | 556 | 140.0 |
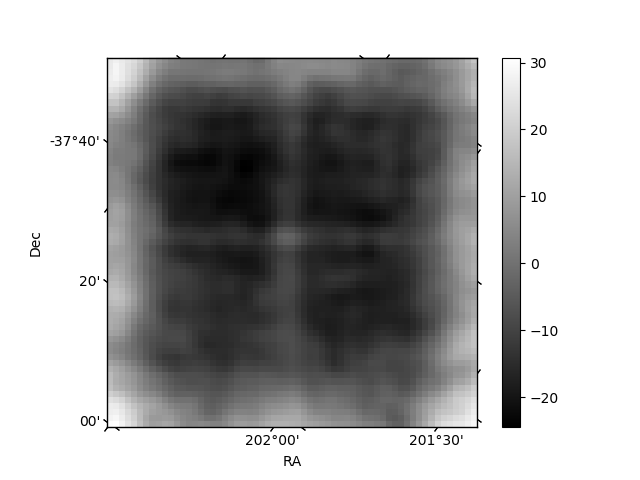
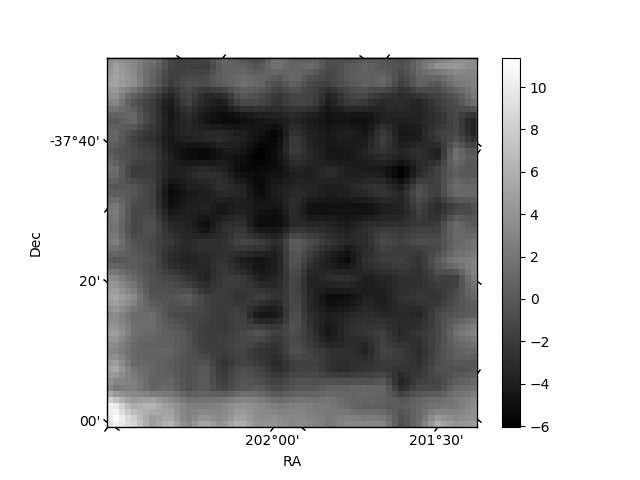
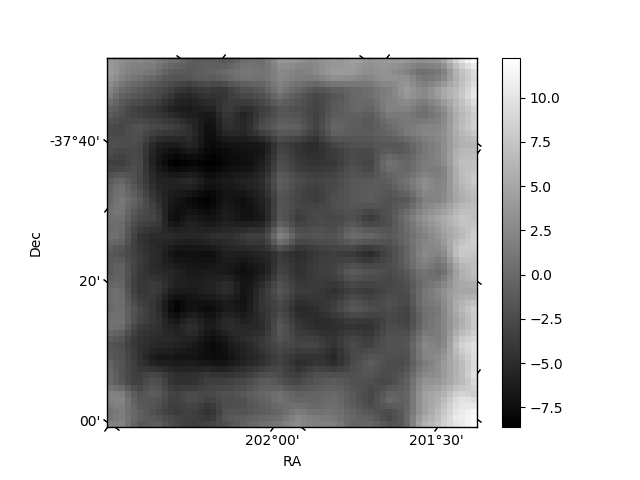
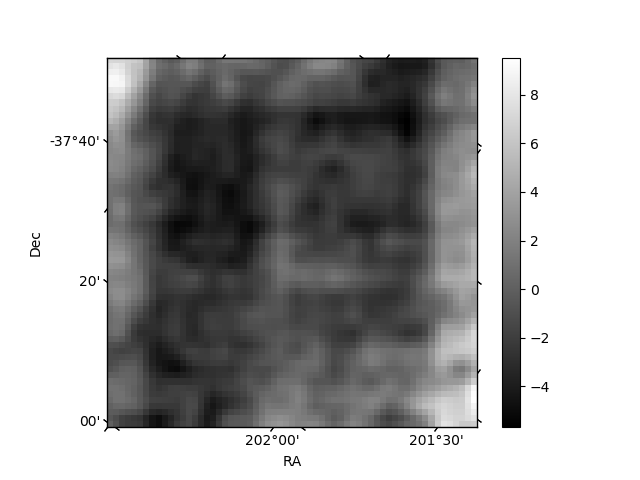
Histogram calculated using DETX and DETY for each event in the final _common_clean file
| Quadrant A | 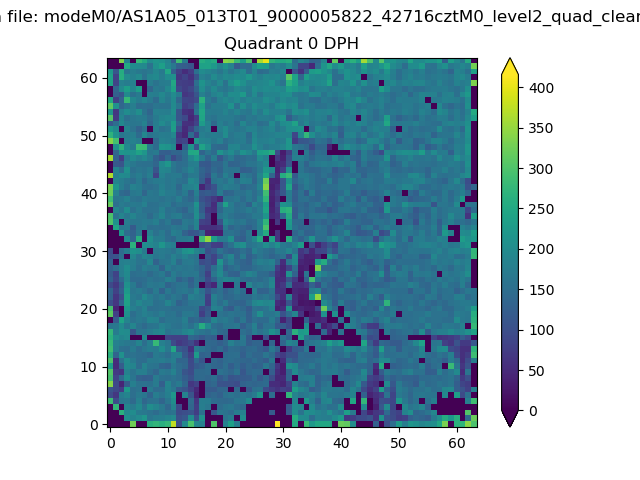 |
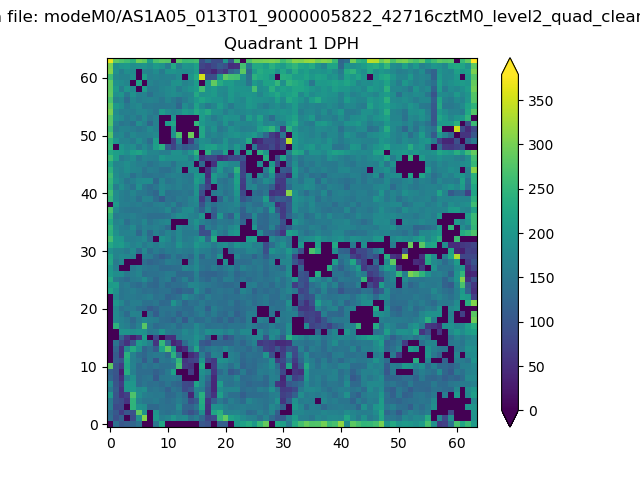 |
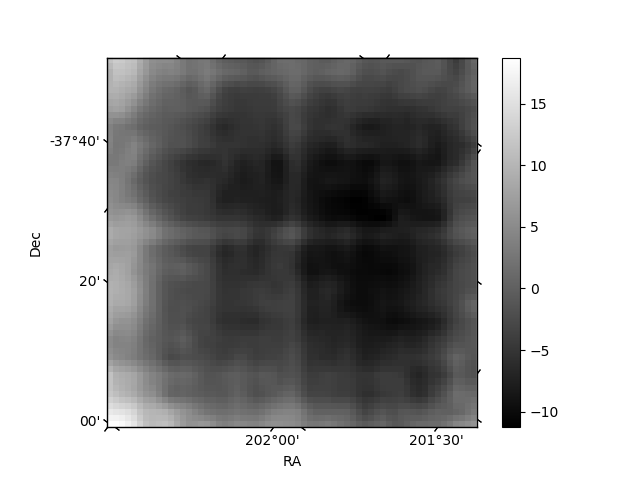
Quadrant B |
|---|---|---|---|
| Quadrant D | 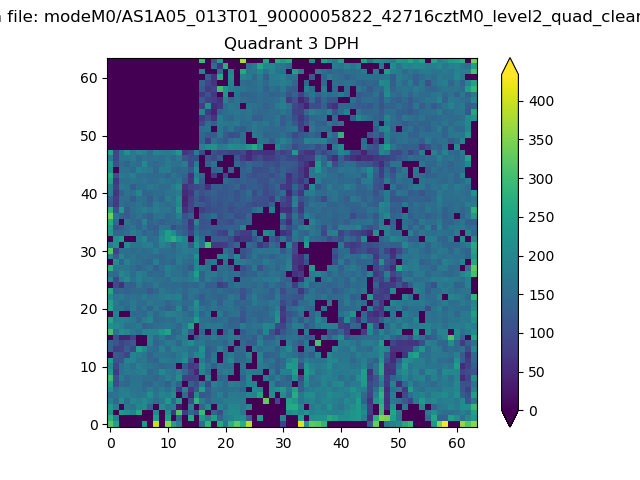 |
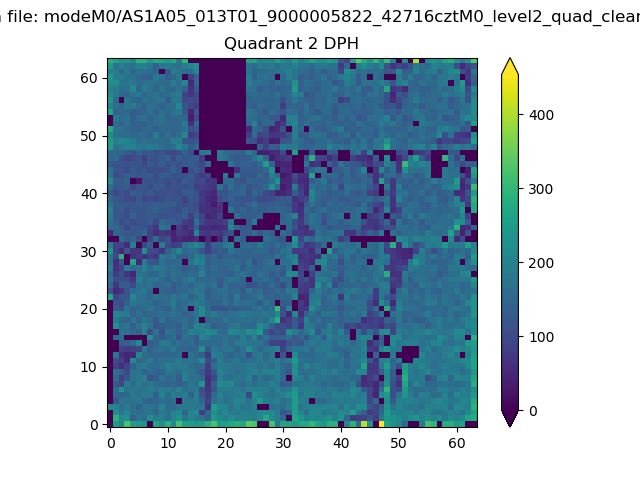 |
Quadrant C |
| Plot type | Count rate plots | Images |
|---|---|---|
| Comparison with Poisson distribution Blue bars denote a histogram of data divided into 1 sec bins. Red curve is a Poisson curve with rate = median count rate of data. |
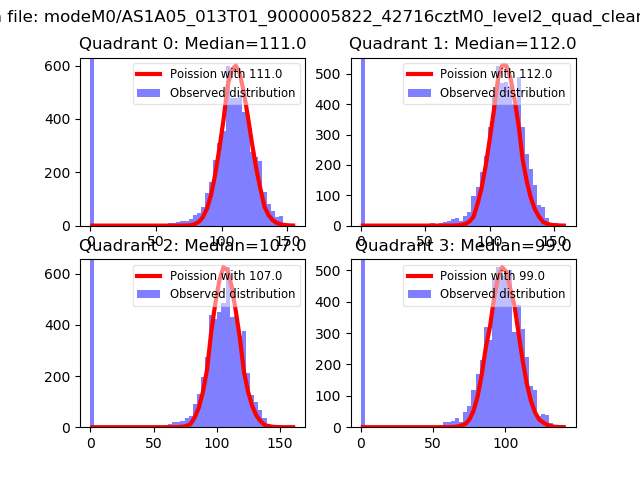 |
 |
| Quadrant-wise count rates Data is divided into 100 sec bins |
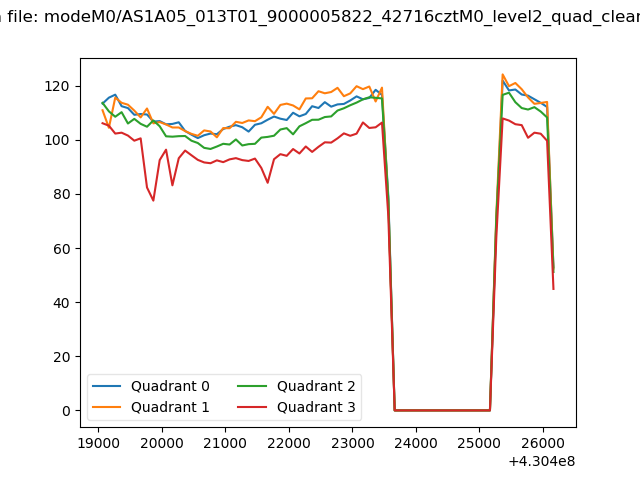 |
|
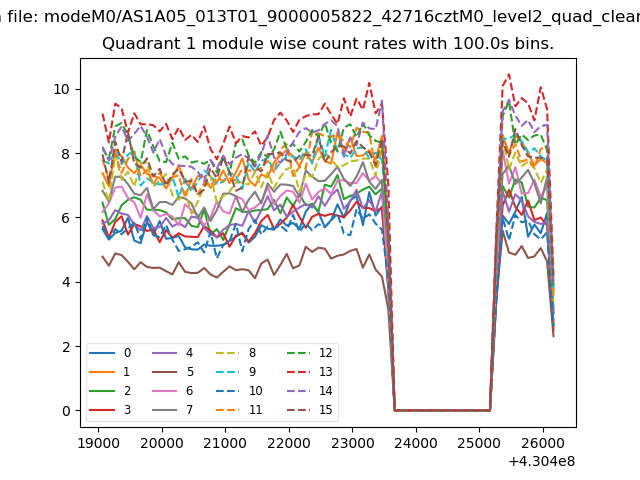
| Module-wise count rates for Quadrant A Data is divided into 100 sec bins |
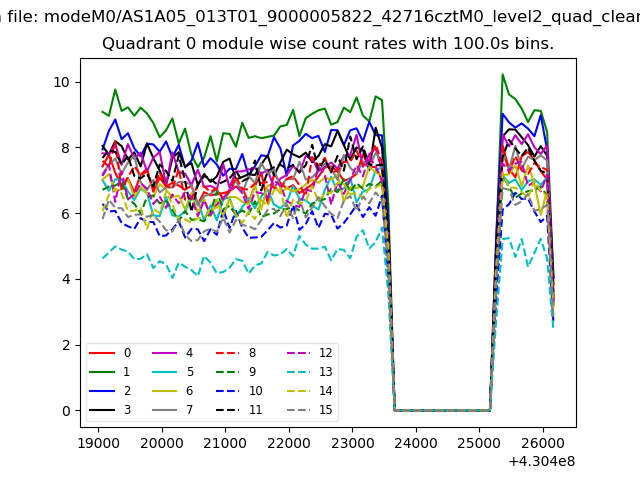 |
 |
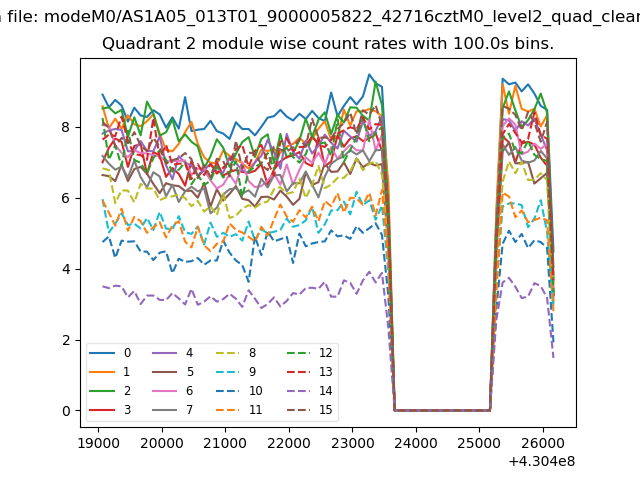
| Module-wise count rates for Quadrant B Data is divided into 100 sec bins |
 |
 |
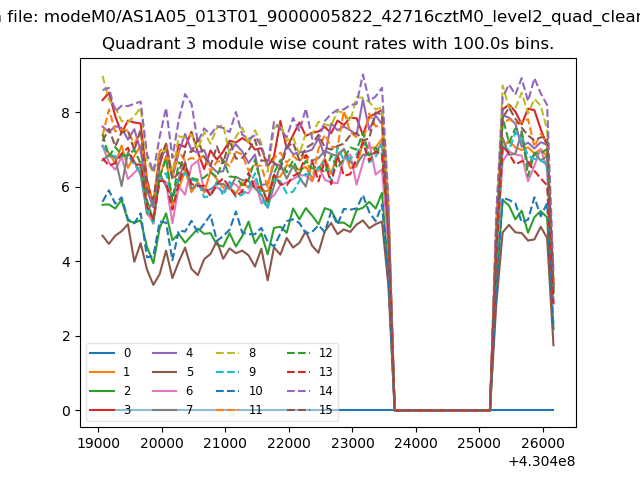
| Module-wise count rates for Quadrant C Data is divided into 100 sec bins |
 |
 |
| Module-wise count rates for Quadrant D Data is divided into 100 sec bins |
 |
 |
| Parameter | Plot |
|---|---|
| CZT HV Monitor | 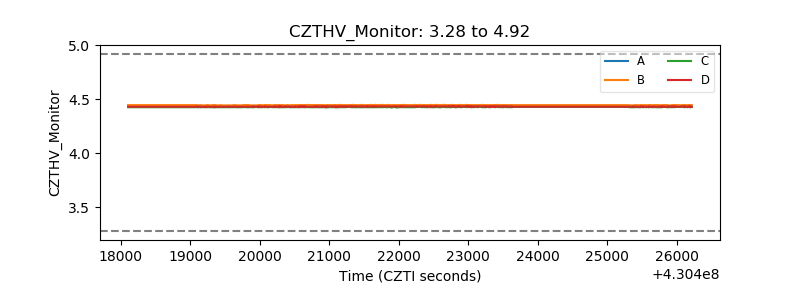 |
| D_VDD | 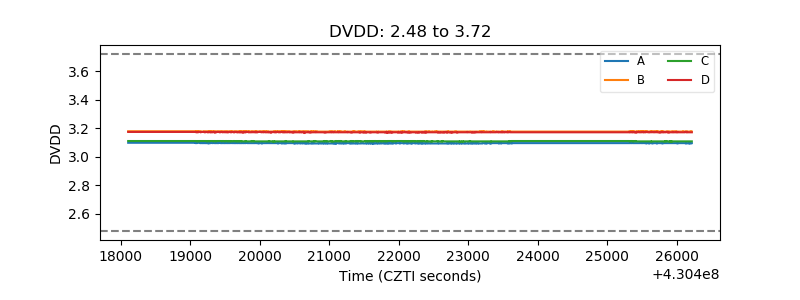 |
| Temperature 1 | 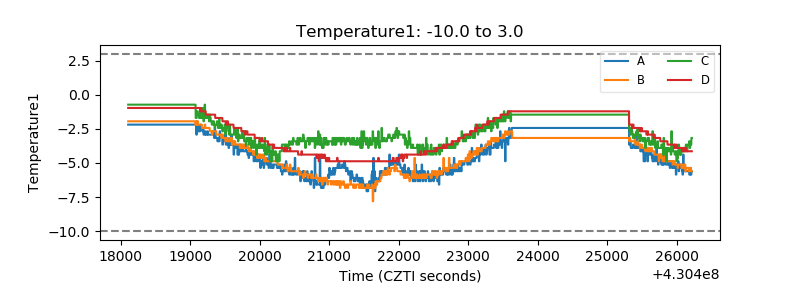 |
| Veto HV Monitor | 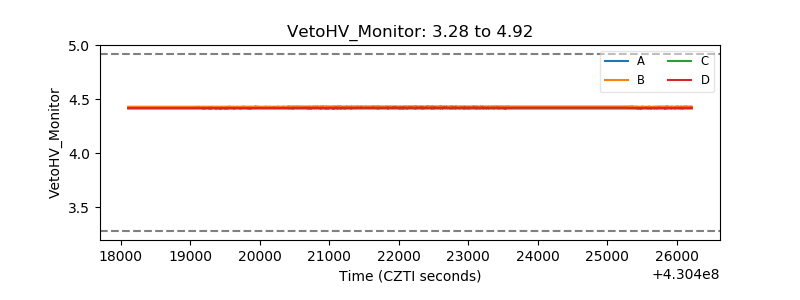 |
| Veto LLD | 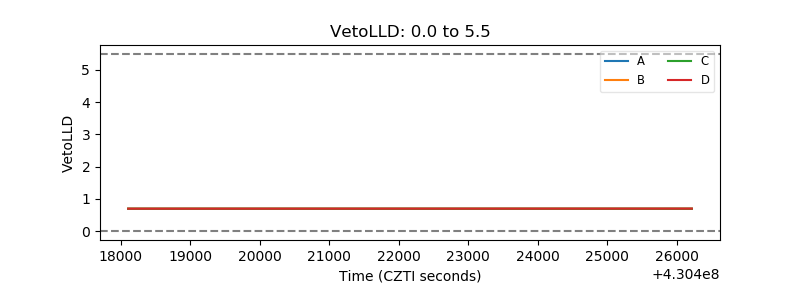 |
| Alpha Counter | 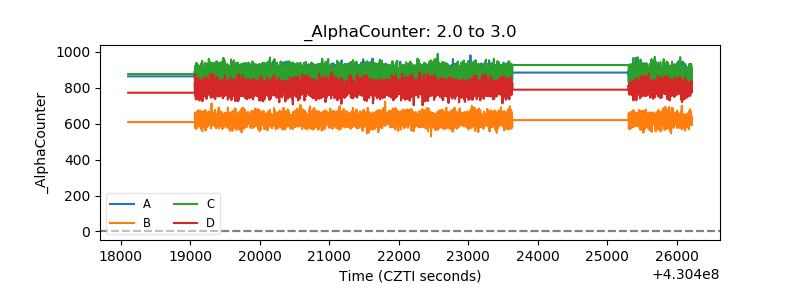 |
| _CPM_Rate | 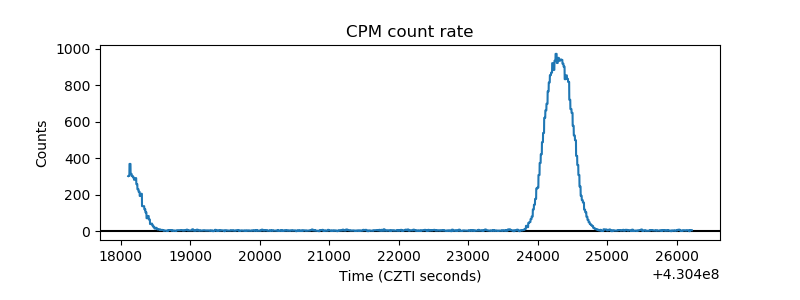 |
| CZT Counter | 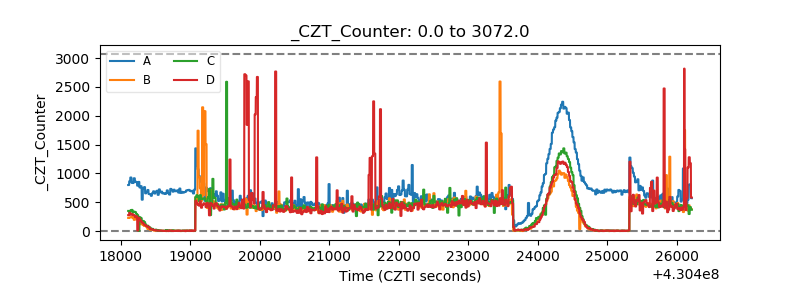 |
| +2.5 Volts monitor | 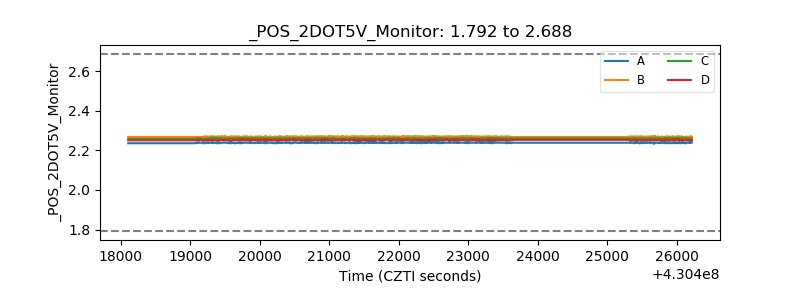 |
| +5 Volts monitor |  |
| _ROLL_ROT | 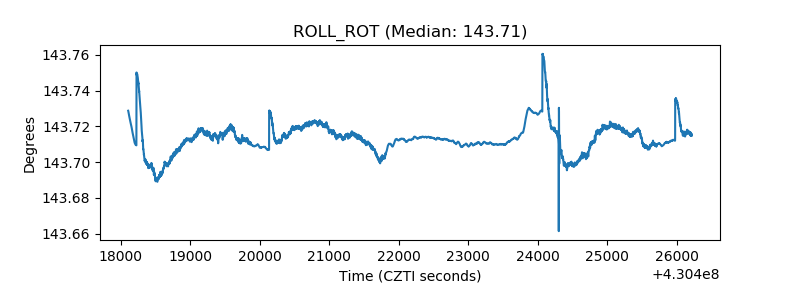 |
| _Roll_DEC | 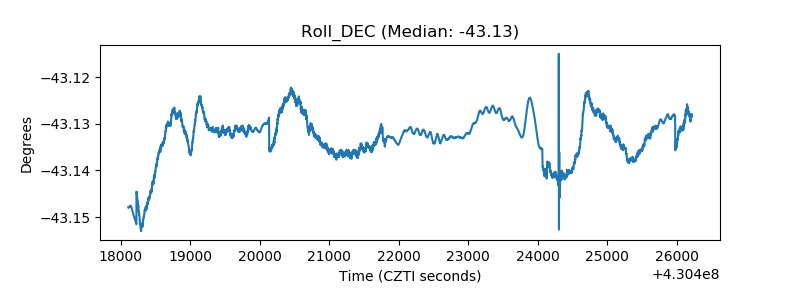 |
| _Roll_RA | 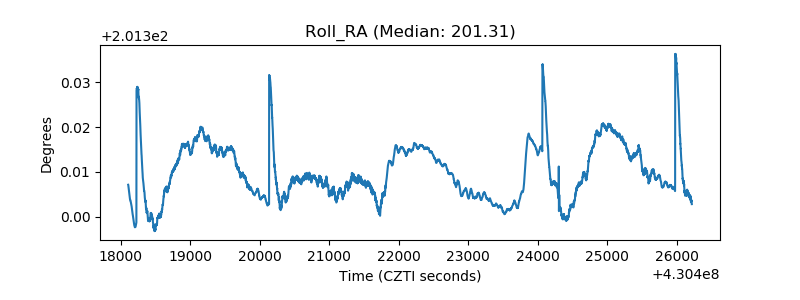 |
| Veto Counter | 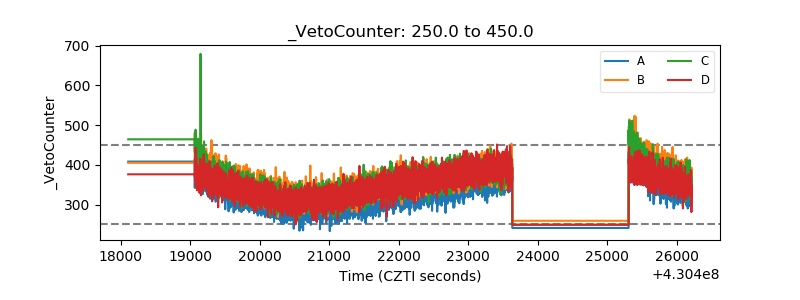 |