| Param | Original file | Final file |
|---|---|---|
| Filename | modeM0/AS1A05_013T01_9000005822_42718cztM0_level2.fits | modeM0/AS1A05_013T01_9000005822_42718cztM0_level2_quad_clean.evt |
| Size (bytes) | 305,568,000 | 87,811,200 |
| Size | 291.4 MB | 83.7 MB |
| Events in quadrant A | 2,937,614 | 593,961 |
| Events in quadrant B | 2,423,786 | 607,174 |
| Events in quadrant C | 2,461,108 | 573,295 |
| Events in quadrant D | 3,081,590 | 518,418 |
| Mode M0 | |||
|---|---|---|---|
| Quadrant | BADHDUFLAG | Total packets | Discarded packets |
| A | 0 | 11864 | 2 |
| B | 0 | 10822 | 2 |
| C | 0 | 10562 | 2 |
| D | 0 | 12897 | 2 |
| Mode M9 | |||
|---|---|---|---|
| Quadrant | BADHDUFLAG | Total packets | Discarded packets |
| A | 0 | 26 | 0 |
| B | 0 | 27 | 0 |
| C | 0 | 27 | 0 |
| D | 0 | 27 | 0 |
| Mode SS | |||
|---|---|---|---|
| Quadrant | BADHDUFLAG | Total packets | Discarded packets |
| A | 0 | 108 | 0 |
| B | 0 | 108 | 0 |
| C | 0 | 108 | 0 |
| D | 0 | 108 | 0 |
| Quadrant | Total seconds | Saturated seconds | Saturation percentage |
|---|---|---|---|
| A | 5220 | 18 | 0.344828% |
| B | 5220 | 18 | 0.344828% |
| C | 5220 | 5 | 0.095785% |
| D | 5220 | 170 | 3.256705% |
Noise dominated data is calculated using 1-second bins in cleaned event files. If a bin has >2000 counts, and if more than 50% of those come from <1% of pixels, then it is considered to be noise-dominated and hence unusable.
| Quadrant | # 1 sec bins | Bins with >0 counts | Bins with >2000 counts | High rate bins dominated by noise | Noise dominated (total time) | Noise dominated (detector-on time) | Marked lightcurve |
|---|---|---|---|---|---|---|---|
| A | 7043 | 5221 | 11 | 11 | 0.16% | 0.21% | 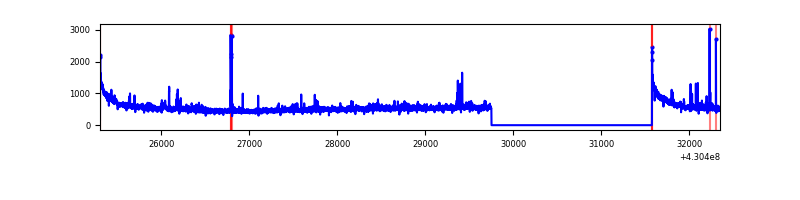 |
| B | 7043 | 5221 | 12 | 12 | 0.17% | 0.23% | 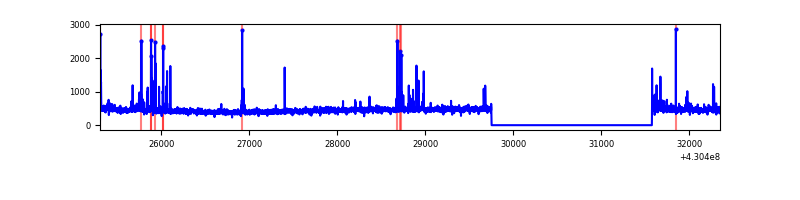 |
| C | 7043 | 5221 | 0 | 0 | 0.00% | 0.00% | 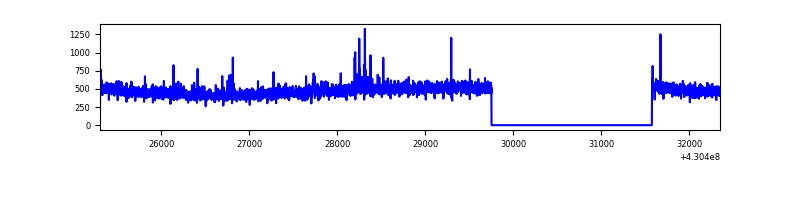 |
| D | 7043 | 5221 | 154 | 154 | 2.19% | 2.95% | 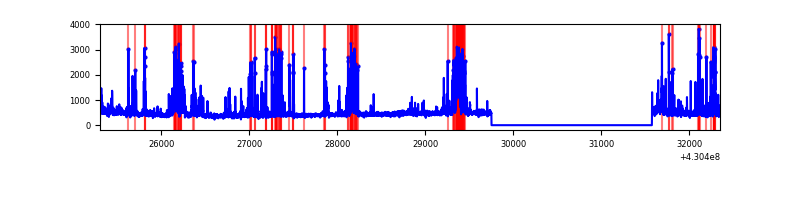 |
Top three noisy pixels from each quadrant. If the there are fewer than three noisy pixels in the level2.evt file, extra rows are filled as -1
| Pixel properties | Quadrant properties | ||||||
|---|---|---|---|---|---|---|---|
| Quadrant | DetID | PixID | Counts | Sigma | Mean | Median | Sigma |
| A | 10 | 83 | 554424 | 4637.32 | 580 | 570 | 119.4 |
| A | 12 | 189 | 52825 | 437.52 | 580 | 570 | 119.4 |
| A | 13 | 248 | 45448 | 375.76 | 580 | 570 | 119.4 |
| B | 5 | 255 | 61149 | 544.22 | 577 | 561 | 111.3 |
| B | 5 | 172 | 38122 | 337.38 | 577 | 561 | 111.3 |
| B | 0 | 230 | 16030 | 138.95 | 577 | 561 | 111.3 |
| C | 15 | 214 | 218889 | 1678.0 | 560 | 565 | 130.1 |
| C | 2 | 16 | 20739 | 155.05 | 560 | 565 | 130.1 |
| C | 8 | 79 | 17219 | 128.0 | 560 | 565 | 130.1 |
| D | 2 | 249 | 443719 | 3310.05 | 551 | 535 | 133.9 |
| D | 12 | 6 | 206889 | 1541.21 | 551 | 535 | 133.9 |
| D | 12 | 233 | 93527 | 694.54 | 551 | 535 | 133.9 |
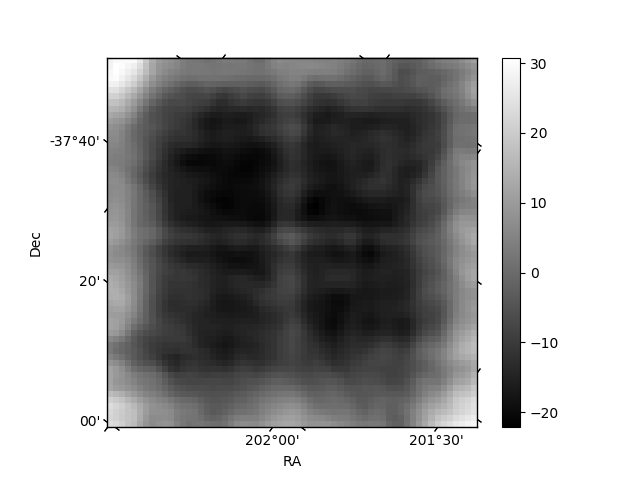
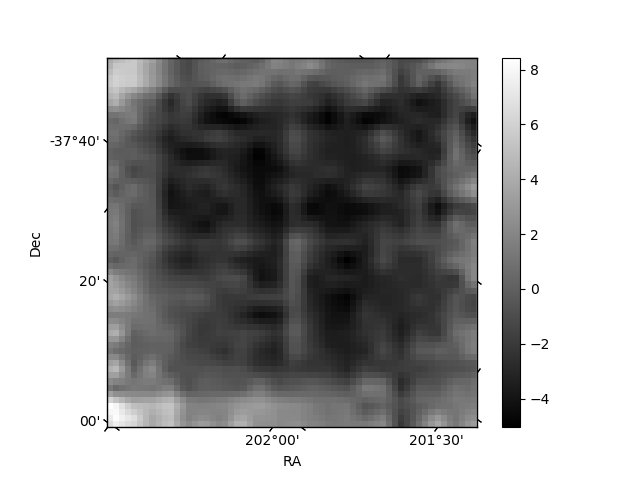
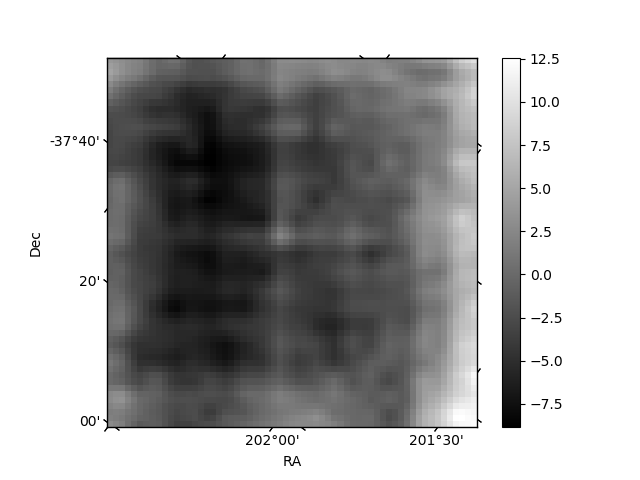
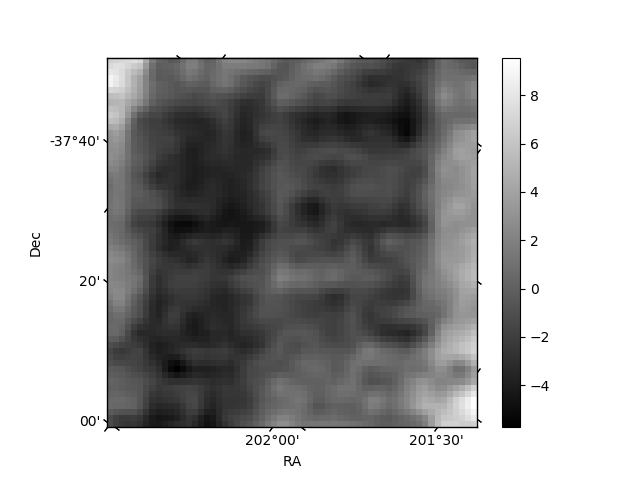
Histogram calculated using DETX and DETY for each event in the final _common_clean file
| Quadrant A | 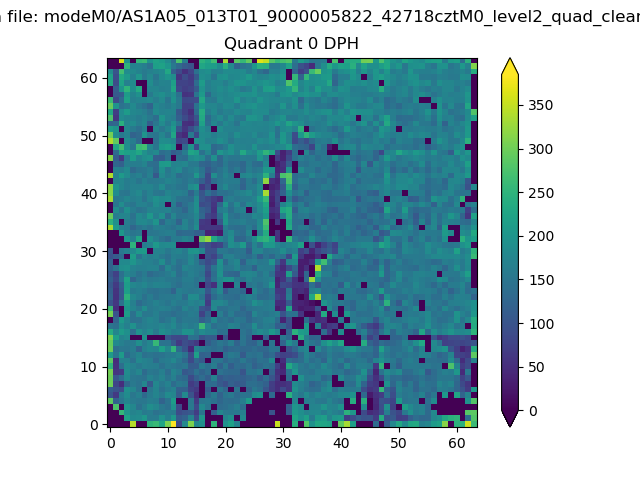 |
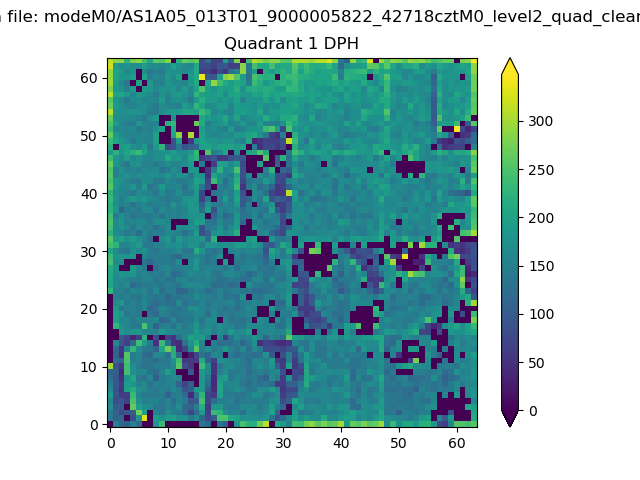 |
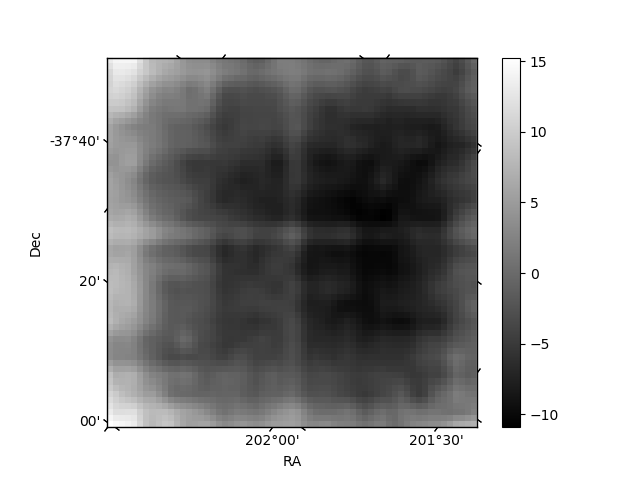
Quadrant B |
|---|---|---|---|
| Quadrant D | 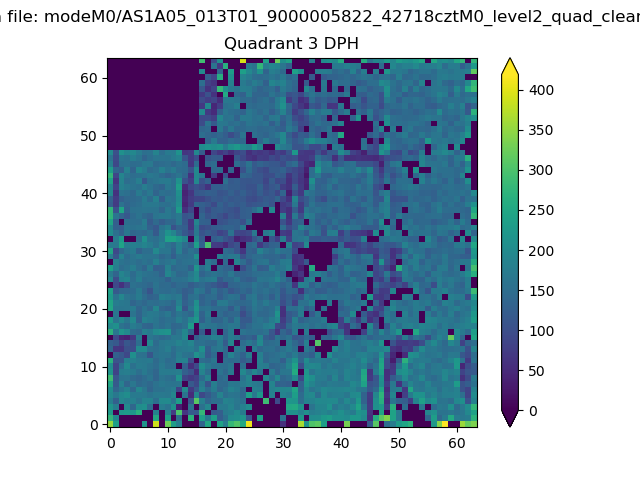 |
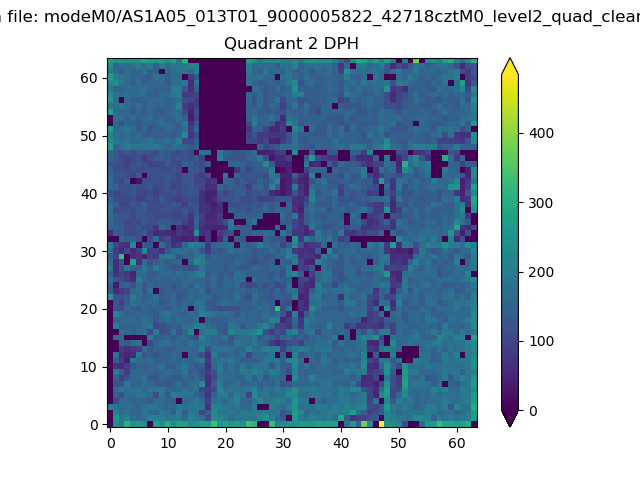 |
Quadrant C |
| Plot type | Count rate plots | Images |
|---|---|---|
| Comparison with Poisson distribution Blue bars denote a histogram of data divided into 1 sec bins. Red curve is a Poisson curve with rate = median count rate of data. |
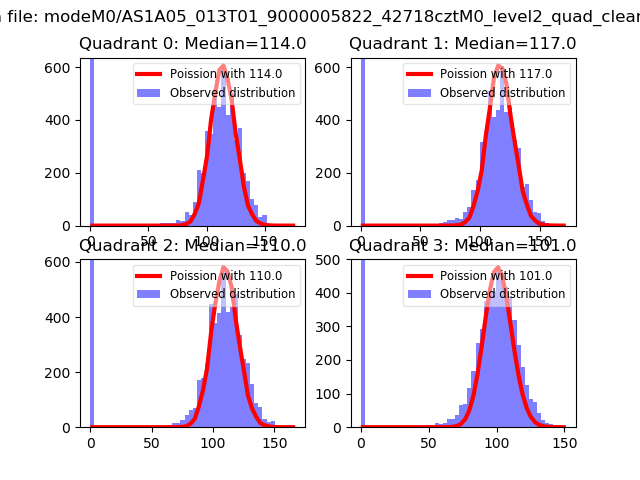 |
 |
| Quadrant-wise count rates Data is divided into 100 sec bins |
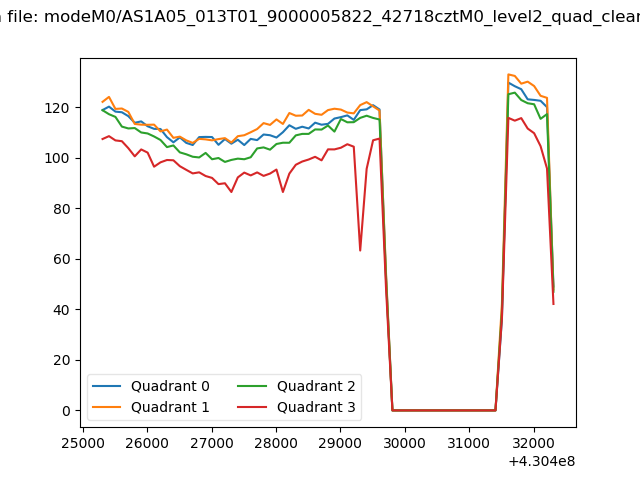 |
|
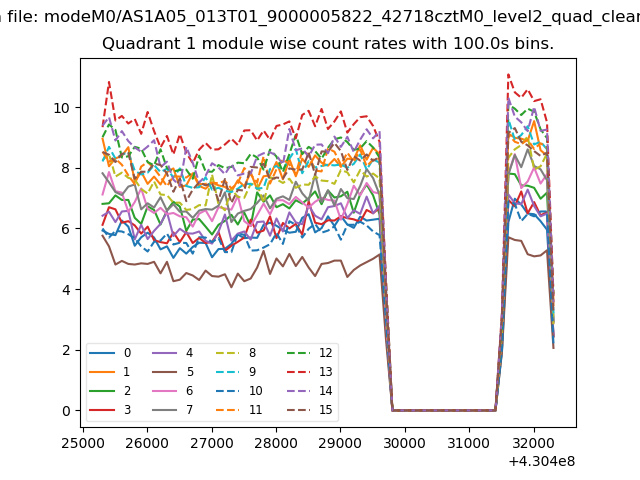
| Module-wise count rates for Quadrant A Data is divided into 100 sec bins |
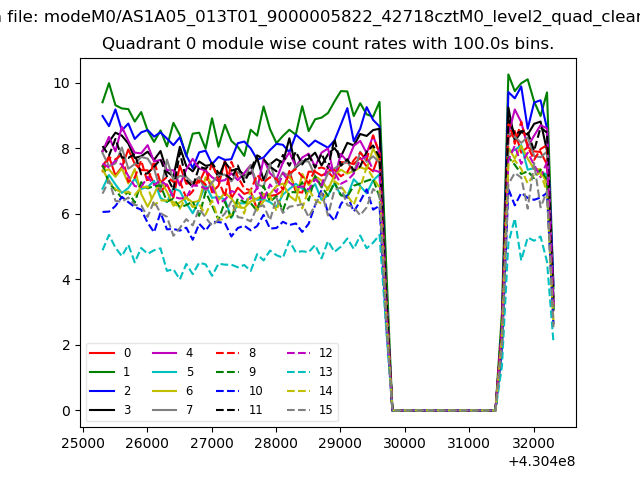 |
 |
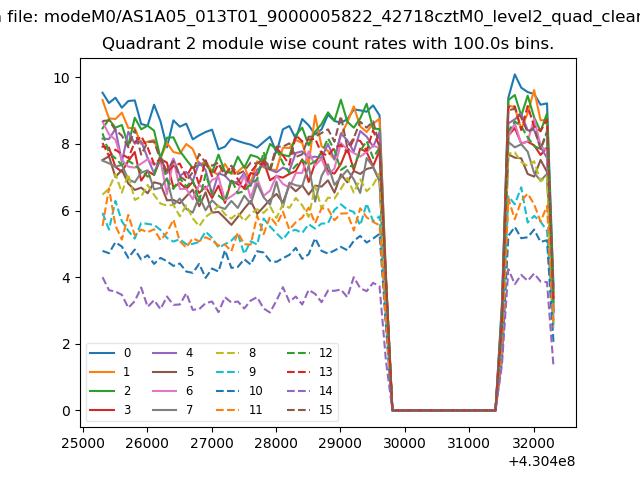
| Module-wise count rates for Quadrant B Data is divided into 100 sec bins |
 |
 |
| Module-wise count rates for Quadrant C Data is divided into 100 sec bins |
 |
 |
| Module-wise count rates for Quadrant D Data is divided into 100 sec bins |
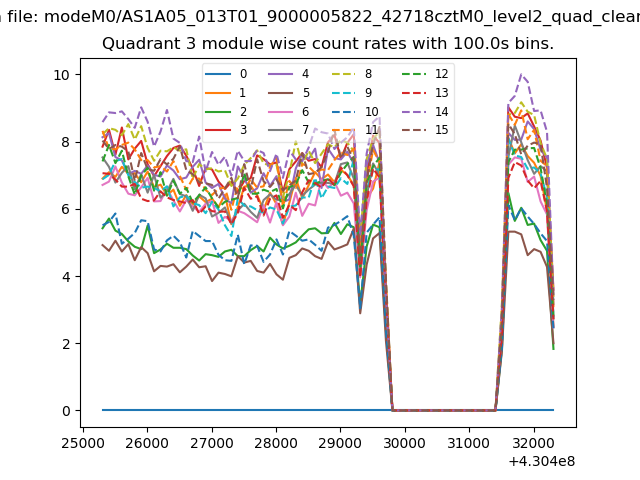 |
 |
| Parameter | Plot |
|---|---|
| CZT HV Monitor | 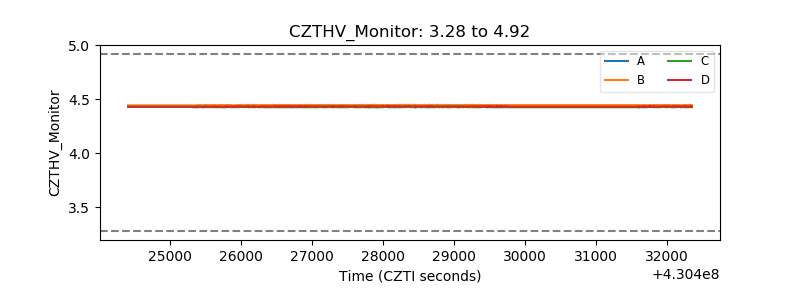 |
| D_VDD | 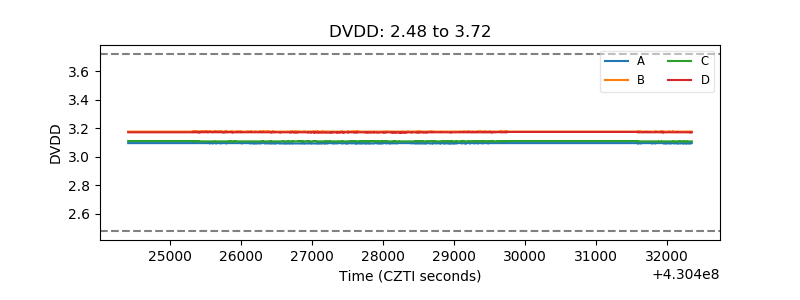 |
| Temperature 1 | 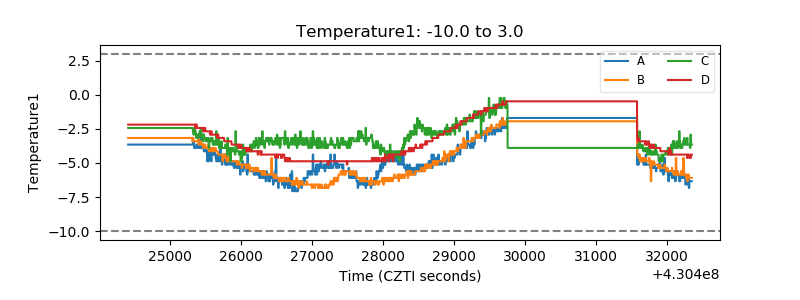 |
| Veto HV Monitor | 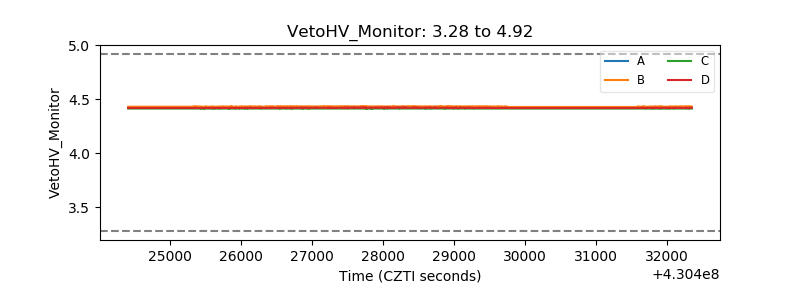 |
| Veto LLD | 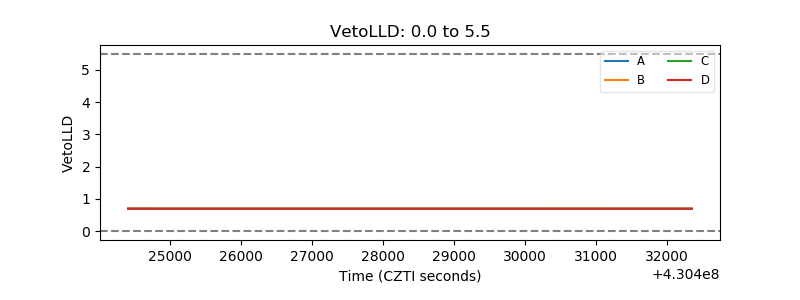 |
| Alpha Counter | 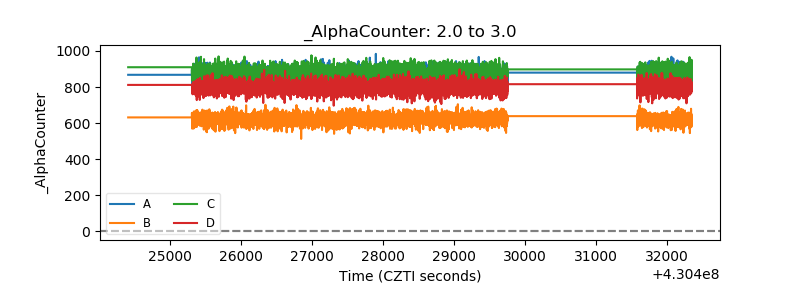 |
| _CPM_Rate | 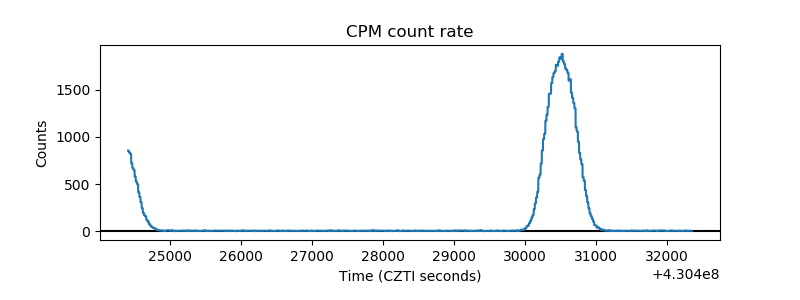 |
| CZT Counter | 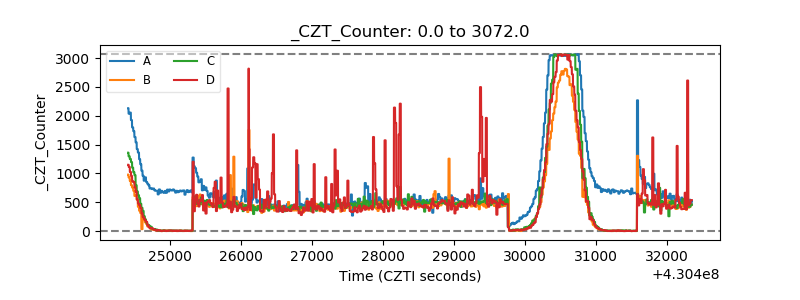 |
| +2.5 Volts monitor | 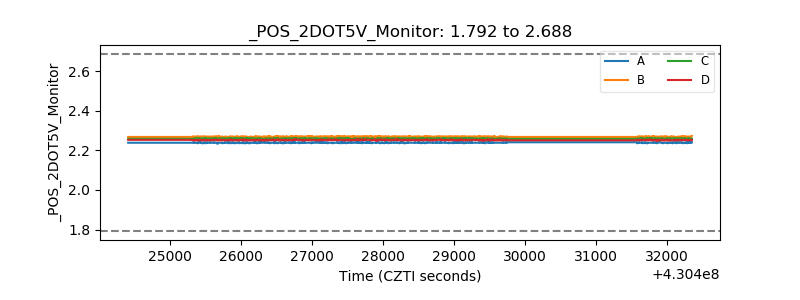 |
| +5 Volts monitor | 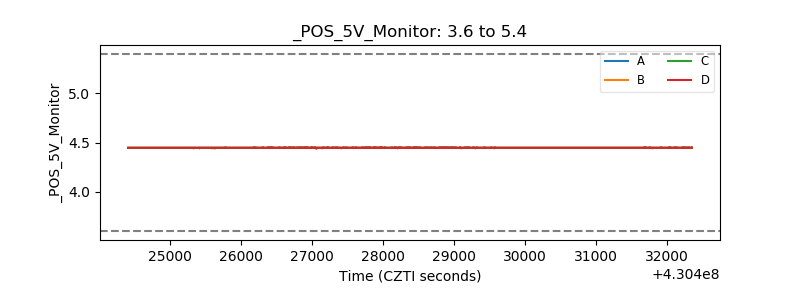 |
| _ROLL_ROT | 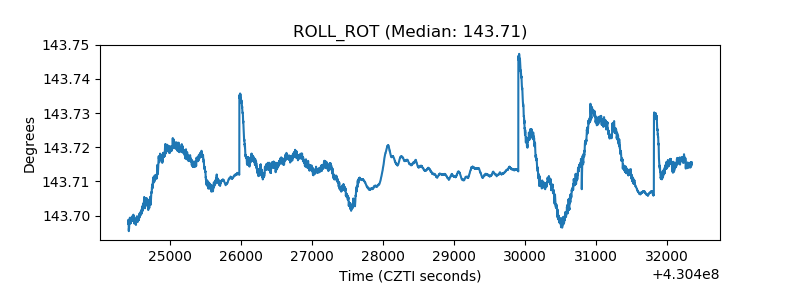 |
| _Roll_DEC | 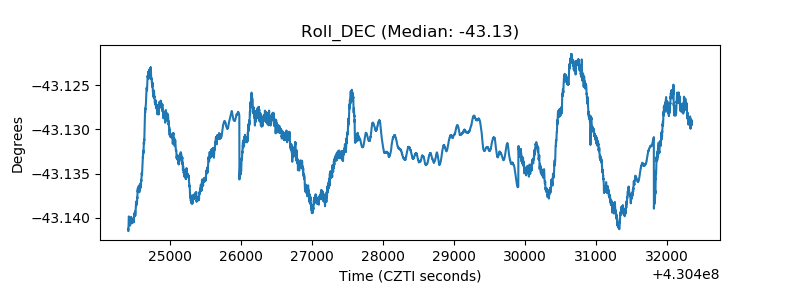 |
| _Roll_RA | 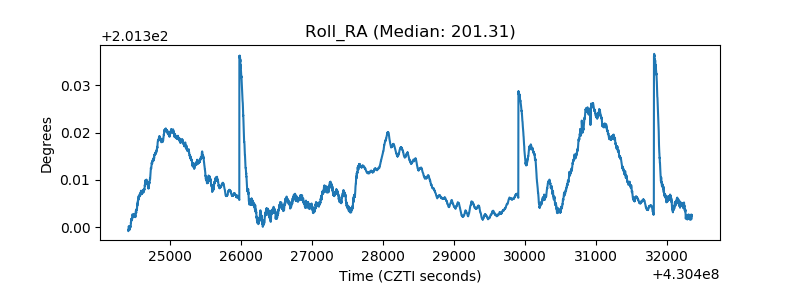 |
| Veto Counter | 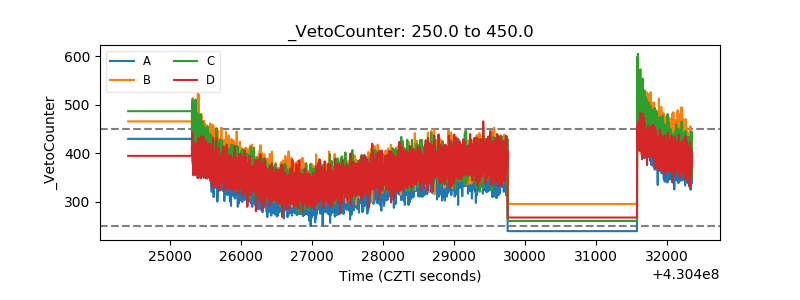 |