| Param | Original file | Final file |
|---|---|---|
| Filename | modeM0/AS1A05_013T01_9000005822_42719cztM0_level2.fits | modeM0/AS1A05_013T01_9000005822_42719cztM0_level2_quad_clean.evt |
| Size (bytes) | 298,316,160 | 88,534,080 |
| Size | 284.5 MB | 84.4 MB |
| Events in quadrant A | 2,921,740 | 602,605 |
| Events in quadrant B | 2,486,414 | 617,122 |
| Events in quadrant C | 2,488,733 | 579,895 |
| Events in quadrant D | 2,752,349 | 527,924 |
| Mode M0 | |||
|---|---|---|---|
| Quadrant | BADHDUFLAG | Total packets | Discarded packets |
| A | 0 | 11637 | 2 |
| B | 0 | 10657 | 2 |
| C | 0 | 10284 | 2 |
| D | 0 | 11754 | 2 |
| Mode M9 | |||
|---|---|---|---|
| Quadrant | BADHDUFLAG | Total packets | Discarded packets |
| A | 0 | 28 | 0 |
| B | 0 | 29 | 0 |
| C | 0 | 29 | 0 |
| D | 0 | 29 | 0 |
| Mode SS | |||
|---|---|---|---|
| Quadrant | BADHDUFLAG | Total packets | Discarded packets |
| A | 0 | 102 | 0 |
| B | 0 | 102 | 0 |
| C | 0 | 102 | 0 |
| D | 0 | 102 | 0 |
| Quadrant | Total seconds | Saturated seconds | Saturation percentage |
|---|---|---|---|
| A | 5045 | 24 | 0.475719% |
| B | 5045 | 57 | 1.129832% |
| C | 5045 | 14 | 0.277502% |
| D | 5045 | 114 | 2.259663% |
Noise dominated data is calculated using 1-second bins in cleaned event files. If a bin has >2000 counts, and if more than 50% of those come from <1% of pixels, then it is considered to be noise-dominated and hence unusable.
| Quadrant | # 1 sec bins | Bins with >0 counts | Bins with >2000 counts | High rate bins dominated by noise | Noise dominated (total time) | Noise dominated (detector-on time) | Marked lightcurve |
|---|---|---|---|---|---|---|---|
| A | 6988 | 5046 | 12 | 12 | 0.17% | 0.24% | 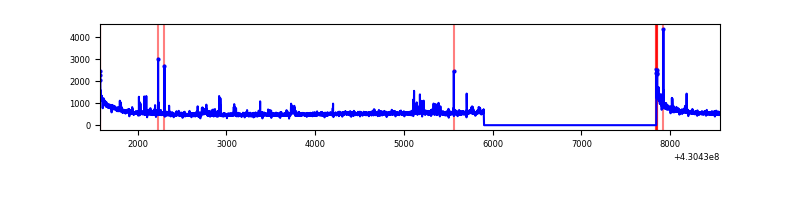 |
| B | 6988 | 5046 | 47 | 47 | 0.67% | 0.93% | 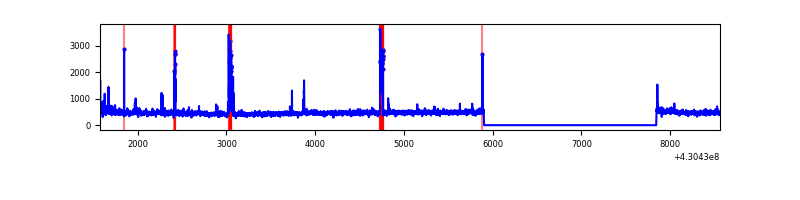 |
| C | 6988 | 5046 | 6 | 6 | 0.09% | 0.12% | 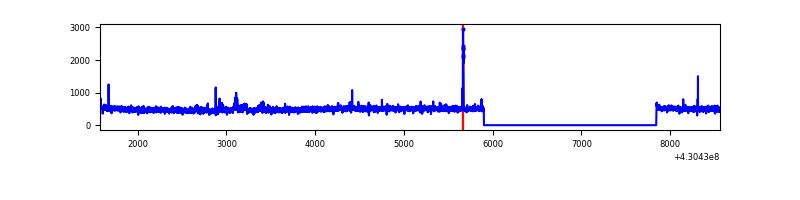 |
| D | 6988 | 5046 | 100 | 100 | 1.43% | 1.98% | 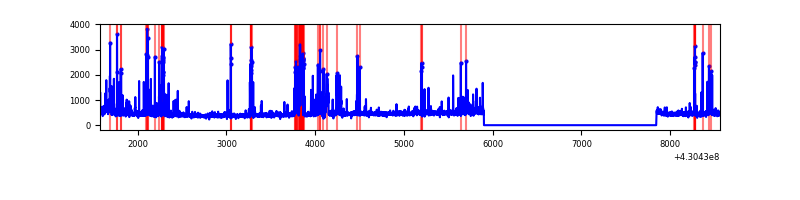 |
Top three noisy pixels from each quadrant. If the there are fewer than three noisy pixels in the level2.evt file, extra rows are filled as -1
| Pixel properties | Quadrant properties | ||||||
|---|---|---|---|---|---|---|---|
| Quadrant | DetID | PixID | Counts | Sigma | Mean | Median | Sigma |
| A | 10 | 83 | 529185 | 4476.34 | 579 | 569 | 118.1 |
| A | 12 | 189 | 65725 | 551.74 | 579 | 569 | 118.1 |
| A | 13 | 248 | 44732 | 373.97 | 579 | 569 | 118.1 |
| B | 5 | 255 | 104183 | 936.88 | 575 | 559 | 110.6 |
| B | 5 | 172 | 83904 | 753.54 | 575 | 559 | 110.6 |
| B | 0 | 229 | 16511 | 144.22 | 575 | 559 | 110.6 |
| C | 15 | 214 | 210108 | 1617.89 | 560 | 565 | 129.5 |
| C | 2 | 16 | 43252 | 329.59 | 560 | 565 | 129.5 |
| C | 14 | 254 | 24575 | 185.38 | 560 | 565 | 129.5 |
| D | 2 | 249 | 230686 | 1689.81 | 553 | 537 | 136.2 |
| D | 12 | 6 | 91034 | 664.45 | 553 | 537 | 136.2 |
| D | 5 | 70 | 80425 | 586.55 | 553 | 537 | 136.2 |
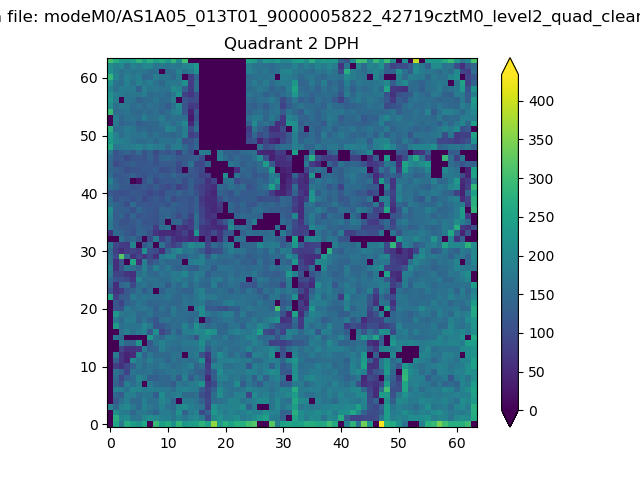
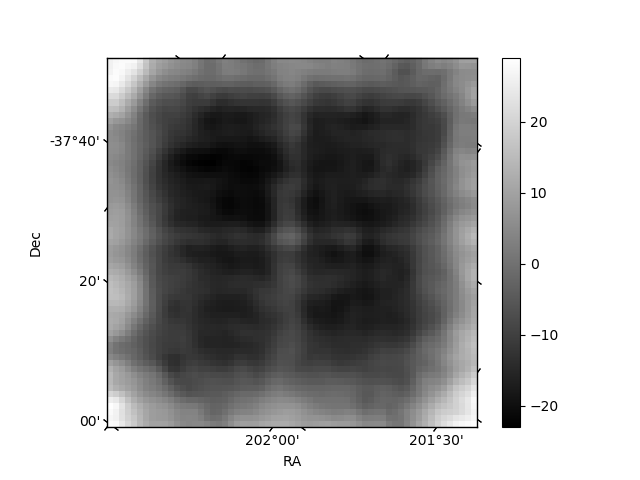
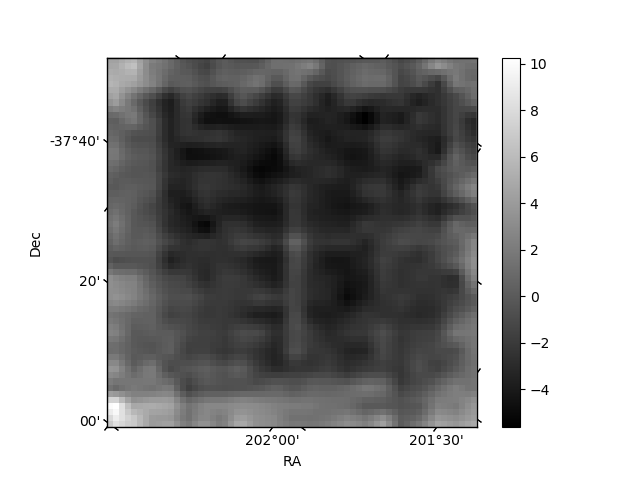
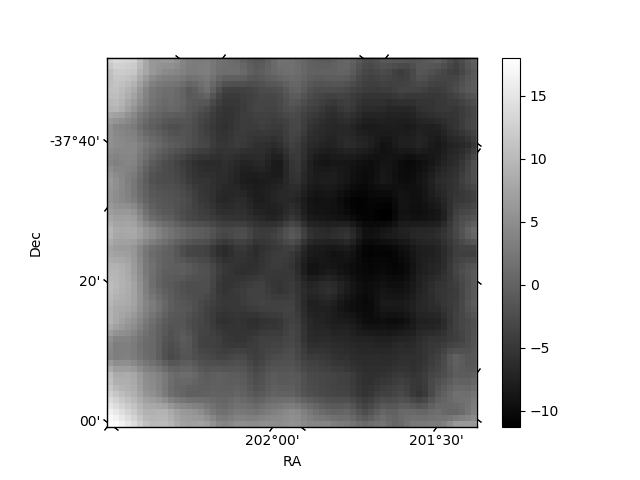
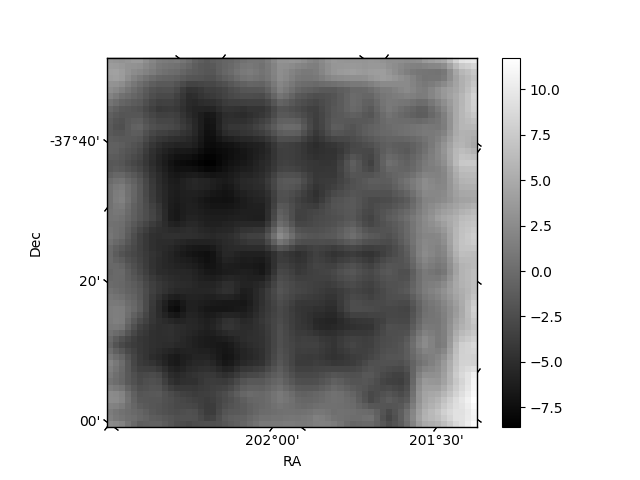
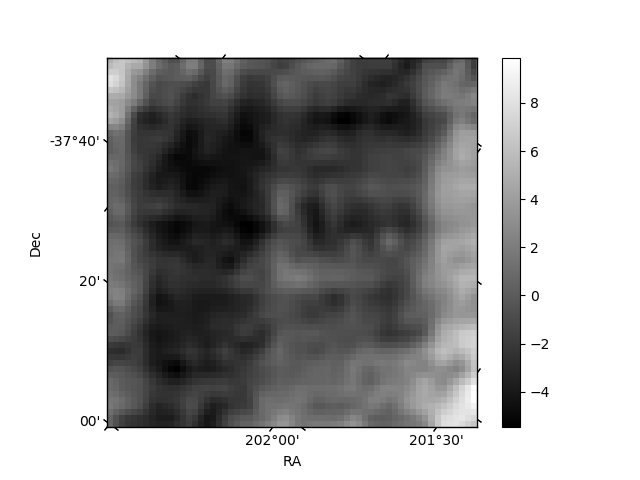
Histogram calculated using DETX and DETY for each event in the final _common_clean file
| Quadrant A | 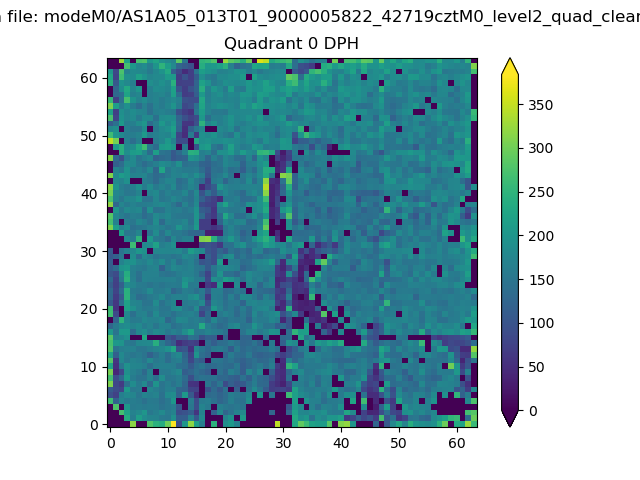 |
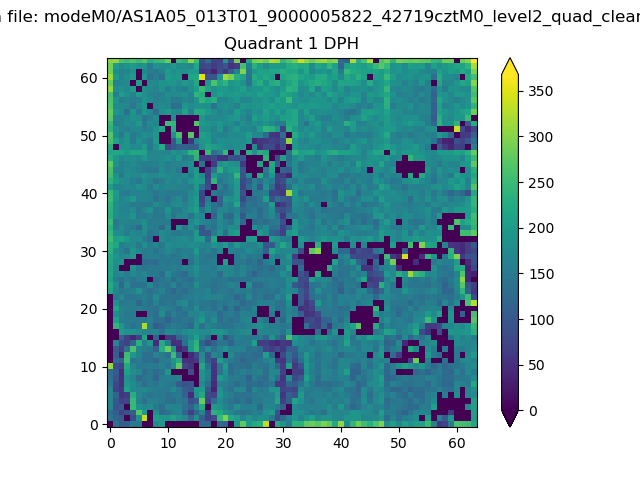 |
Quadrant B |
|---|---|---|---|
| Quadrant D | 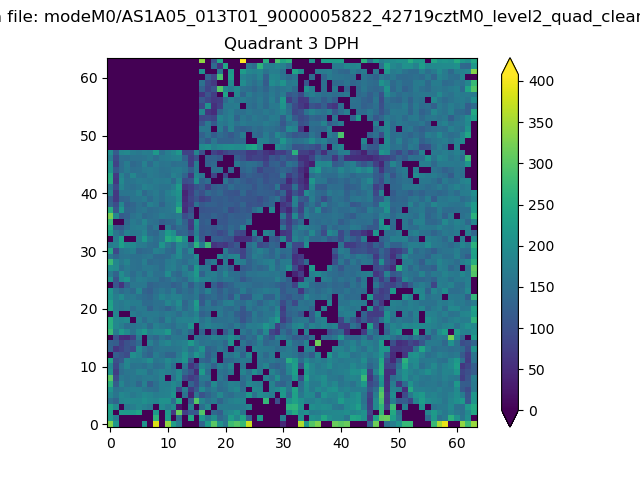 |
 |
Quadrant C |
| Plot type | Count rate plots | Images |
|---|---|---|
| Comparison with Poisson distribution Blue bars denote a histogram of data divided into 1 sec bins. Red curve is a Poisson curve with rate = median count rate of data. |
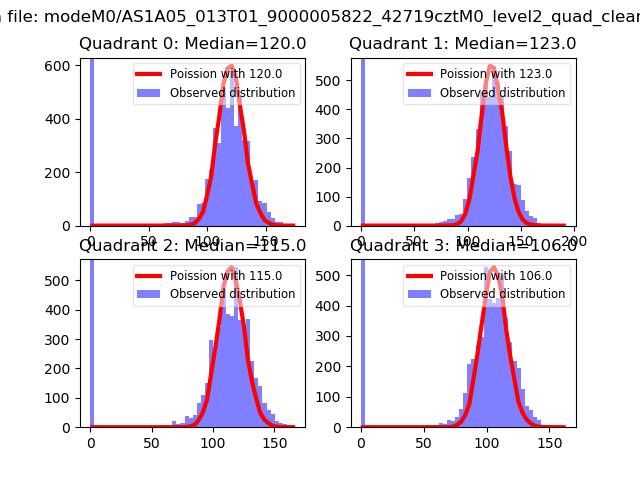 |
 |
| Quadrant-wise count rates Data is divided into 100 sec bins |
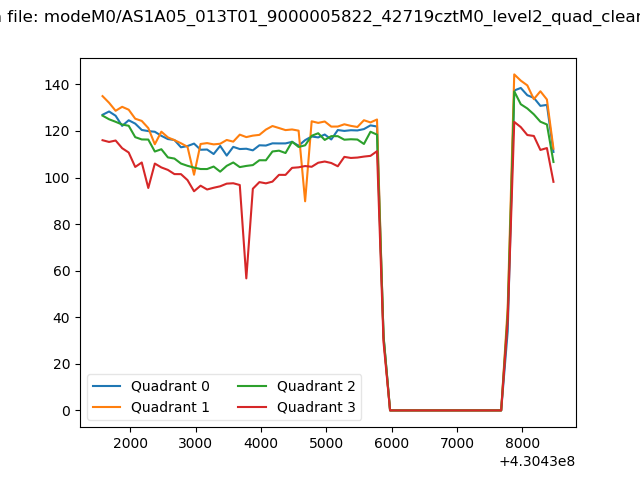 |
|
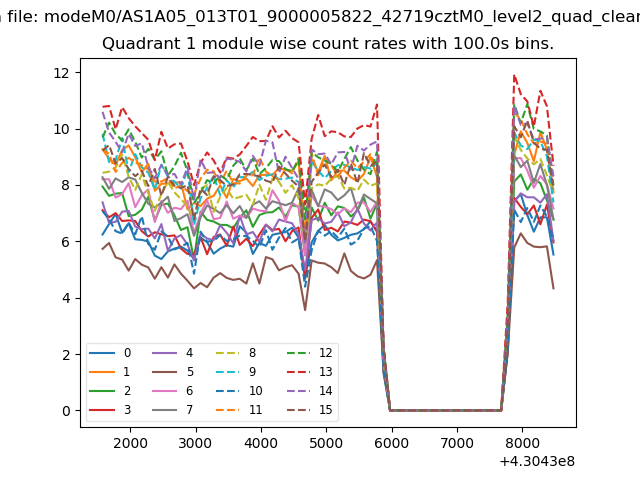
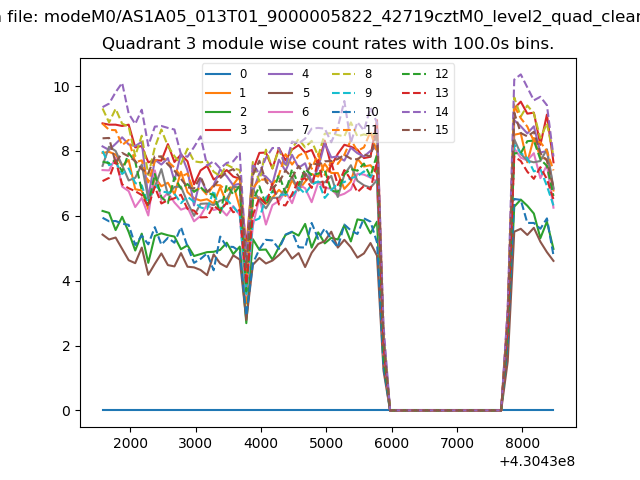
| Module-wise count rates for Quadrant A Data is divided into 100 sec bins |
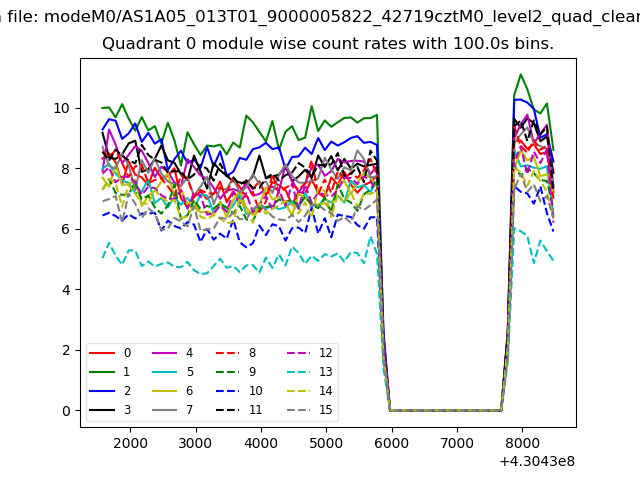 |
 |
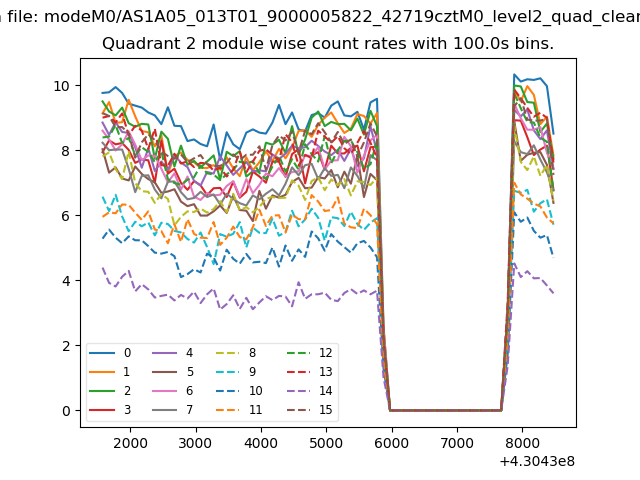
| Module-wise count rates for Quadrant B Data is divided into 100 sec bins |
 |
 |
| Module-wise count rates for Quadrant C Data is divided into 100 sec bins |
 |
 |
| Module-wise count rates for Quadrant D Data is divided into 100 sec bins |
 |
 |
| Parameter | Plot |
|---|---|
| CZT HV Monitor | 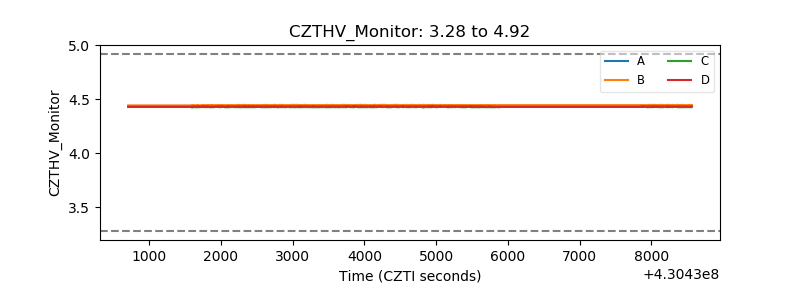 |
| D_VDD | 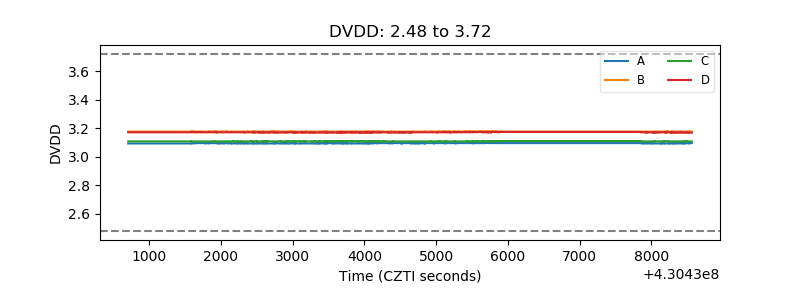 |
| Temperature 1 | 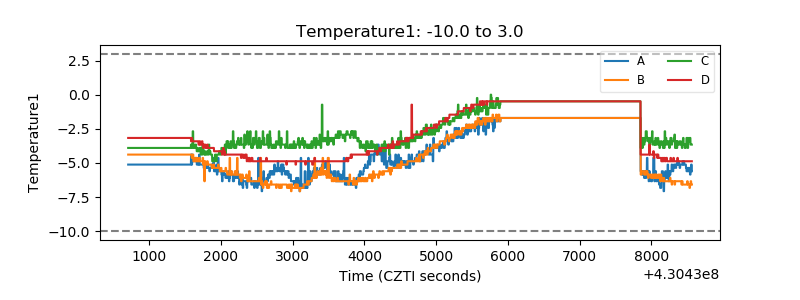 |
| Veto HV Monitor | 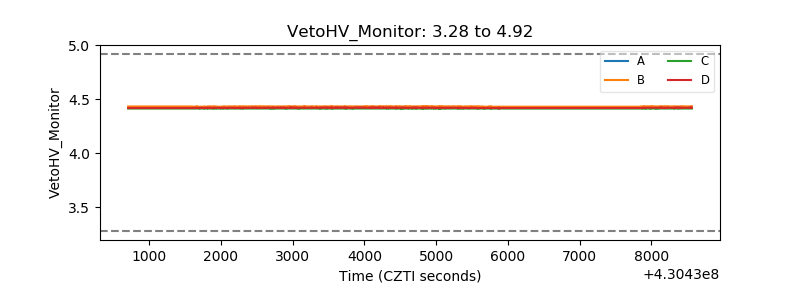 |
| Veto LLD | 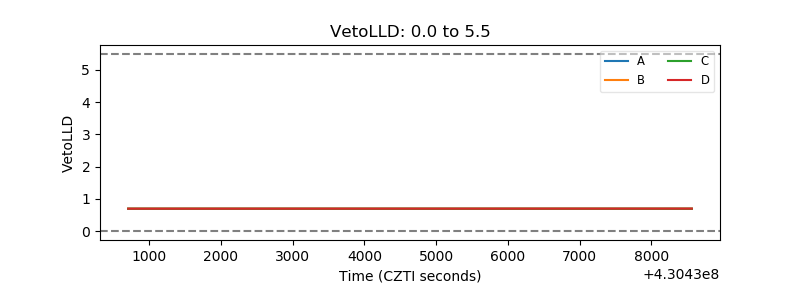 |
| Alpha Counter | 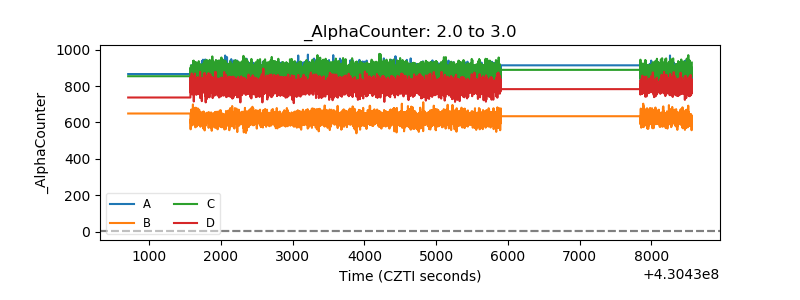 |
| _CPM_Rate | 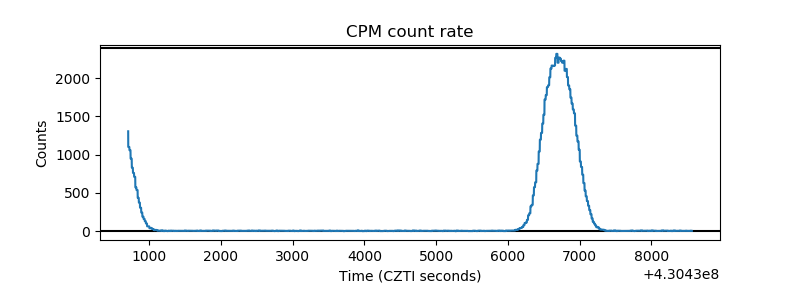 |
| CZT Counter | 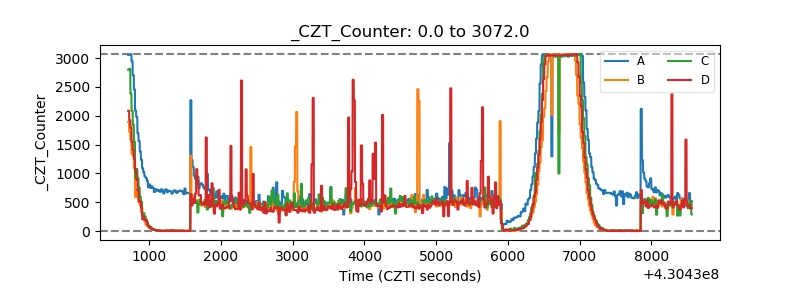 |
| +2.5 Volts monitor | 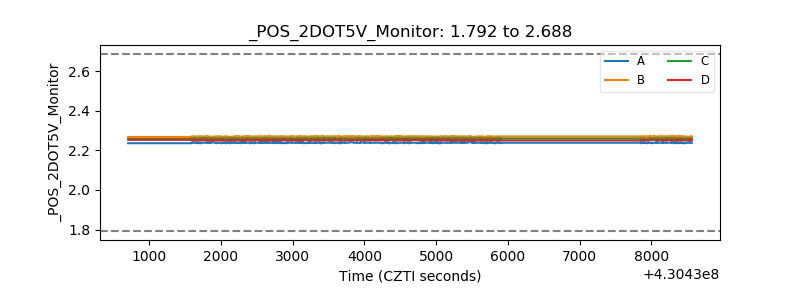 |
| +5 Volts monitor | 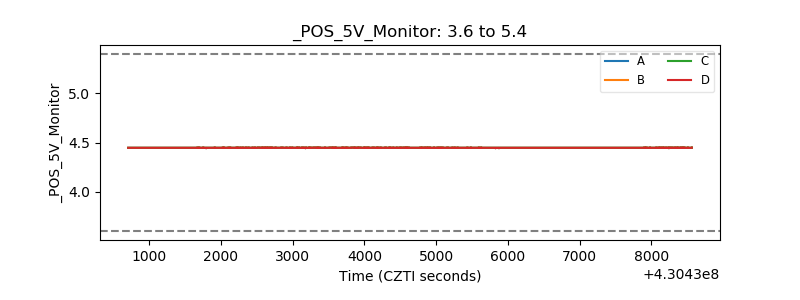 |
| _ROLL_ROT | 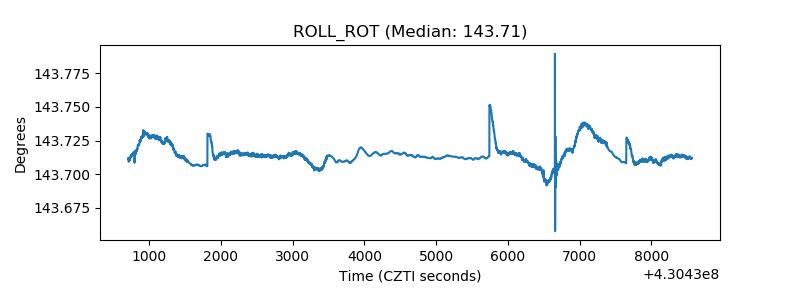 |
| _Roll_DEC | 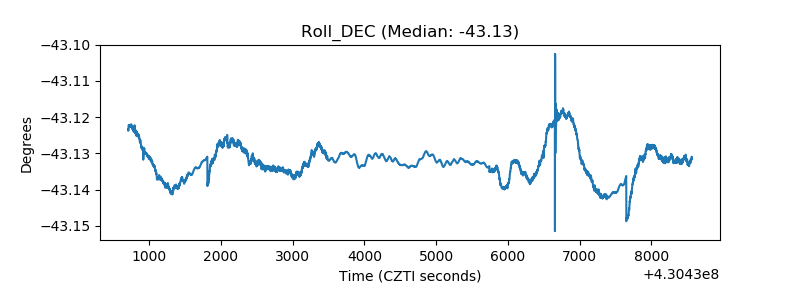 |
| _Roll_RA | 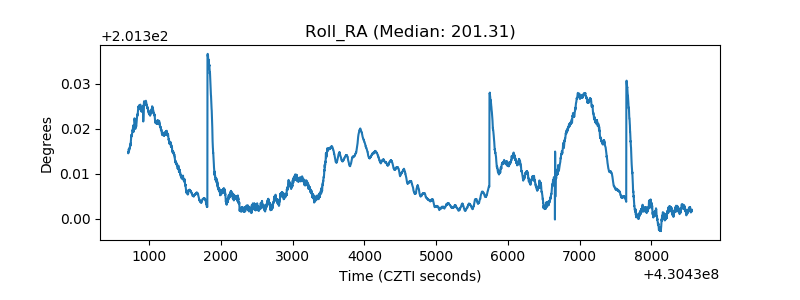 |
| Veto Counter | 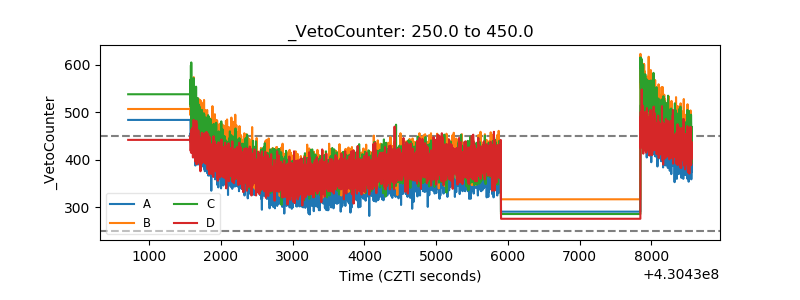 |