| Param | Original file | Final file |
|---|---|---|
| Filename | modeM0/AS1A05_013T01_9000005822_42720cztM0_level2.fits | modeM0/AS1A05_013T01_9000005822_42720cztM0_level2_quad_clean.evt |
| Size (bytes) | 338,247,360 | 87,039,360 |
| Size | 322.6 MB | 83.0 MB |
| Events in quadrant A | 2,902,486 | 610,702 |
| Events in quadrant B | 2,452,149 | 627,290 |
| Events in quadrant C | 2,428,908 | 585,408 |
| Events in quadrant D | 4,356,252 | 469,954 |
| Mode M0 | |||
|---|---|---|---|
| Quadrant | BADHDUFLAG | Total packets | Discarded packets |
| A | 0 | 11561 | 2 |
| B | 0 | 10278 | 2 |
| C | 0 | 9922 | 2 |
| D | 0 | 16254 | 2 |
| Mode M9 | |||
|---|---|---|---|
| Quadrant | BADHDUFLAG | Total packets | Discarded packets |
| A | 0 | 39 | 0 |
| B | 0 | 40 | 0 |
| C | 0 | 40 | 0 |
| D | 0 | 40 | 0 |
| Mode SS | |||
|---|---|---|---|
| Quadrant | BADHDUFLAG | Total packets | Discarded packets |
| A | 0 | 98 | 0 |
| B | 0 | 98 | 0 |
| C | 0 | 98 | 0 |
| D | 0 | 98 | 0 |
| Quadrant | Total seconds | Saturated seconds | Saturation percentage |
|---|---|---|---|
| A | 4888 | 20 | 0.409165% |
| B | 4888 | 24 | 0.490998% |
| C | 4888 | 6 | 0.122750% |
| D | 4888 | 741 | 15.159574% |
Noise dominated data is calculated using 1-second bins in cleaned event files. If a bin has >2000 counts, and if more than 50% of those come from <1% of pixels, then it is considered to be noise-dominated and hence unusable.
| Quadrant | # 1 sec bins | Bins with >0 counts | Bins with >2000 counts | High rate bins dominated by noise | Noise dominated (total time) | Noise dominated (detector-on time) | Marked lightcurve |
|---|---|---|---|---|---|---|---|
| A | 6952 | 4889 | 12 | 12 | 0.17% | 0.25% | 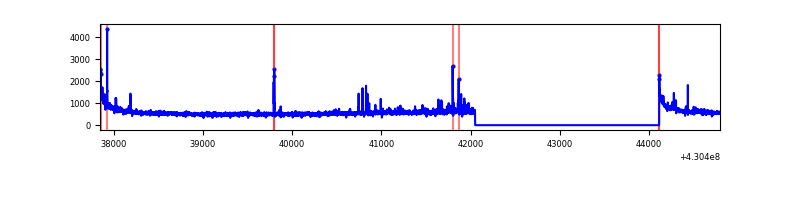 |
| B | 6952 | 4889 | 14 | 14 | 0.20% | 0.29% | 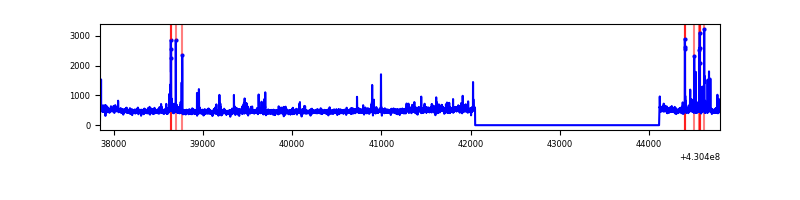 |
| C | 6952 | 4889 | 1 | 1 | 0.01% | 0.02% | 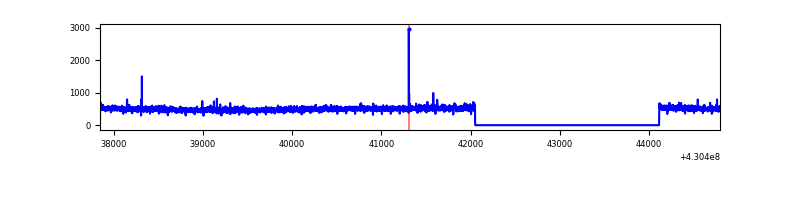 |
| D | 6952 | 4889 | 675 | 675 | 9.71% | 13.81% | 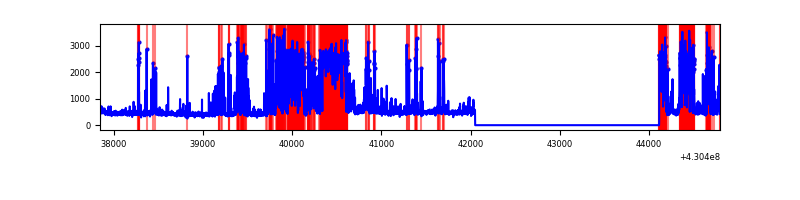 |
Top three noisy pixels from each quadrant. If the there are fewer than three noisy pixels in the level2.evt file, extra rows are filled as -1
| Pixel properties | Quadrant properties | ||||||
|---|---|---|---|---|---|---|---|
| Quadrant | DetID | PixID | Counts | Sigma | Mean | Median | Sigma |
| A | 10 | 83 | 524133 | 4490.81 | 577 | 567 | 116.6 |
| A | 12 | 189 | 68577 | 583.35 | 577 | 567 | 116.6 |
| A | 13 | 248 | 54194 | 459.98 | 577 | 567 | 116.6 |
| B | 5 | 255 | 73645 | 667.92 | 575 | 559 | 109.4 |
| B | 0 | 245 | 47665 | 430.49 | 575 | 559 | 109.4 |
| B | 0 | 156 | 22336 | 199.01 | 575 | 559 | 109.4 |
| C | 15 | 214 | 205213 | 1582.46 | 560 | 564 | 129.3 |
| C | 3 | 233 | 12888 | 95.3 | 560 | 564 | 129.3 |
| C | 8 | 79 | 10560 | 77.29 | 560 | 564 | 129.3 |
| D | 2 | 249 | 2052466 | 16089.86 | 520 | 505 | 127.5 |
| D | 9 | 19 | 131558 | 1027.61 | 520 | 505 | 127.5 |
| D | 12 | 6 | 125968 | 983.78 | 520 | 505 | 127.5 |
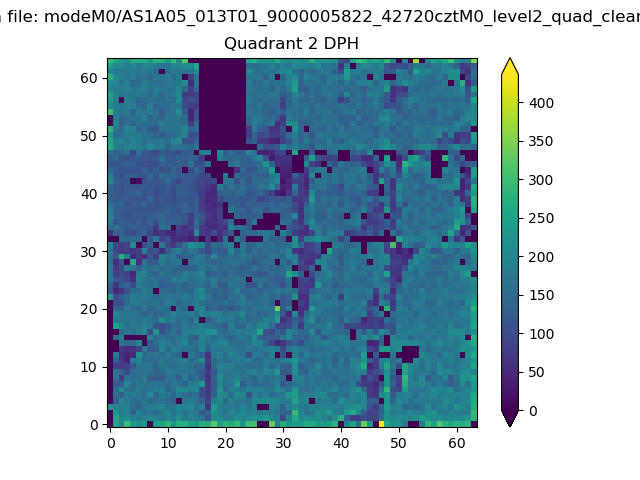
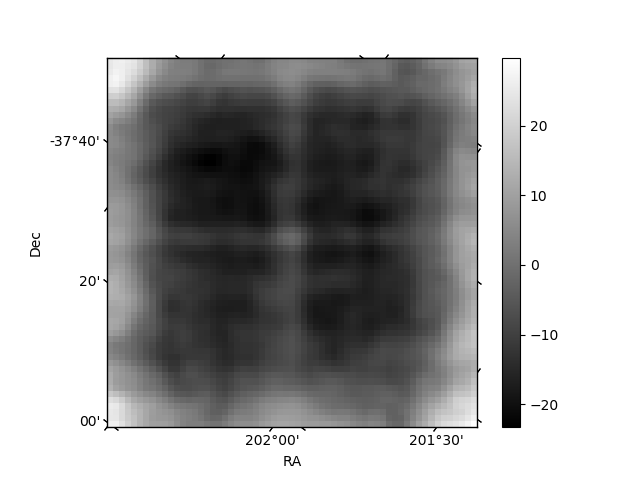
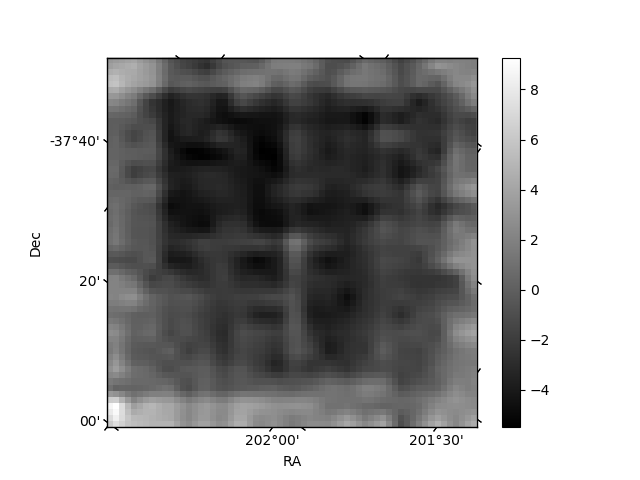
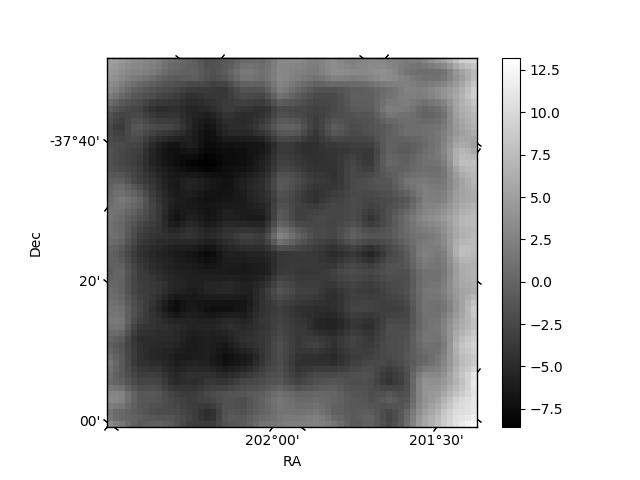
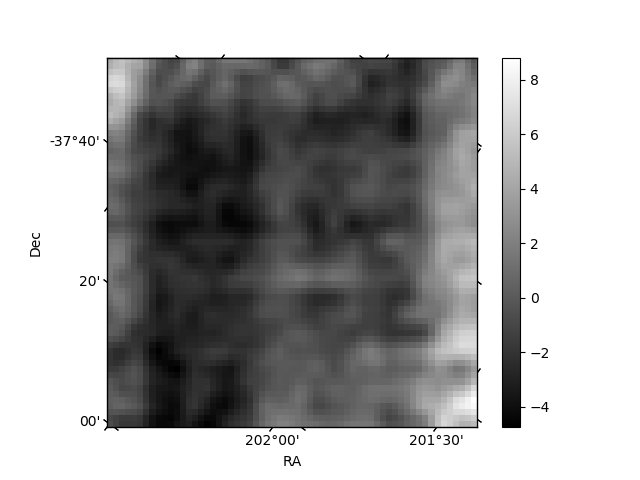
Histogram calculated using DETX and DETY for each event in the final _common_clean file
| Quadrant A | 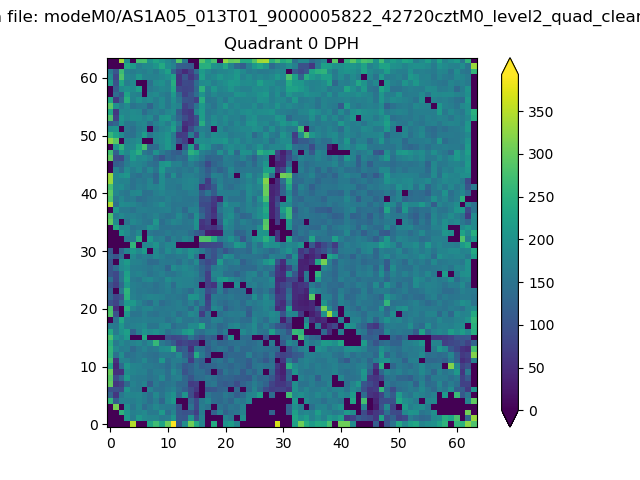 |
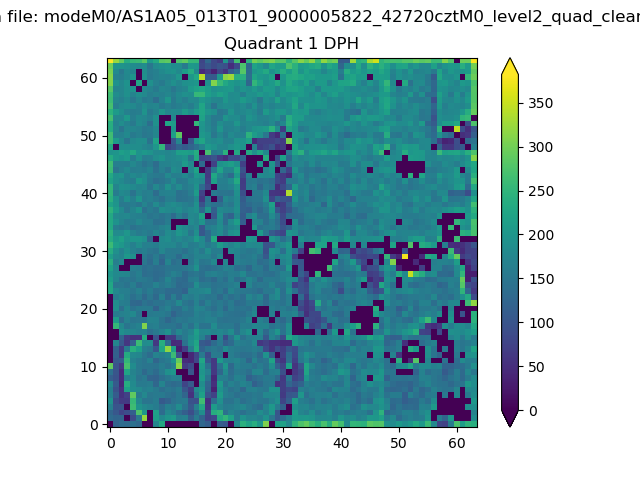 |
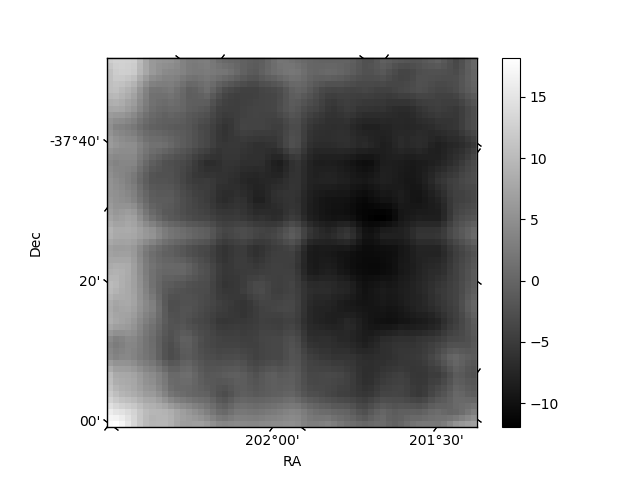
Quadrant B |
|---|---|---|---|
| Quadrant D | 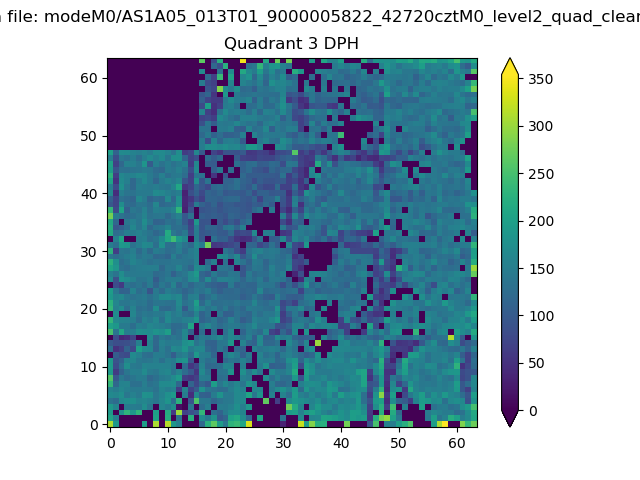 |
 |
Quadrant C |
| Plot type | Count rate plots | Images |
|---|---|---|
| Comparison with Poisson distribution Blue bars denote a histogram of data divided into 1 sec bins. Red curve is a Poisson curve with rate = median count rate of data. |
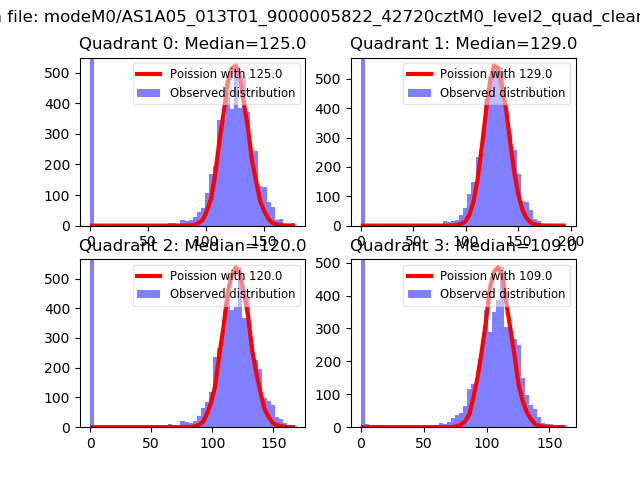 |
 |
| Quadrant-wise count rates Data is divided into 100 sec bins |
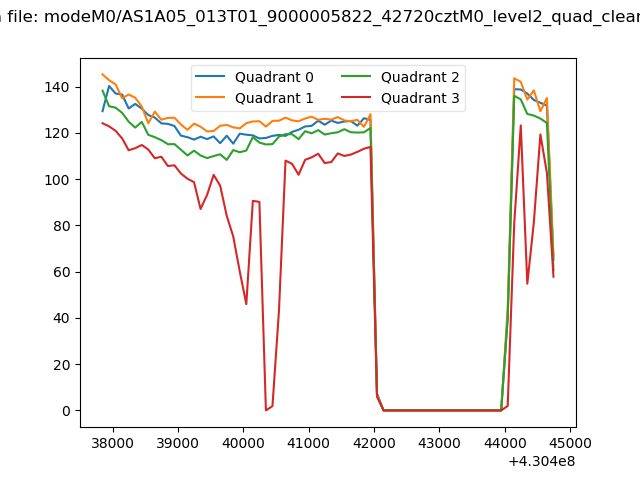 |
|
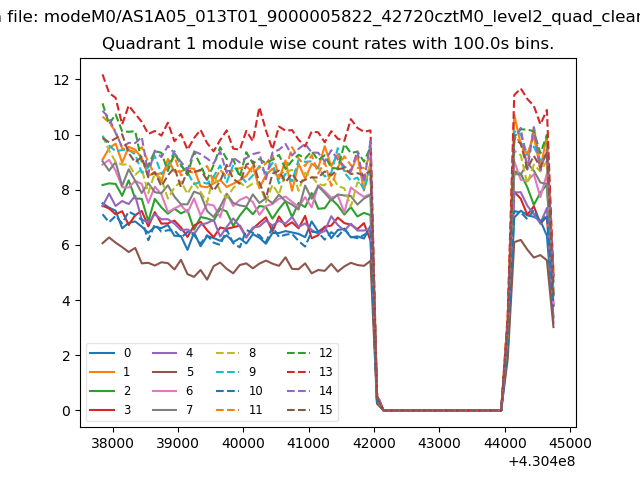
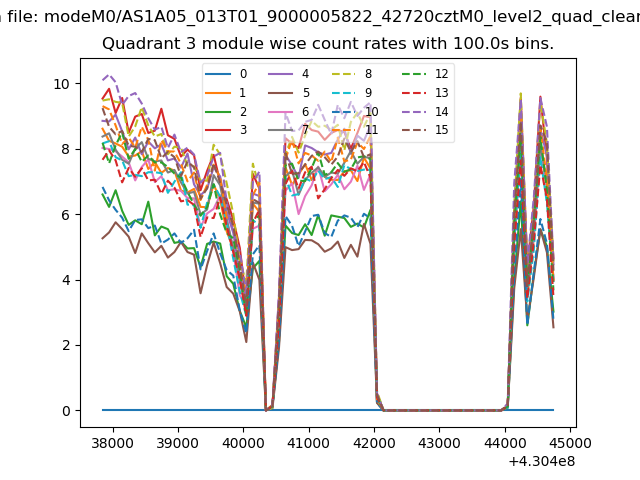
| Module-wise count rates for Quadrant A Data is divided into 100 sec bins |
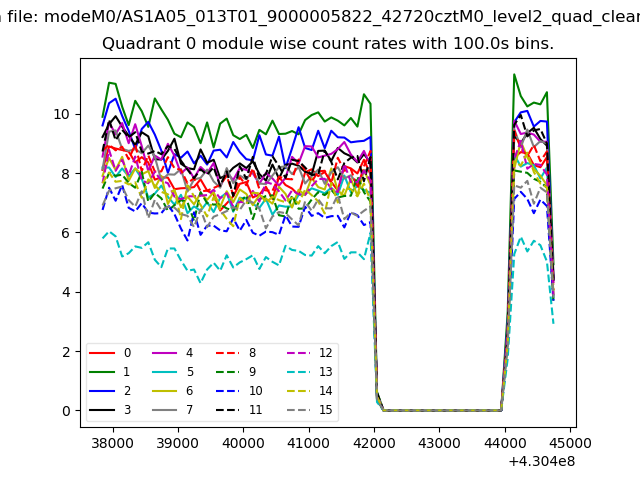 |
 |
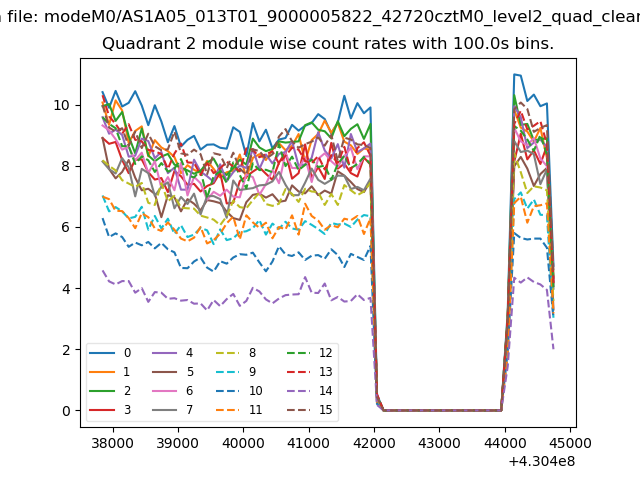
| Module-wise count rates for Quadrant B Data is divided into 100 sec bins |
 |
 |
| Module-wise count rates for Quadrant C Data is divided into 100 sec bins |
 |
 |
| Module-wise count rates for Quadrant D Data is divided into 100 sec bins |
 |
 |
| Parameter | Plot |
|---|---|
| CZT HV Monitor | 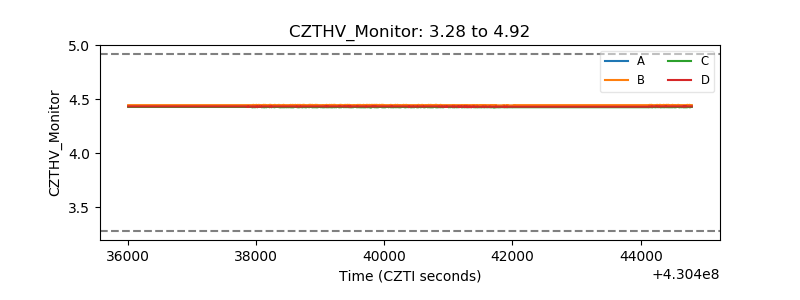 |
| D_VDD | 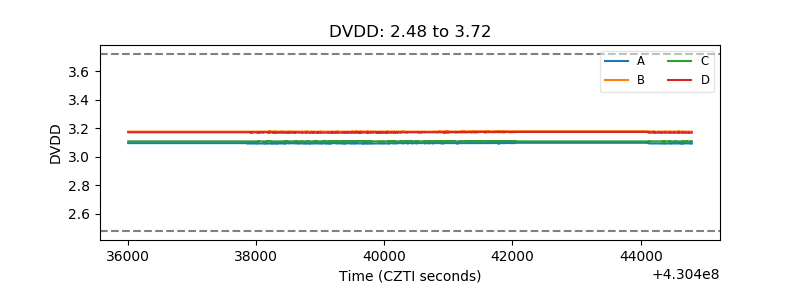 |
| Temperature 1 | 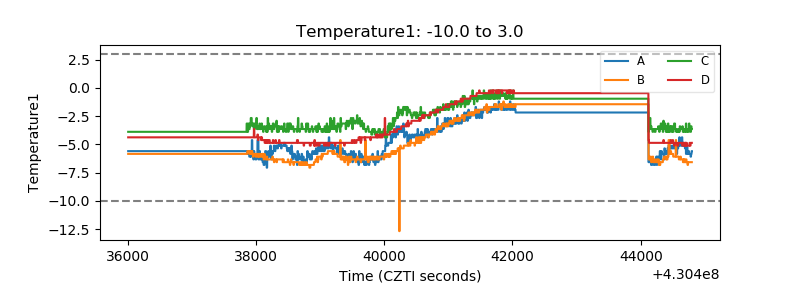 |
| Veto HV Monitor | 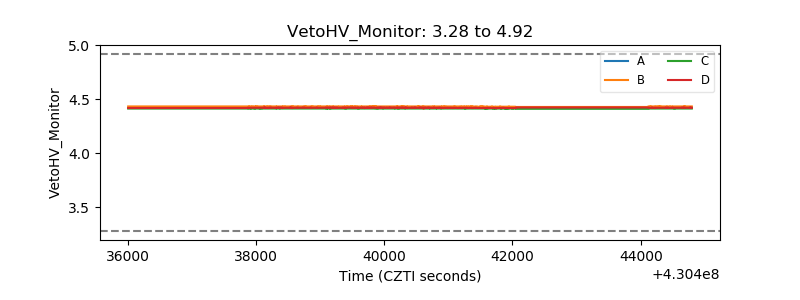 |
| Veto LLD | 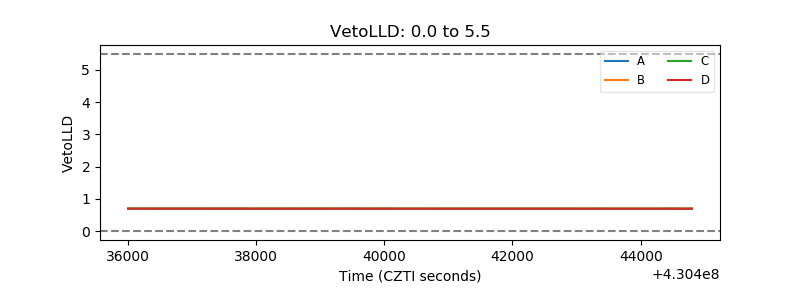 |
| Alpha Counter | 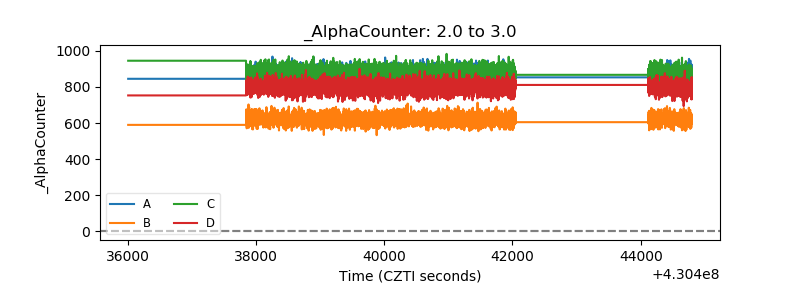 |
| _CPM_Rate | 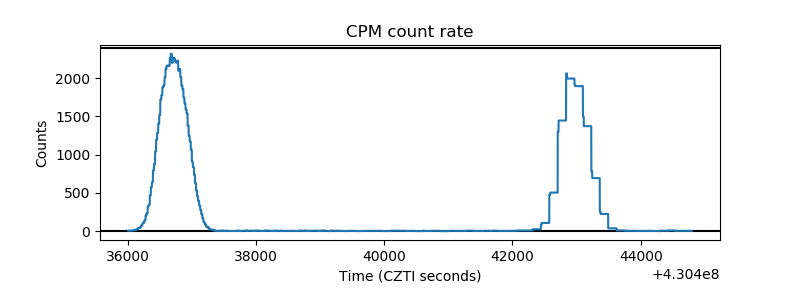 |
| CZT Counter | 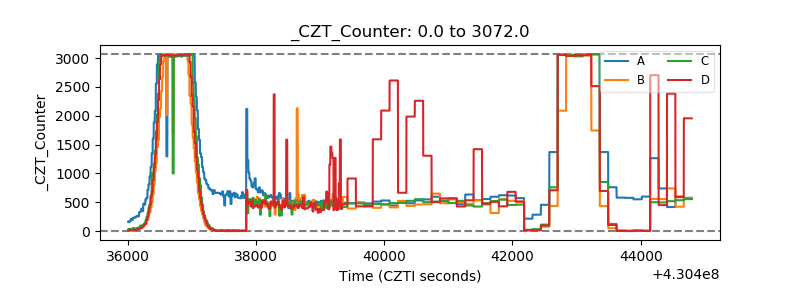 |
| +2.5 Volts monitor | 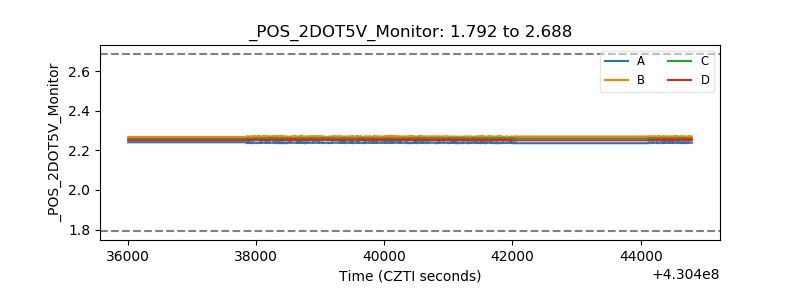 |
| +5 Volts monitor | 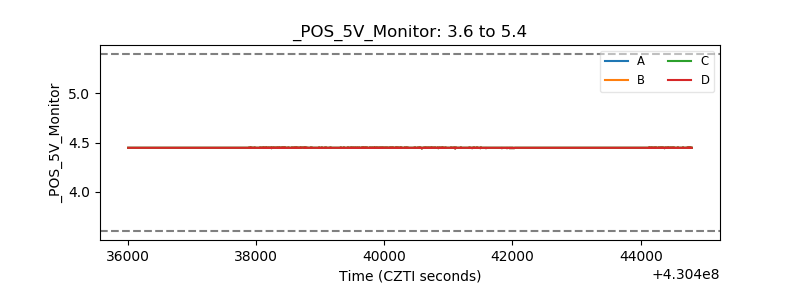 |
| _ROLL_ROT | 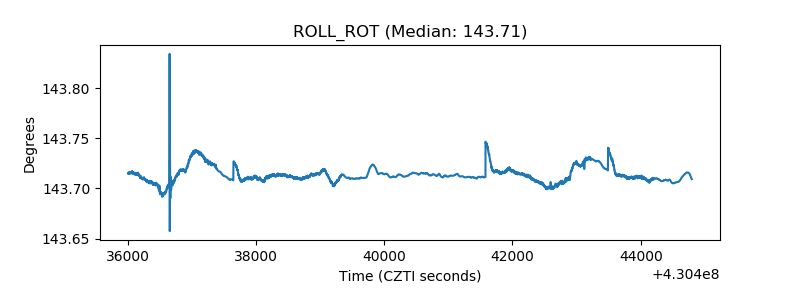 |
| _Roll_DEC | 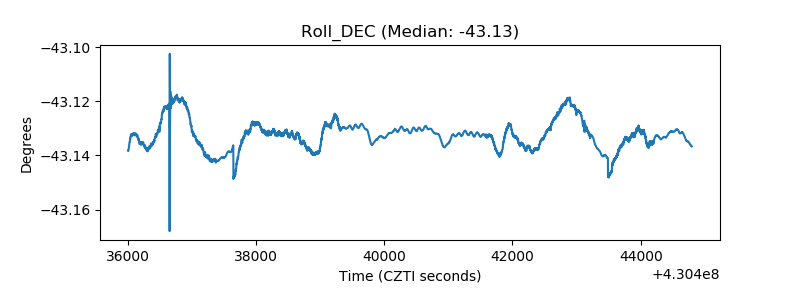 |
| _Roll_RA | 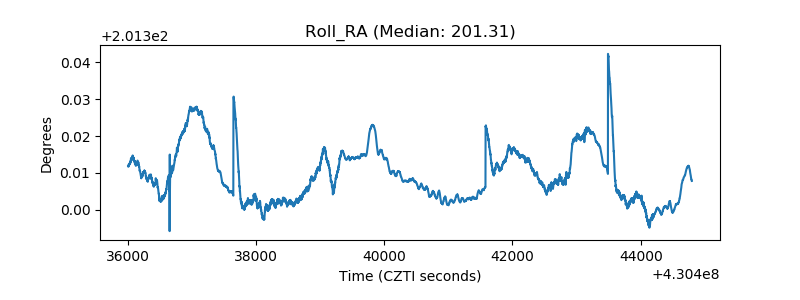 |
| Veto Counter | 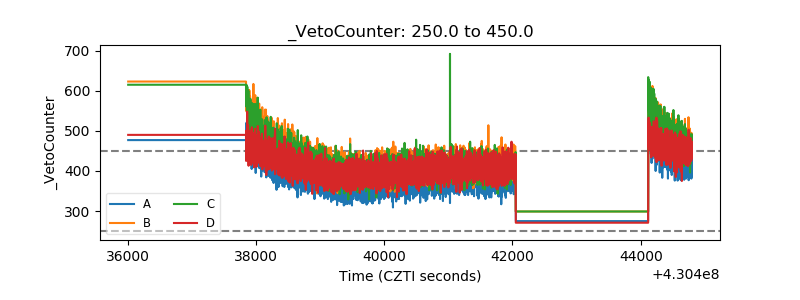 |