| Param | Original file | Final file |
|---|---|---|
| Filename | modeM0/AS1A05_013T01_9000005822_42721cztM0_level2.fits | modeM0/AS1A05_013T01_9000005822_42721cztM0_level2_quad_clean.evt |
| Size (bytes) | 316,869,120 | 88,793,280 |
| Size | 302.2 MB | 84.7 MB |
| Events in quadrant A | 2,895,335 | 613,451 |
| Events in quadrant B | 2,523,980 | 631,597 |
| Events in quadrant C | 2,459,307 | 590,810 |
| Events in quadrant D | 3,468,500 | 509,033 |
| Mode M0 | |||
|---|---|---|---|
| Quadrant | BADHDUFLAG | Total packets | Discarded packets |
| A | 0 | 11541 | 2 |
| B | 0 | 10511 | 2 |
| C | 0 | 9943 | 2 |
| D | 0 | 13575 | 2 |
| Mode M9 | |||
|---|---|---|---|
| Quadrant | BADHDUFLAG | Total packets | Discarded packets |
| A | 0 | 39 | 0 |
| B | 0 | 40 | 0 |
| C | 0 | 40 | 0 |
| D | 0 | 40 | 0 |
| Mode SS | |||
|---|---|---|---|
| Quadrant | BADHDUFLAG | Total packets | Discarded packets |
| A | 0 | 100 | 0 |
| B | 0 | 100 | 0 |
| C | 0 | 100 | 0 |
| D | 0 | 100 | 0 |
| Quadrant | Total seconds | Saturated seconds | Saturation percentage |
|---|---|---|---|
| A | 4903 | 9 | 0.183561% |
| B | 4903 | 35 | 0.713849% |
| C | 4903 | 6 | 0.122374% |
| D | 4903 | 356 | 7.260861% |
Noise dominated data is calculated using 1-second bins in cleaned event files. If a bin has >2000 counts, and if more than 50% of those come from <1% of pixels, then it is considered to be noise-dominated and hence unusable.
| Quadrant | # 1 sec bins | Bins with >0 counts | Bins with >2000 counts | High rate bins dominated by noise | Noise dominated (total time) | Noise dominated (detector-on time) | Marked lightcurve |
|---|---|---|---|---|---|---|---|
| A | 7057 | 4904 | 4 | 4 | 0.06% | 0.08% | 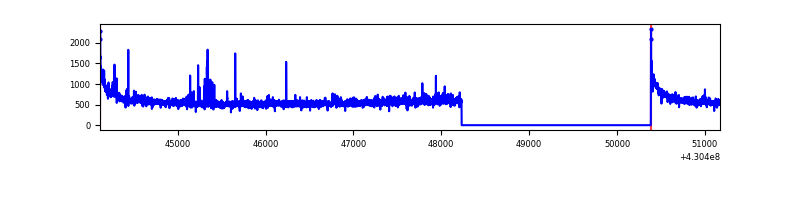 |
| B | 7057 | 4904 | 24 | 24 | 0.34% | 0.49% | 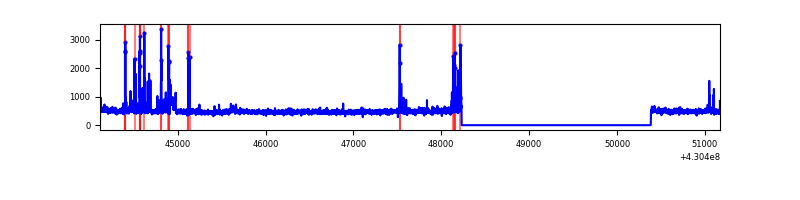 |
| C | 7057 | 4904 | 1 | 1 | 0.01% | 0.02% | 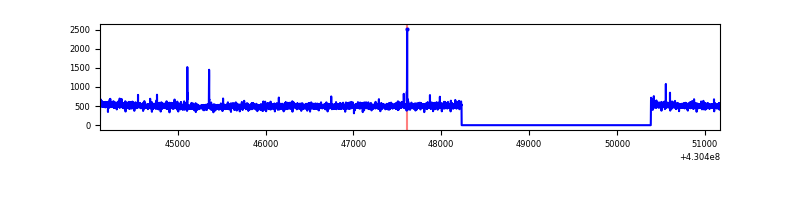 |
| D | 7057 | 4904 | 325 | 325 | 4.61% | 6.63% | 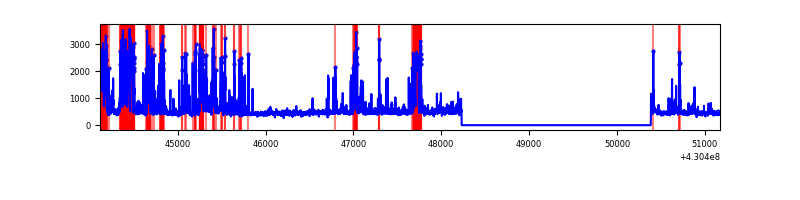 |
Top three noisy pixels from each quadrant. If the there are fewer than three noisy pixels in the level2.evt file, extra rows are filled as -1
| Pixel properties | Quadrant properties | ||||||
|---|---|---|---|---|---|---|---|
| Quadrant | DetID | PixID | Counts | Sigma | Mean | Median | Sigma |
| A | 10 | 83 | 519857 | 4402.72 | 581 | 572 | 117.9 |
| A | 12 | 189 | 112745 | 951.05 | 581 | 572 | 117.9 |
| A | 13 | 6 | 10056 | 80.41 | 581 | 572 | 117.9 |
| B | 5 | 255 | 116367 | 1045.01 | 578 | 564 | 110.8 |
| B | 15 | 85 | 53056 | 473.69 | 578 | 564 | 110.8 |
| B | 5 | 172 | 33176 | 294.29 | 578 | 564 | 110.8 |
| C | 15 | 214 | 206082 | 1558.36 | 567 | 571 | 131.9 |
| C | 3 | 233 | 16372 | 119.82 | 567 | 571 | 131.9 |
| C | 14 | 254 | 11637 | 83.91 | 567 | 571 | 131.9 |
| D | 2 | 249 | 1090281 | 8193.55 | 547 | 531 | 133.0 |
| D | 9 | 19 | 109811 | 821.65 | 547 | 531 | 133.0 |
| D | 12 | 6 | 95459 | 713.74 | 547 | 531 | 133.0 |
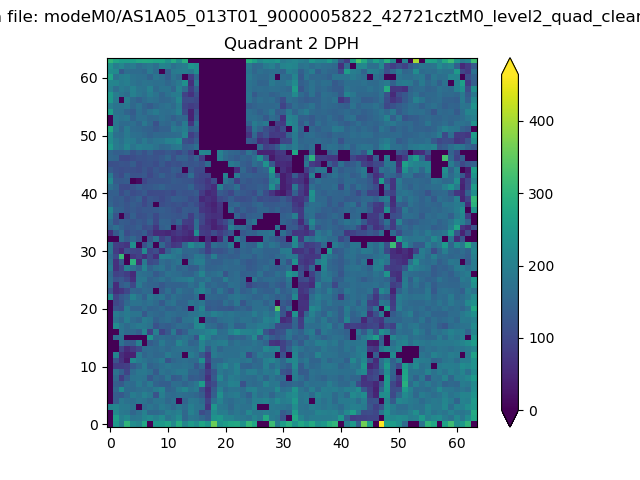
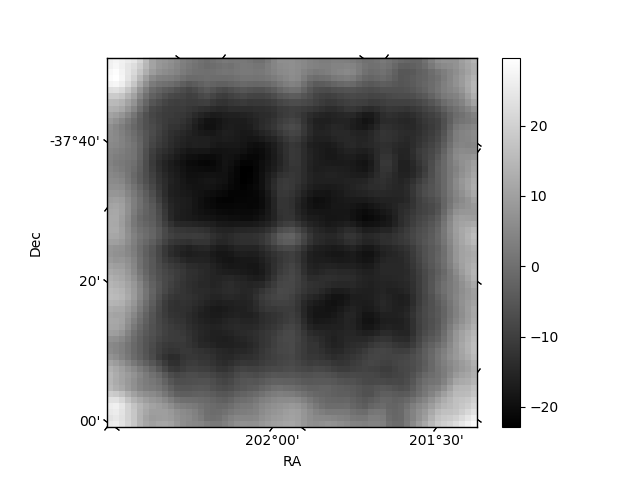
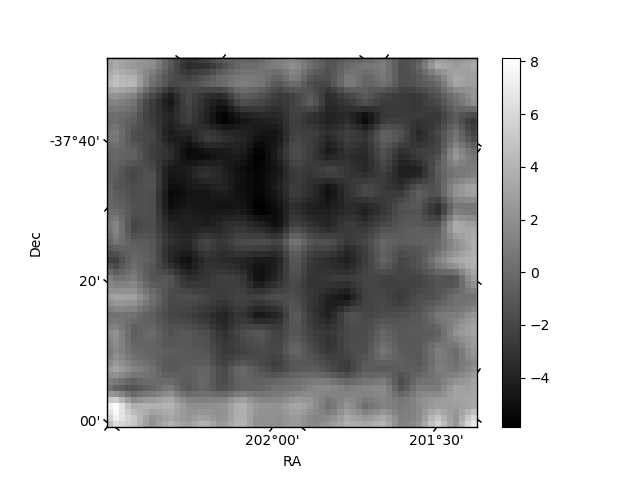
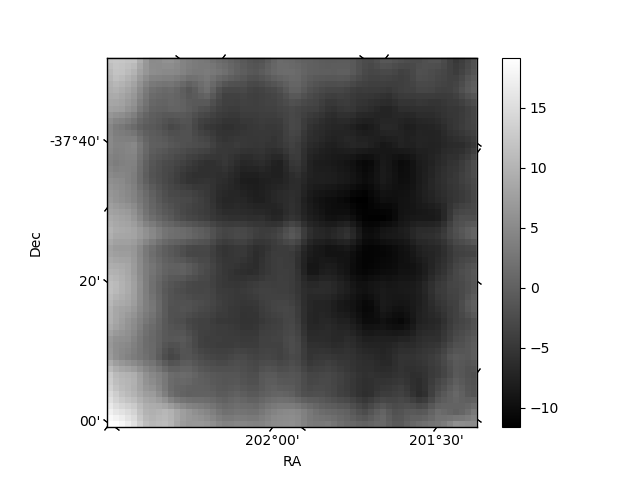
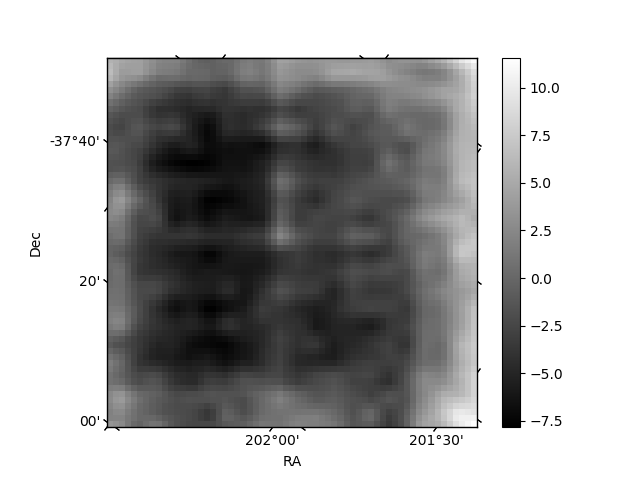
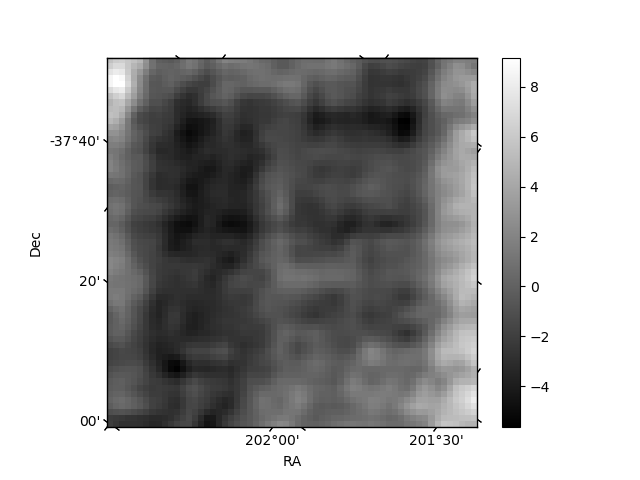
Histogram calculated using DETX and DETY for each event in the final _common_clean file
| Quadrant A | 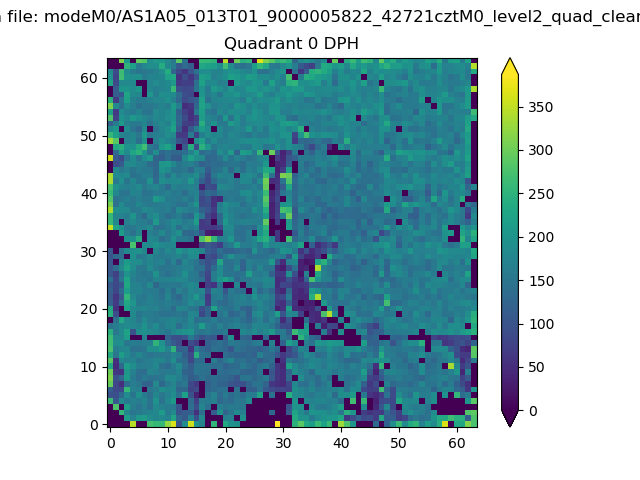 |
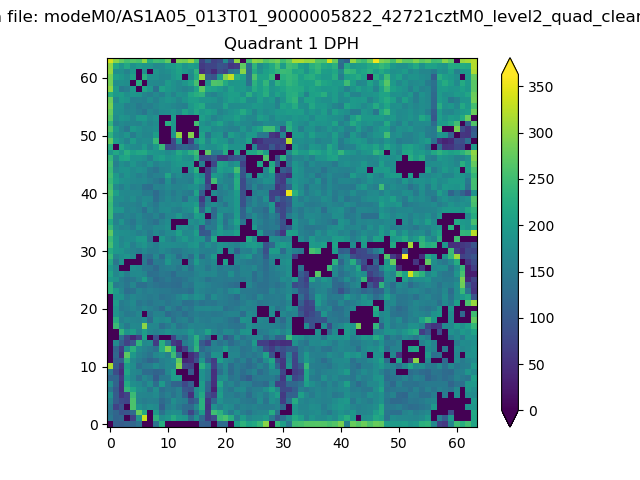 |
Quadrant B |
|---|---|---|---|
| Quadrant D | 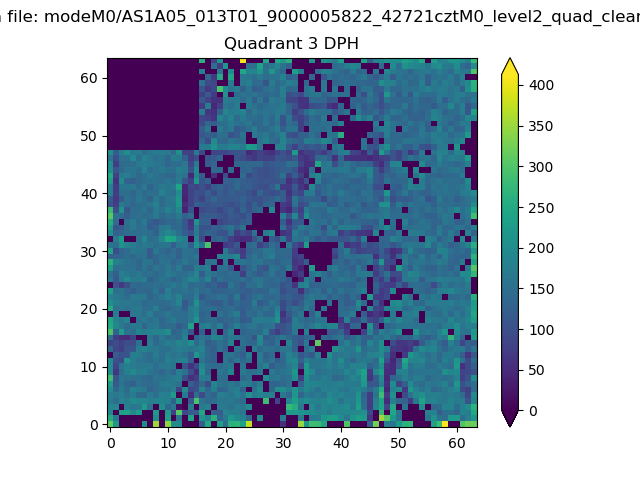 |
 |
Quadrant C |
| Plot type | Count rate plots | Images |
|---|---|---|
| Comparison with Poisson distribution Blue bars denote a histogram of data divided into 1 sec bins. Red curve is a Poisson curve with rate = median count rate of data. |
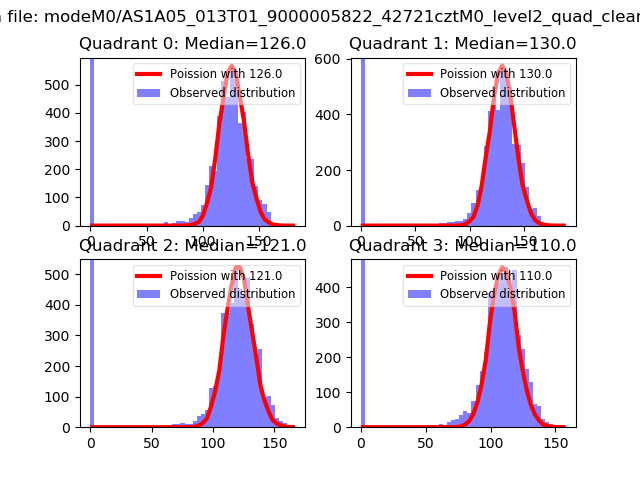 |
 |
| Quadrant-wise count rates Data is divided into 100 sec bins |
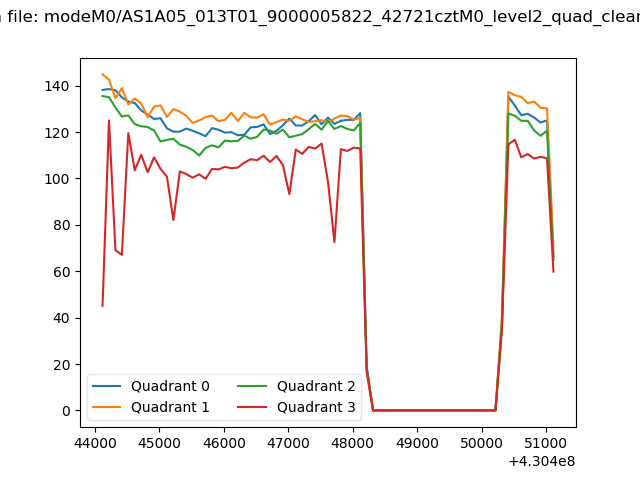 |
|
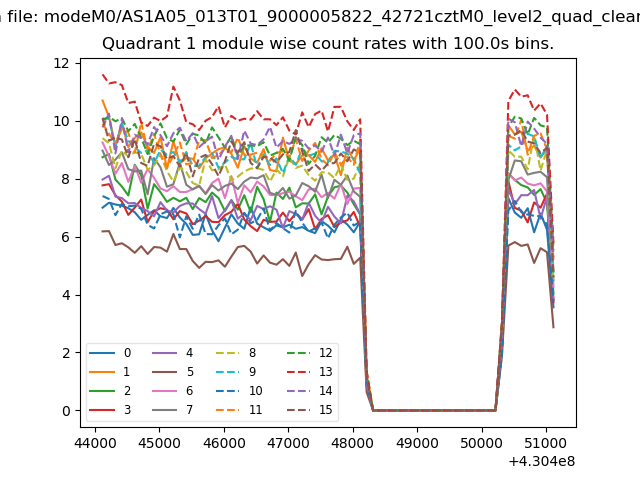
| Module-wise count rates for Quadrant A Data is divided into 100 sec bins |
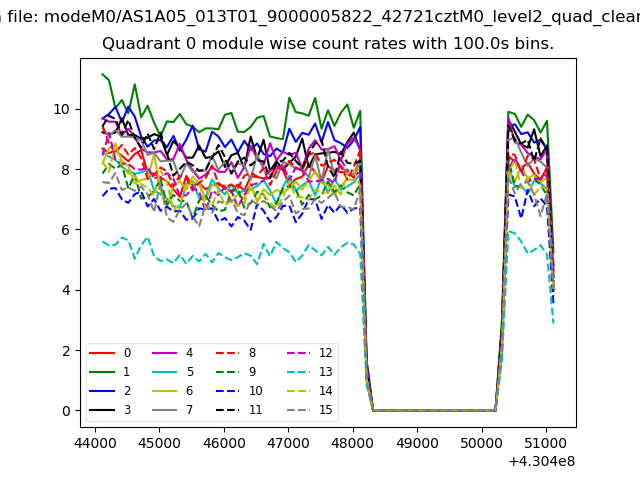 |
 |
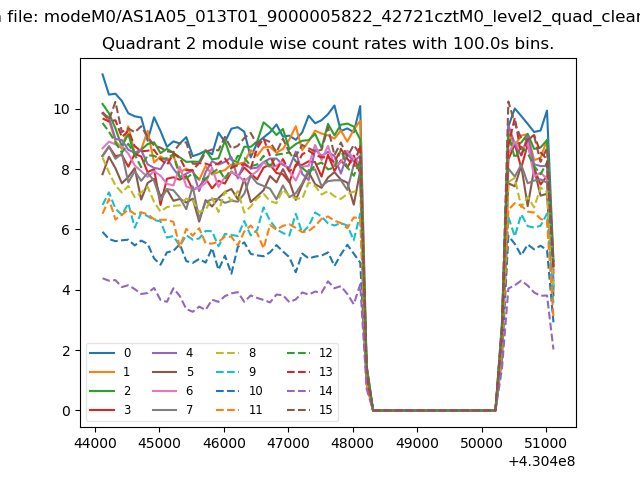
| Module-wise count rates for Quadrant B Data is divided into 100 sec bins |
 |
 |
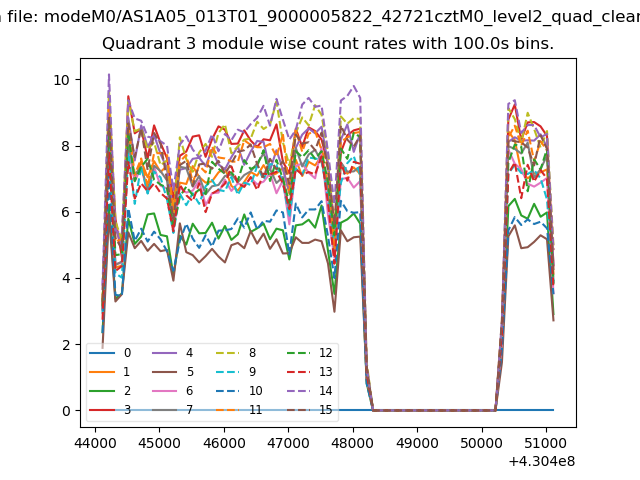
| Module-wise count rates for Quadrant C Data is divided into 100 sec bins |
 |
 |
| Module-wise count rates for Quadrant D Data is divided into 100 sec bins |
 |
 |
| Parameter | Plot |
|---|---|
| CZT HV Monitor | 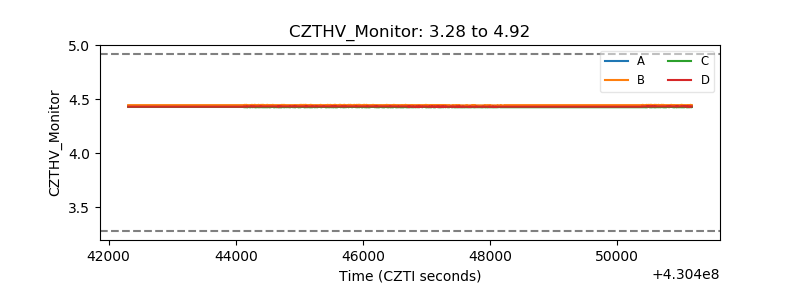 |
| D_VDD | 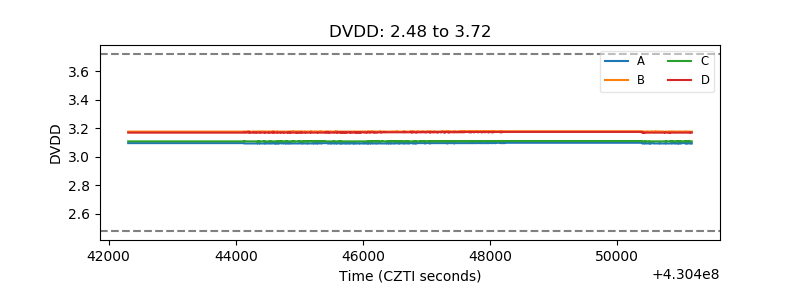 |
| Temperature 1 | 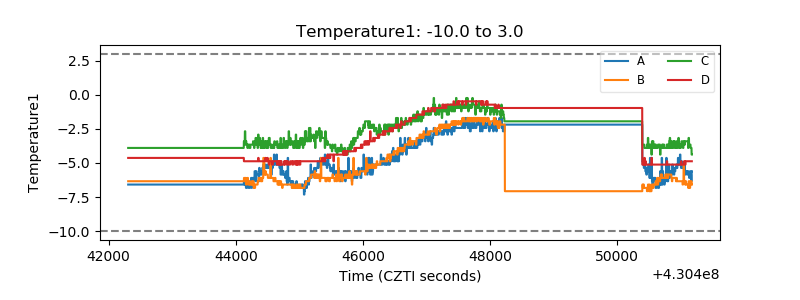 |
| Veto HV Monitor | 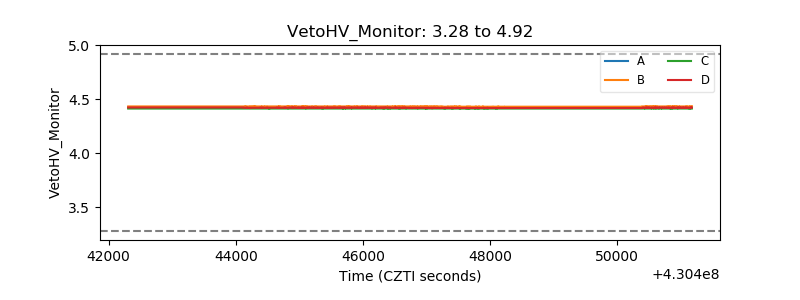 |
| Veto LLD | 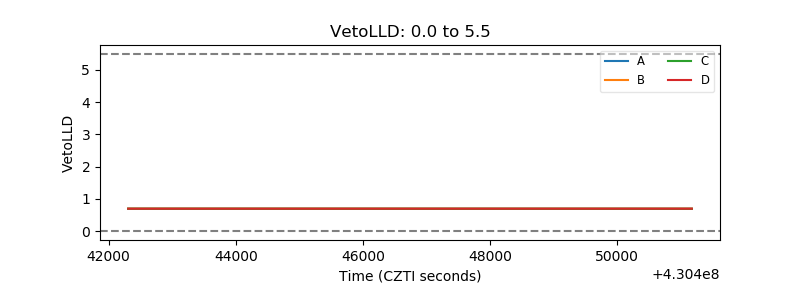 |
| Alpha Counter | 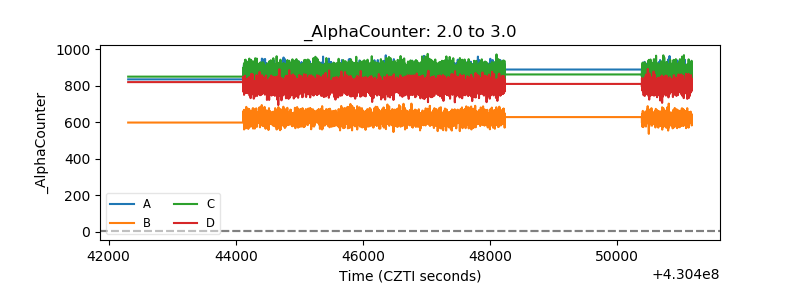 |
| _CPM_Rate | 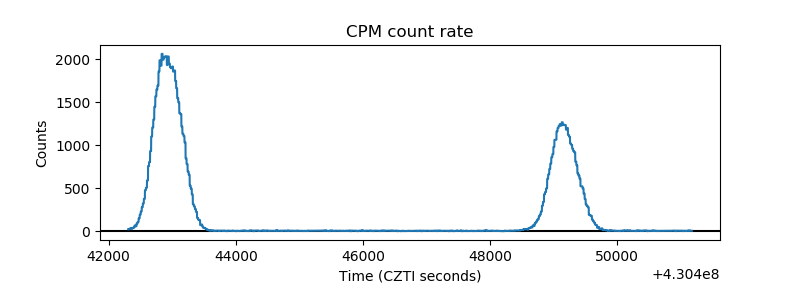 |
| CZT Counter | 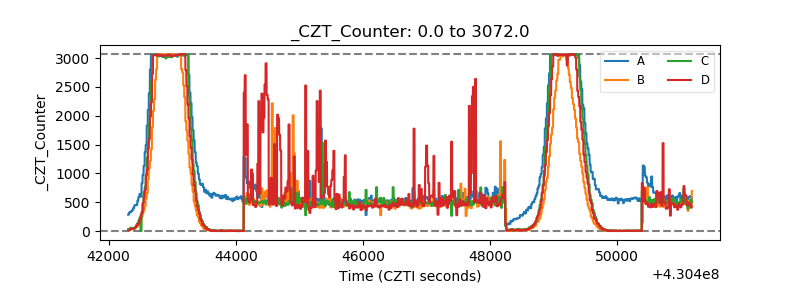 |
| +2.5 Volts monitor | 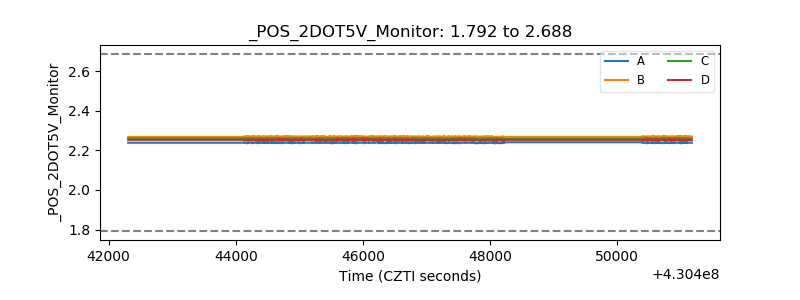 |
| +5 Volts monitor | 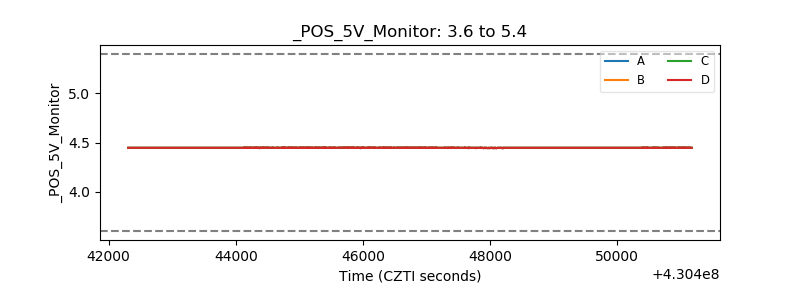 |
| _ROLL_ROT | 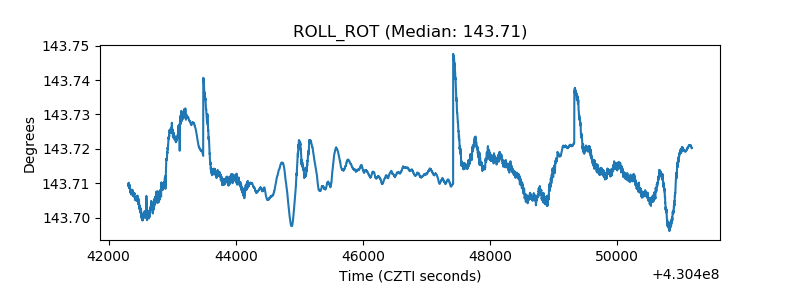 |
| _Roll_DEC | 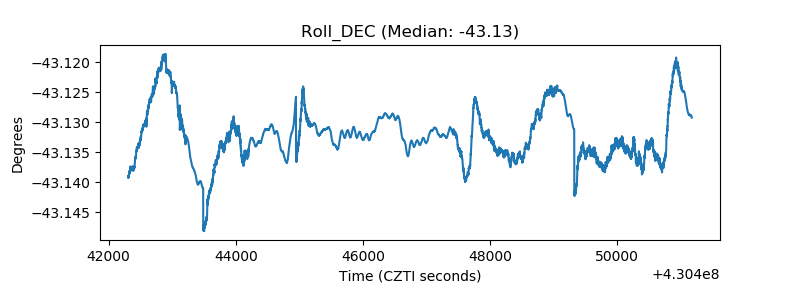 |
| _Roll_RA | 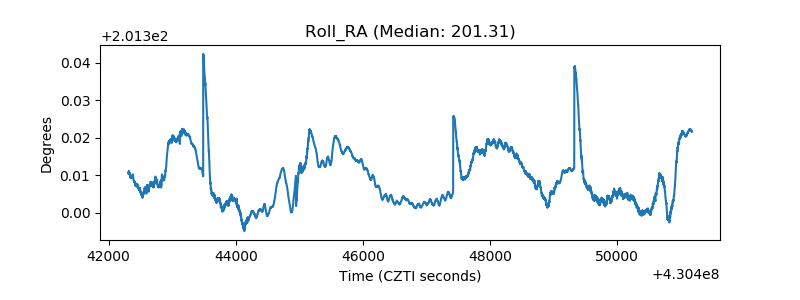 |
| Veto Counter | 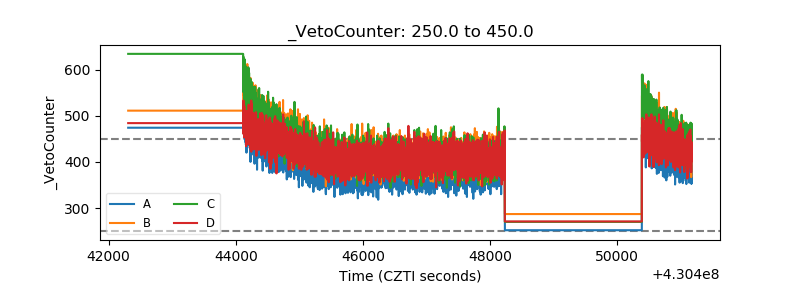 |