| Param | Original file | Final file |
|---|---|---|
| Filename | modeM0/AS1A05_013T01_9000005822_42722cztM0_level2.fits | modeM0/AS1A05_013T01_9000005822_42722cztM0_level2_quad_clean.evt |
| Size (bytes) | 335,255,040 | 89,657,280 |
| Size | 319.7 MB | 85.5 MB |
| Events in quadrant A | 3,112,414 | 618,937 |
| Events in quadrant B | 3,651,377 | 593,774 |
| Events in quadrant C | 2,770,620 | 591,228 |
| Events in quadrant D | 2,474,210 | 550,351 |
| Mode M0 | |||
|---|---|---|---|
| Quadrant | BADHDUFLAG | Total packets | Discarded packets |
| A | 0 | 12298 | 2 |
| B | 0 | 14158 | 2 |
| C | 0 | 11078 | 2 |
| D | 0 | 10791 | 2 |
| Mode M9 | |||
|---|---|---|---|
| Quadrant | BADHDUFLAG | Total packets | Discarded packets |
| A | 0 | 30 | 0 |
| B | 0 | 31 | 0 |
| C | 0 | 31 | 0 |
| D | 0 | 31 | 0 |
| Mode SS | |||
|---|---|---|---|
| Quadrant | BADHDUFLAG | Total packets | Discarded packets |
| A | 0 | 104 | 0 |
| B | 0 | 104 | 0 |
| C | 0 | 104 | 0 |
| D | 0 | 104 | 0 |
| Quadrant | Total seconds | Saturated seconds | Saturation percentage |
|---|---|---|---|
| A | 5152 | 42 | 0.815217% |
| B | 5152 | 415 | 8.055124% |
| C | 5152 | 101 | 1.960404% |
| D | 5152 | 16 | 0.310559% |
Noise dominated data is calculated using 1-second bins in cleaned event files. If a bin has >2000 counts, and if more than 50% of those come from <1% of pixels, then it is considered to be noise-dominated and hence unusable.
| Quadrant | # 1 sec bins | Bins with >0 counts | Bins with >2000 counts | High rate bins dominated by noise | Noise dominated (total time) | Noise dominated (detector-on time) | Marked lightcurve |
|---|---|---|---|---|---|---|---|
| A | 7305 | 5153 | 30 | 30 | 0.41% | 0.58% | 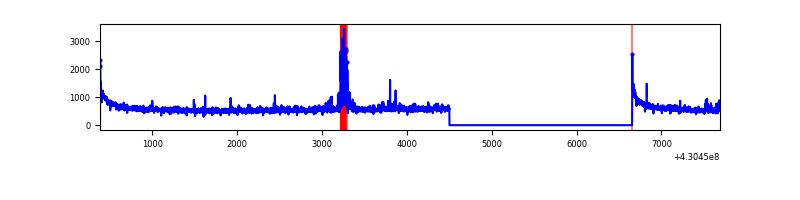 |
| B | 7305 | 5153 | 377 | 377 | 5.16% | 7.32% | 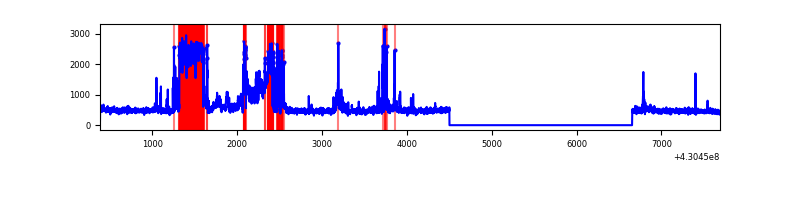 |
| C | 7305 | 5153 | 25 | 25 | 0.34% | 0.49% | 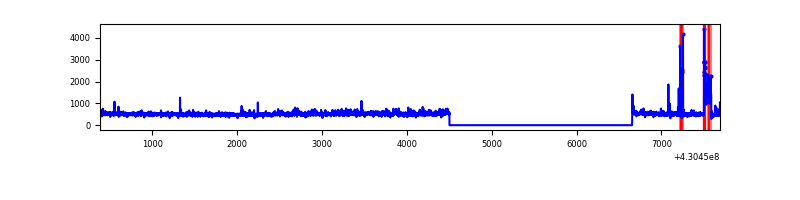 |
| D | 7305 | 5153 | 11 | 11 | 0.15% | 0.21% | 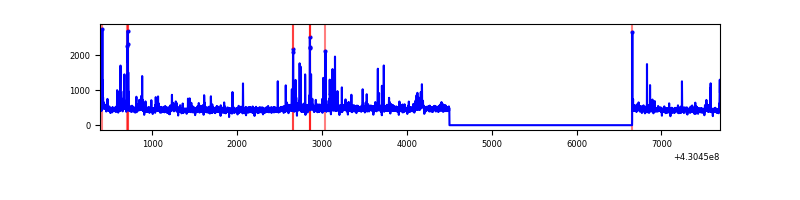 |
Top three noisy pixels from each quadrant. If the there are fewer than three noisy pixels in the level2.evt file, extra rows are filled as -1
| Pixel properties | Quadrant properties | ||||||
|---|---|---|---|---|---|---|---|
| Quadrant | DetID | PixID | Counts | Sigma | Mean | Median | Sigma |
| A | 10 | 83 | 565162 | 4605.35 | 599 | 588 | 122.6 |
| A | 13 | 248 | 131061 | 1064.3 | 599 | 588 | 122.6 |
| A | 12 | 189 | 95403 | 773.43 | 599 | 588 | 122.6 |
| B | 6 | 235 | 780772 | 6988.57 | 580 | 564 | 111.6 |
| B | 6 | 220 | 261513 | 2337.4 | 580 | 564 | 111.6 |
| B | 6 | 203 | 217299 | 1941.36 | 580 | 564 | 111.6 |
| C | 15 | 214 | 212909 | 1590.45 | 574 | 576 | 133.5 |
| C | 14 | 254 | 186029 | 1389.11 | 574 | 576 | 133.5 |
| C | 3 | 233 | 117320 | 874.46 | 574 | 576 | 133.5 |
| D | 2 | 249 | 67702 | 476.83 | 582 | 565 | 140.8 |
| D | 10 | 199 | 46245 | 324.44 | 582 | 565 | 140.8 |
| D | 12 | 6 | 29587 | 206.13 | 582 | 565 | 140.8 |
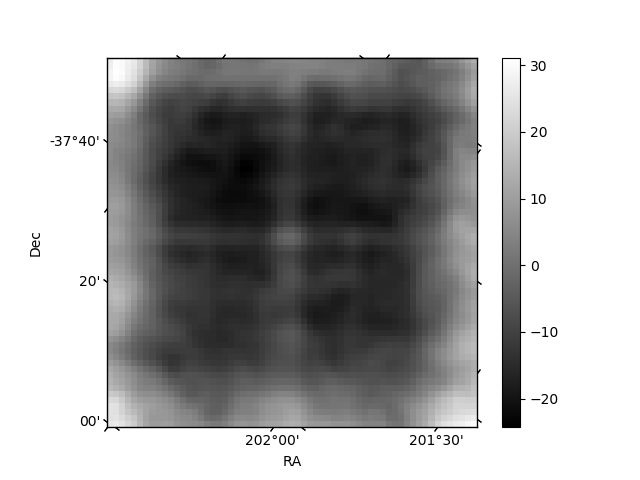
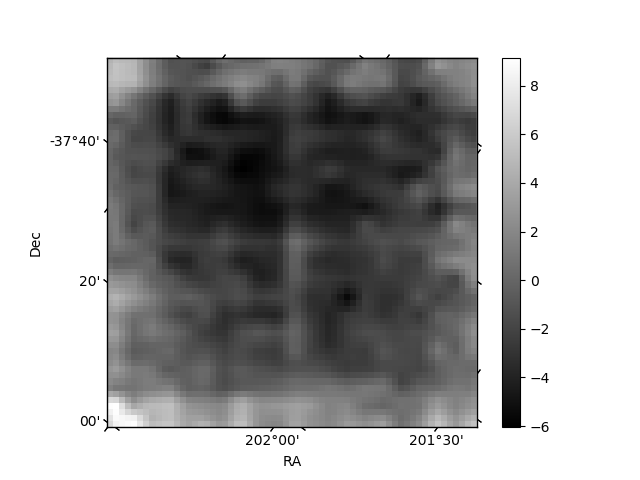
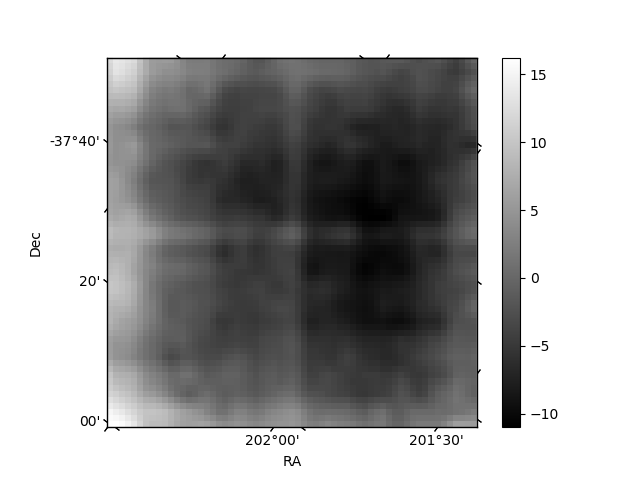
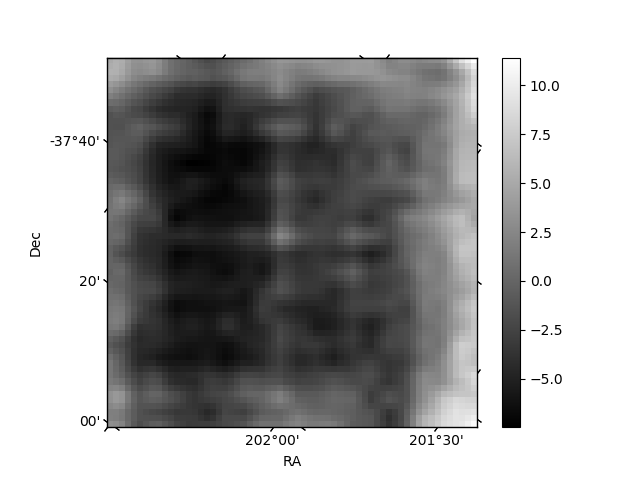
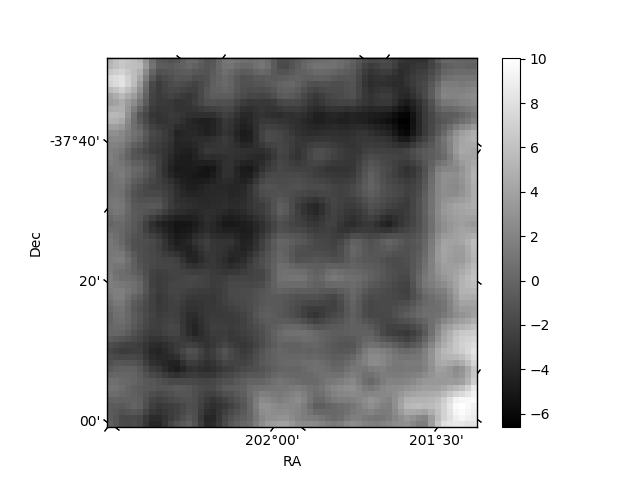
Histogram calculated using DETX and DETY for each event in the final _common_clean file
| Quadrant A | 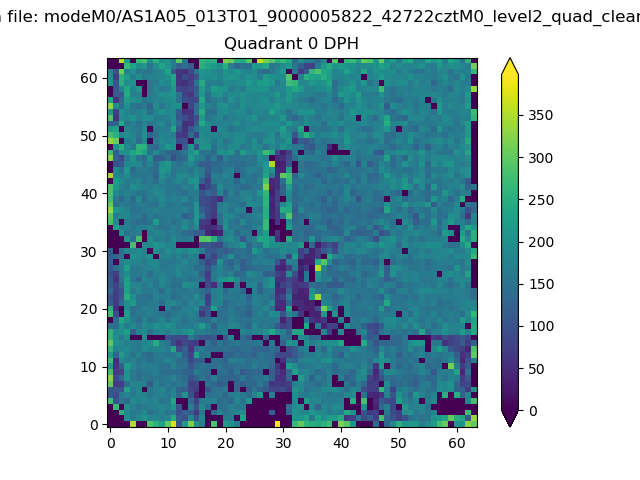 |
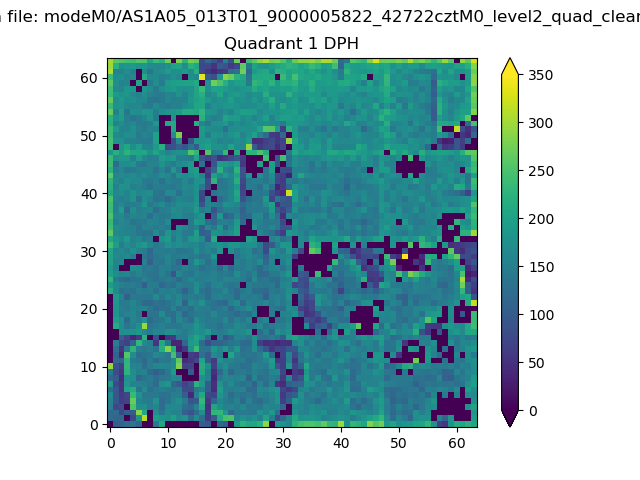 |
Quadrant B |
|---|---|---|---|
| Quadrant D |  |
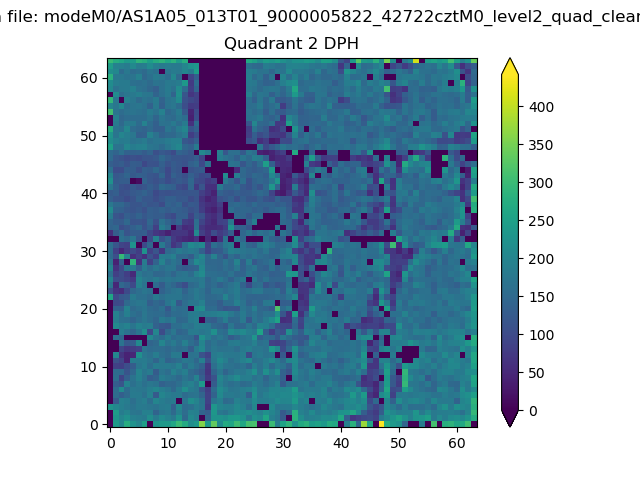 |
Quadrant C |
| Plot type | Count rate plots | Images |
|---|---|---|
| Comparison with Poisson distribution Blue bars denote a histogram of data divided into 1 sec bins. Red curve is a Poisson curve with rate = median count rate of data. |
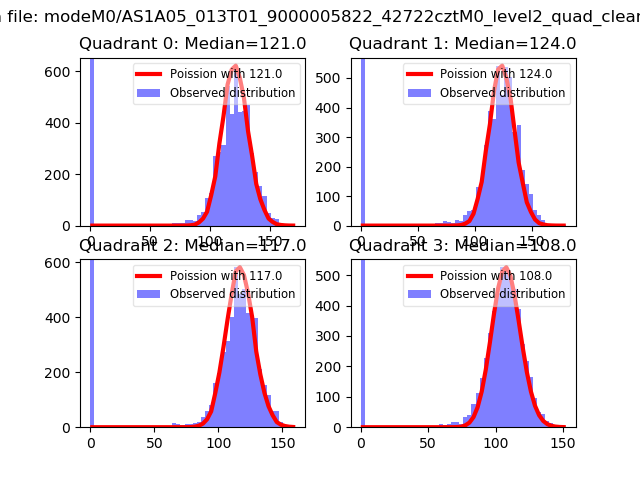 |
 |
| Quadrant-wise count rates Data is divided into 100 sec bins |
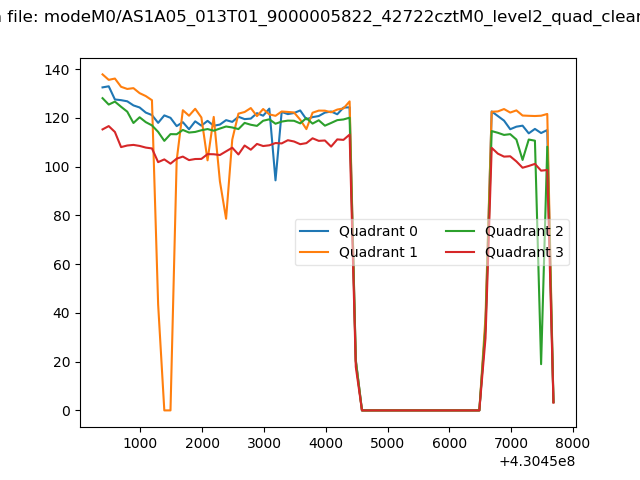 |
|
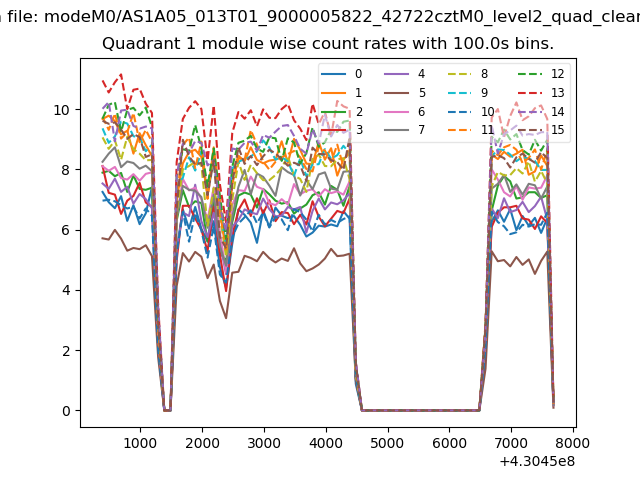
| Module-wise count rates for Quadrant A Data is divided into 100 sec bins |
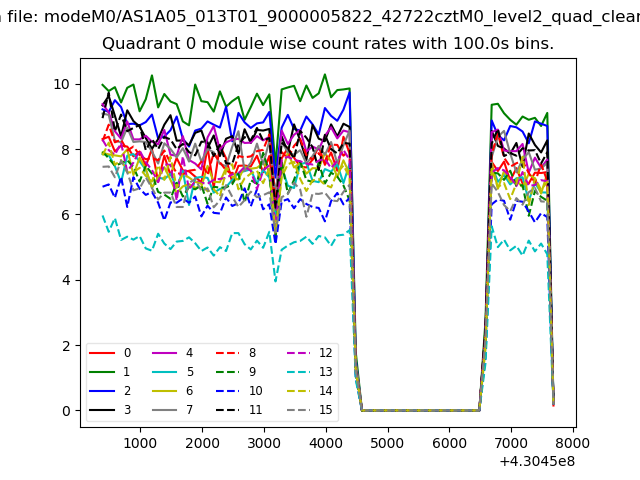 |
 |
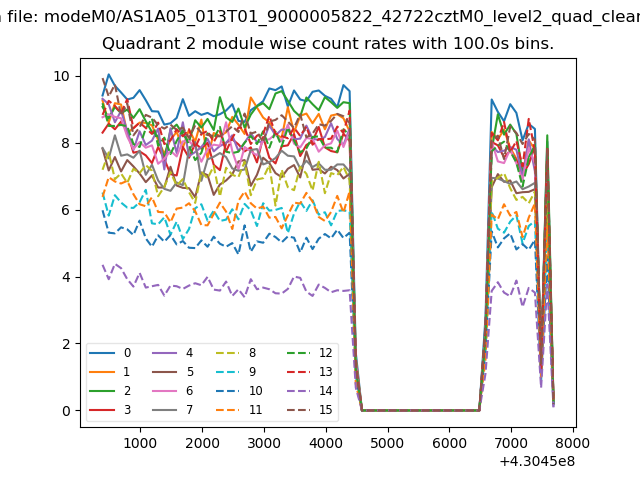
| Module-wise count rates for Quadrant B Data is divided into 100 sec bins |
 |
 |
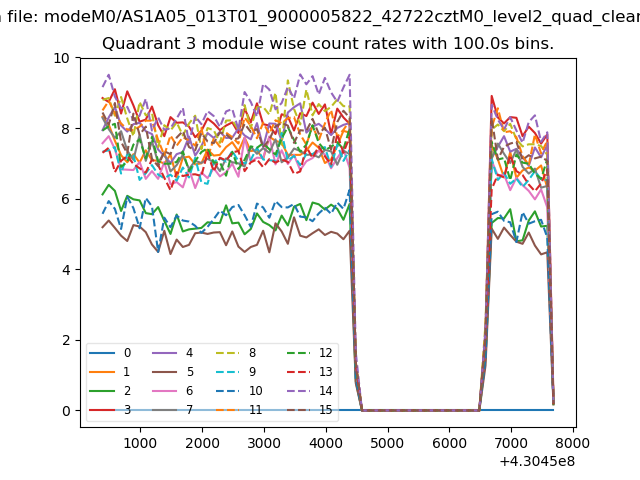
| Module-wise count rates for Quadrant C Data is divided into 100 sec bins |
 |
 |
| Module-wise count rates for Quadrant D Data is divided into 100 sec bins |
 |
 |
| Parameter | Plot |
|---|---|
| CZT HV Monitor | 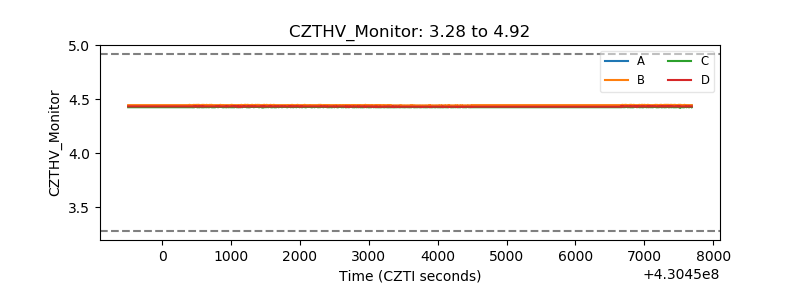 |
| D_VDD | 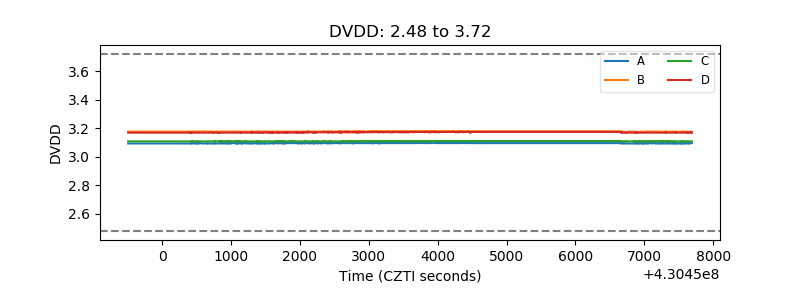 |
| Temperature 1 | 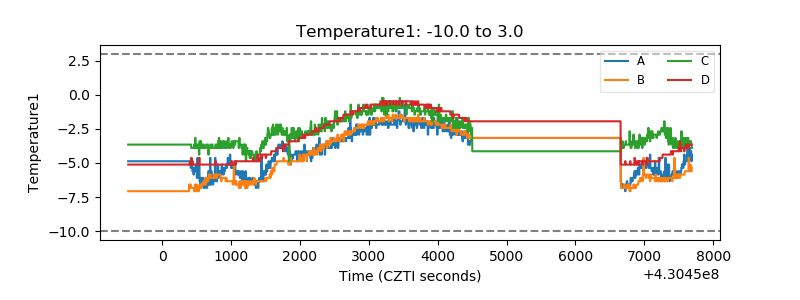 |
| Veto HV Monitor | 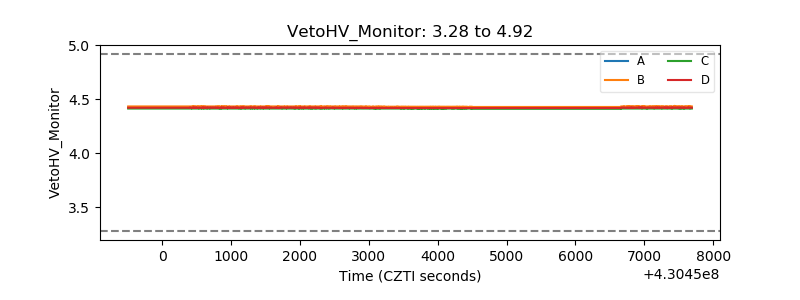 |
| Veto LLD | 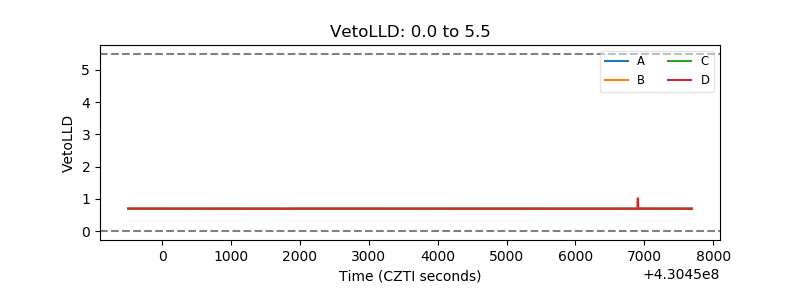 |
| Alpha Counter | 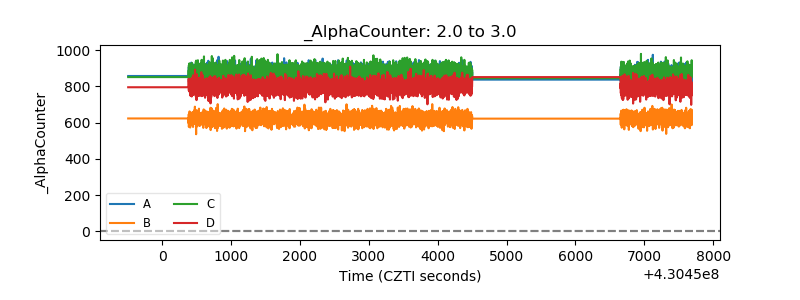 |
| _CPM_Rate | 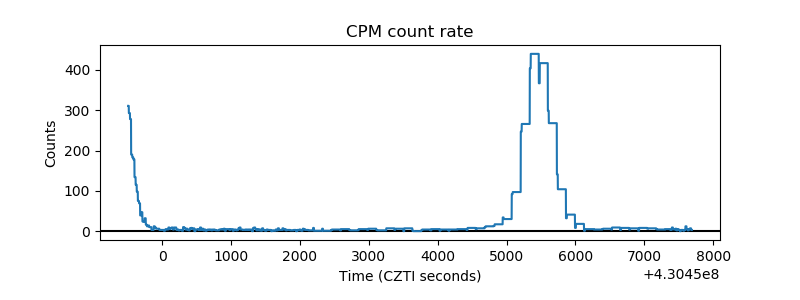 |
| CZT Counter | 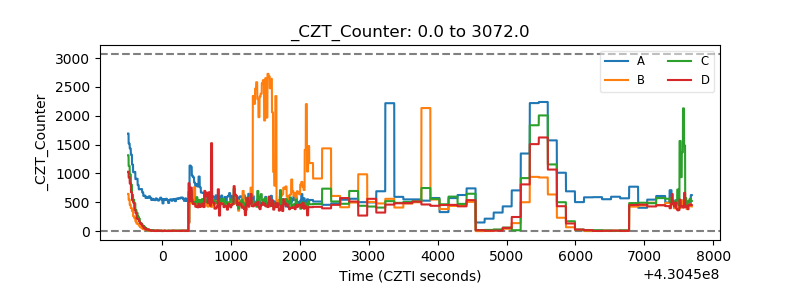 |
| +2.5 Volts monitor | 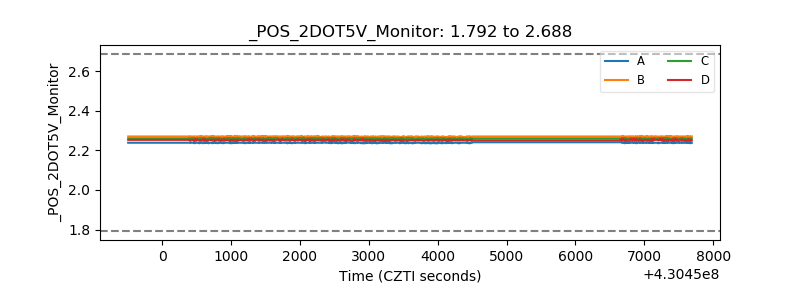 |
| +5 Volts monitor | 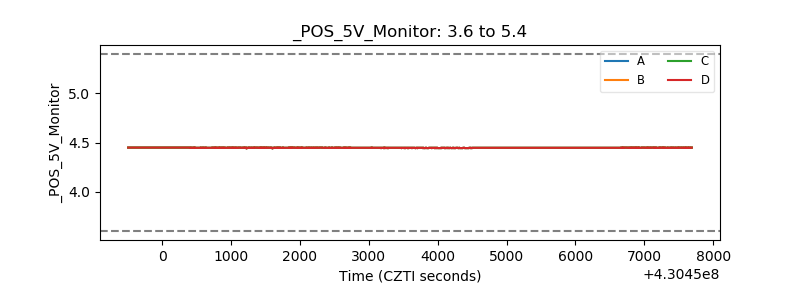 |
| _ROLL_ROT | 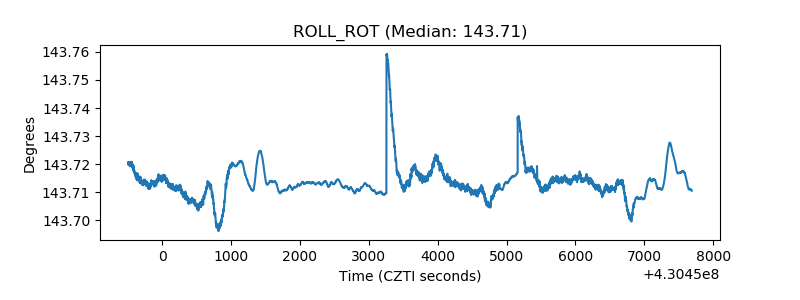 |
| _Roll_DEC | 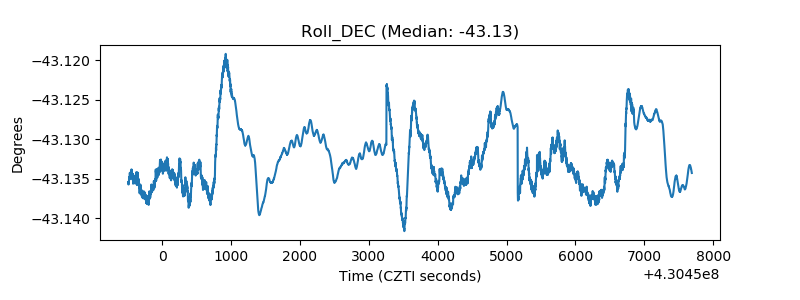 |
| _Roll_RA | 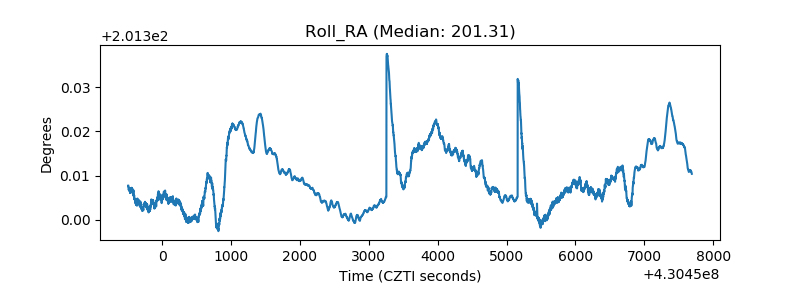 |
| Veto Counter | 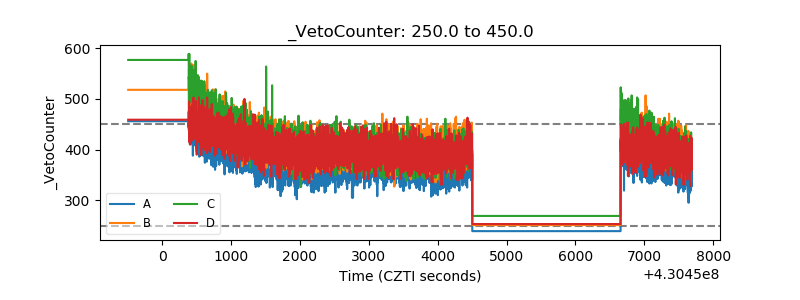 |