| Param | Original file | Final file |
|---|---|---|
| Filename | modeM0/AS1A05_013T01_9000005822_42724cztM0_level2.fits | modeM0/AS1A05_013T01_9000005822_42724cztM0_level2_quad_clean.evt |
| Size (bytes) | 308,053,440 | 89,311,680 |
| Size | 293.8 MB | 85.2 MB |
| Events in quadrant A | 3,060,303 | 599,158 |
| Events in quadrant B | 2,466,871 | 608,849 |
| Events in quadrant C | 2,654,382 | 583,439 |
| Events in quadrant D | 2,804,161 | 537,666 |
| Mode M0 | |||
|---|---|---|---|
| Quadrant | BADHDUFLAG | Total packets | Discarded packets |
| A | 0 | 12174 | 2 |
| B | 0 | 11037 | 2 |
| C | 0 | 11181 | 2 |
| D | 0 | 12099 | 2 |
| Mode M9 | |||
|---|---|---|---|
| Quadrant | BADHDUFLAG | Total packets | Discarded packets |
| A | 0 | 17 | 0 |
| B | 0 | 17 | 0 |
| C | 0 | 17 | 0 |
| D | 0 | 17 | 0 |
| Mode SS | |||
|---|---|---|---|
| Quadrant | BADHDUFLAG | Total packets | Discarded packets |
| A | 0 | 110 | 0 |
| B | 0 | 110 | 0 |
| C | 0 | 110 | 0 |
| D | 0 | 110 | 0 |
| Quadrant | Total seconds | Saturated seconds | Saturation percentage |
|---|---|---|---|
| A | 5354 | 13 | 0.242809% |
| B | 5355 | 32 | 0.597572% |
| C | 5355 | 15 | 0.280112% |
| D | 5355 | 60 | 1.120448% |
Noise dominated data is calculated using 1-second bins in cleaned event files. If a bin has >2000 counts, and if more than 50% of those come from <1% of pixels, then it is considered to be noise-dominated and hence unusable.
| Quadrant | # 1 sec bins | Bins with >0 counts | Bins with >2000 counts | High rate bins dominated by noise | Noise dominated (total time) | Noise dominated (detector-on time) | Marked lightcurve |
|---|---|---|---|---|---|---|---|
| A | 7057 | 5355 | 3 | 3 | 0.04% | 0.06% | 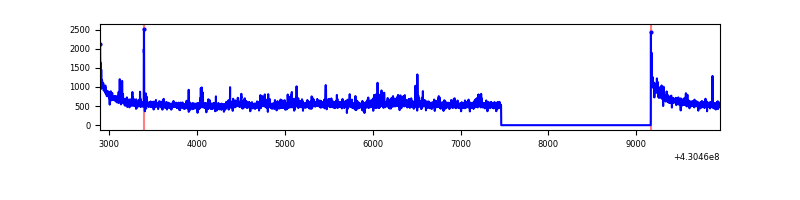 |
| B | 7058 | 5356 | 17 | 17 | 0.24% | 0.32% | 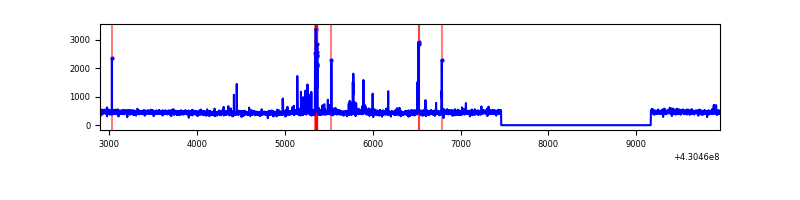 |
| C | 7058 | 5356 | 12 | 12 | 0.17% | 0.22% | 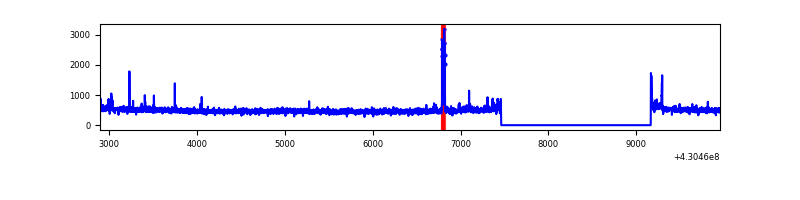 |
| D | 7058 | 5356 | 52 | 52 | 0.74% | 0.97% | 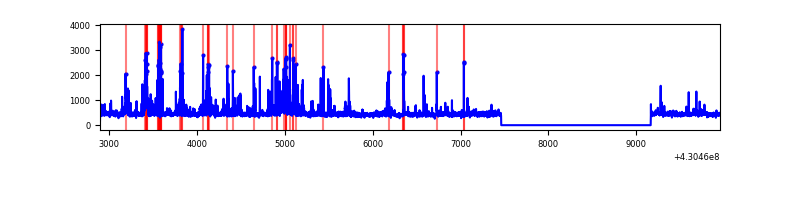 |
Top three noisy pixels from each quadrant. If the there are fewer than three noisy pixels in the level2.evt file, extra rows are filled as -1
| Pixel properties | Quadrant properties | ||||||
|---|---|---|---|---|---|---|---|
| Quadrant | DetID | PixID | Counts | Sigma | Mean | Median | Sigma |
| A | 10 | 83 | 581793 | 4755.45 | 595 | 585 | 122.2 |
| A | 12 | 189 | 126103 | 1026.99 | 595 | 585 | 122.2 |
| A | 13 | 248 | 33953 | 273.02 | 595 | 585 | 122.2 |
| B | 5 | 172 | 71666 | 616.46 | 588 | 571 | 115.3 |
| B | 0 | 245 | 30051 | 255.62 | 588 | 571 | 115.3 |
| B | 5 | 255 | 19849 | 167.16 | 588 | 571 | 115.3 |
| C | 15 | 214 | 228008 | 1682.3 | 577 | 580 | 135.2 |
| C | 14 | 254 | 70463 | 516.93 | 577 | 580 | 135.2 |
| C | 3 | 233 | 60292 | 441.69 | 577 | 580 | 135.2 |
| D | 2 | 249 | 392042 | 2779.89 | 576 | 559 | 140.8 |
| D | 10 | 199 | 50337 | 353.47 | 576 | 559 | 140.8 |
| D | 5 | 171 | 41329 | 289.5 | 576 | 559 | 140.8 |
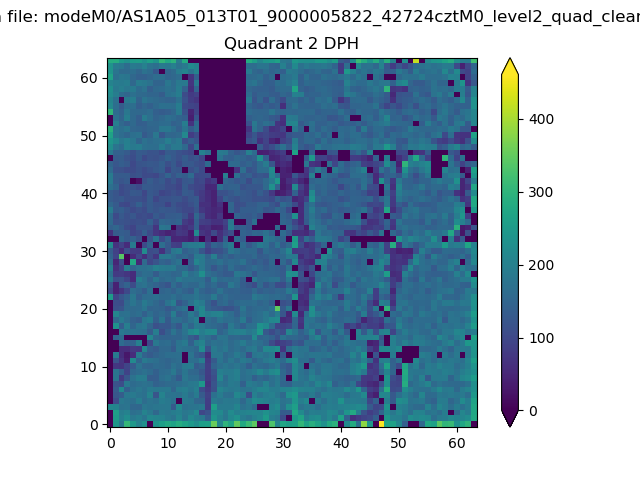
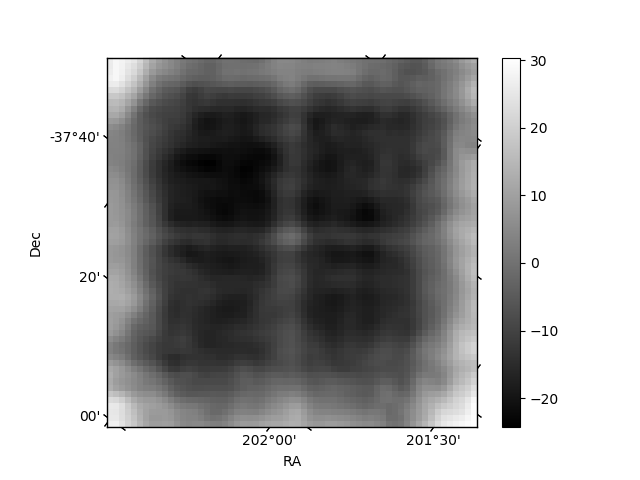
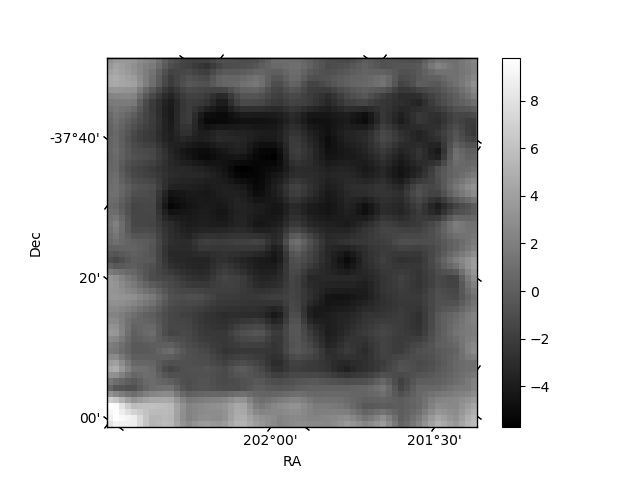
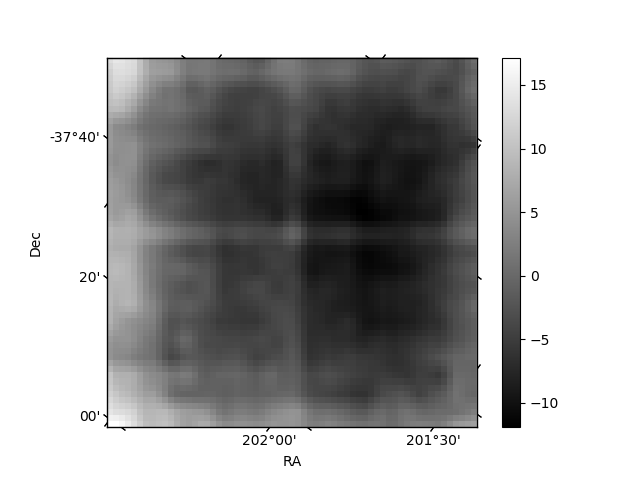
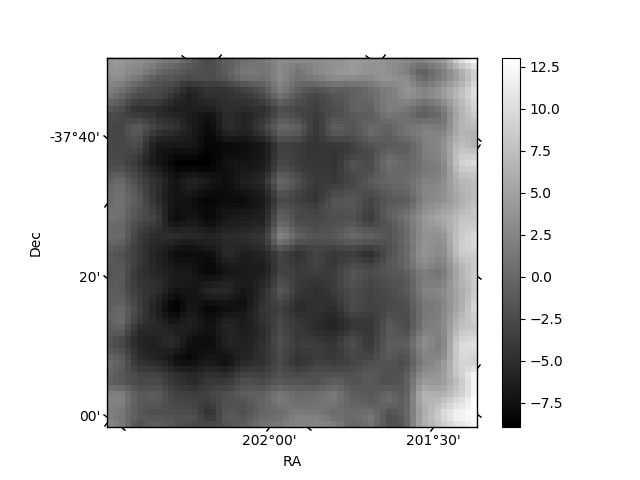
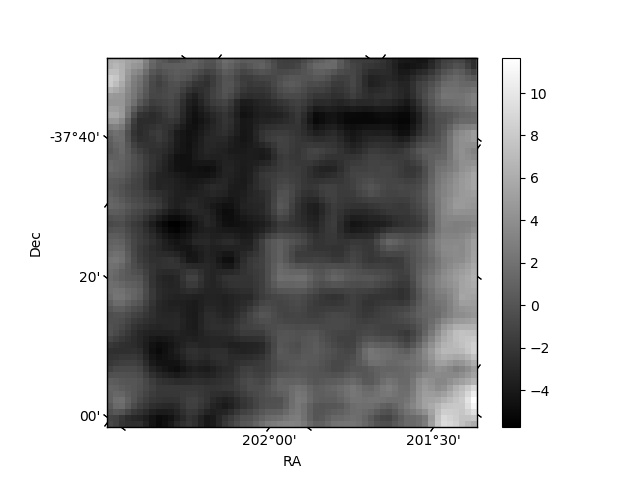
Histogram calculated using DETX and DETY for each event in the final _common_clean file
| Quadrant A | 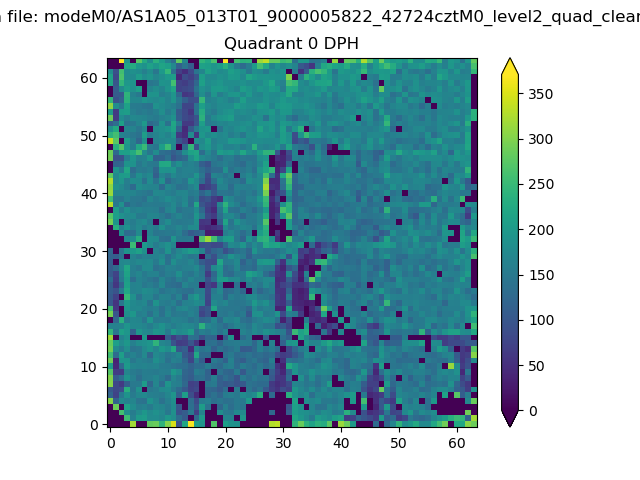 |
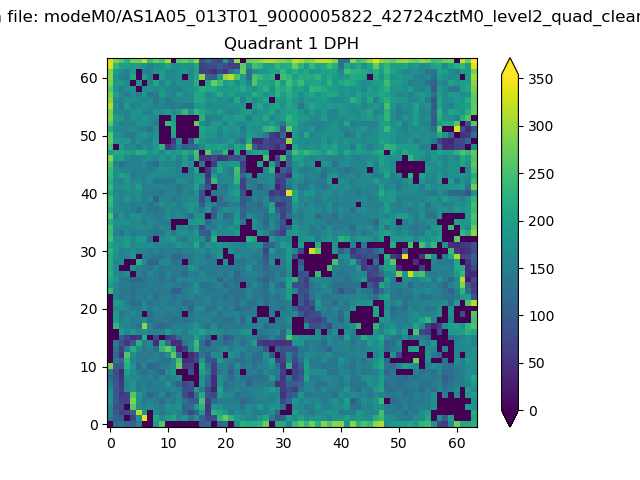 |
Quadrant B |
|---|---|---|---|
| Quadrant D | 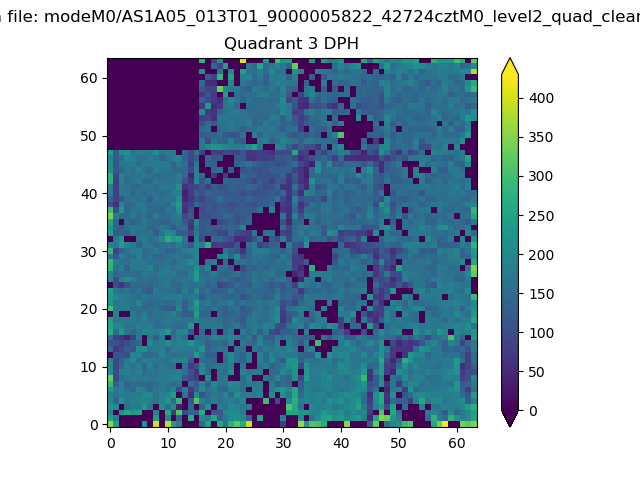 |
 |
Quadrant C |
| Plot type | Count rate plots | Images |
|---|---|---|
| Comparison with Poisson distribution Blue bars denote a histogram of data divided into 1 sec bins. Red curve is a Poisson curve with rate = median count rate of data. |
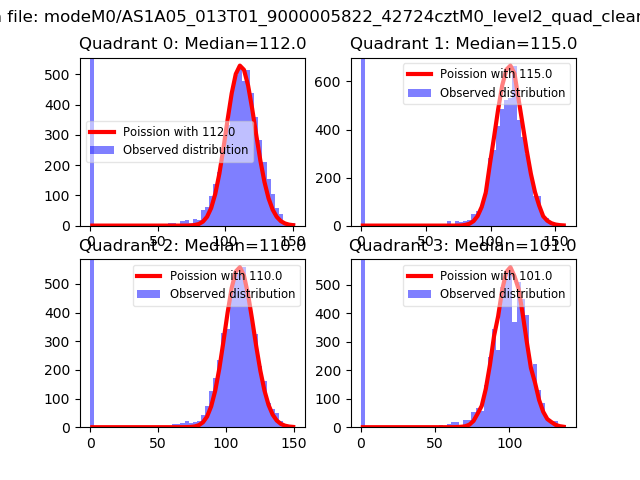 |
 |
| Quadrant-wise count rates Data is divided into 100 sec bins |
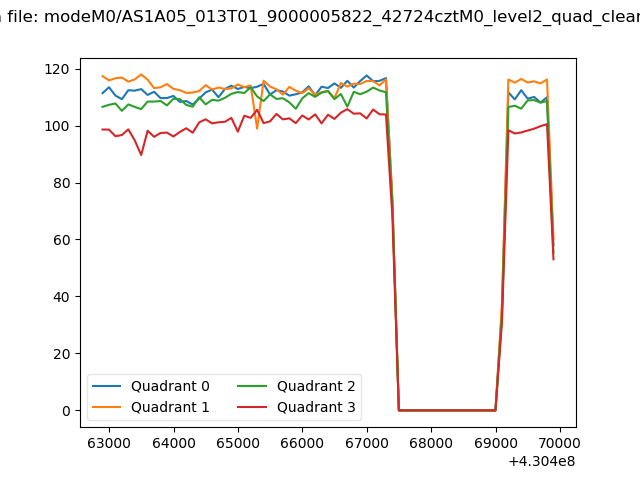 |
|
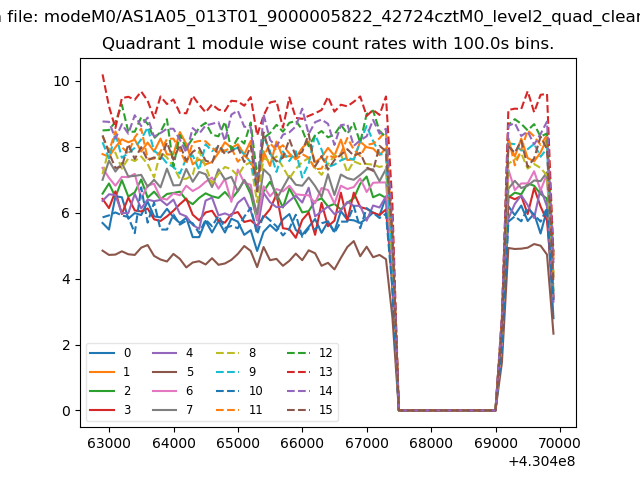
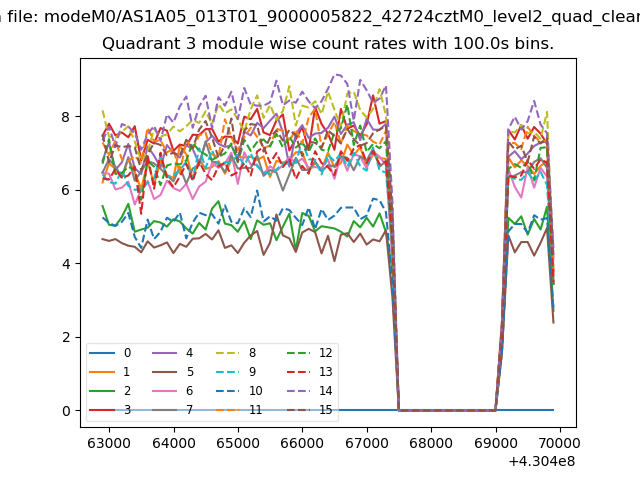
| Module-wise count rates for Quadrant A Data is divided into 100 sec bins |
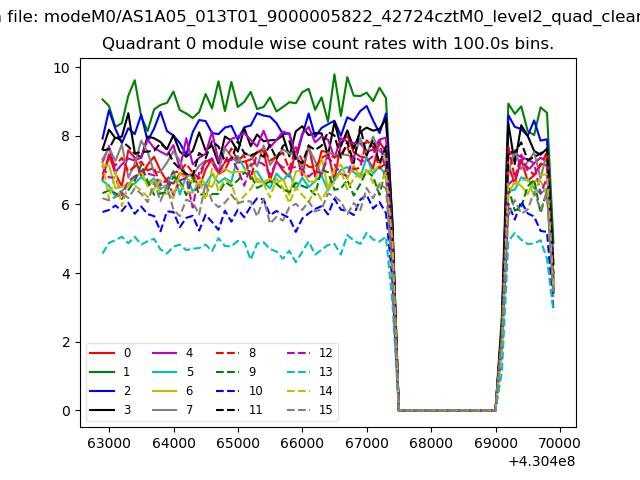 |
 |
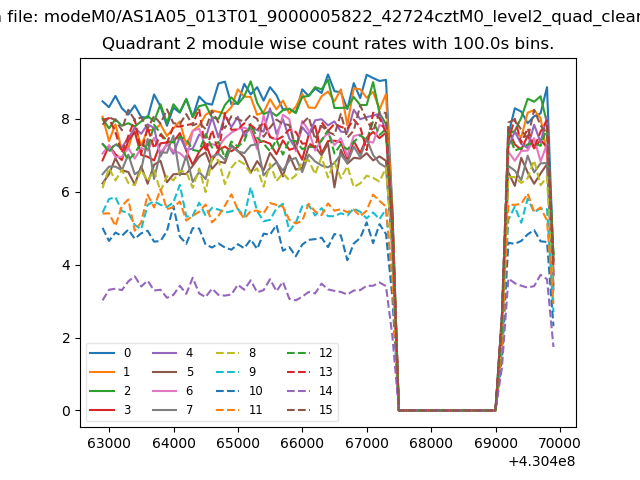
| Module-wise count rates for Quadrant B Data is divided into 100 sec bins |
 |
 |
| Module-wise count rates for Quadrant C Data is divided into 100 sec bins |
 |
 |
| Module-wise count rates for Quadrant D Data is divided into 100 sec bins |
 |
 |
| Parameter | Plot |
|---|---|
| CZT HV Monitor | 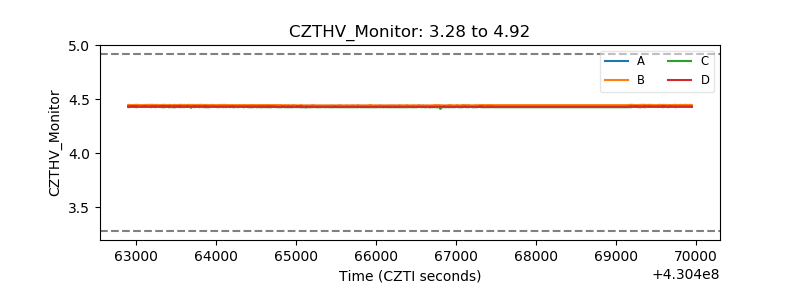 |
| D_VDD | 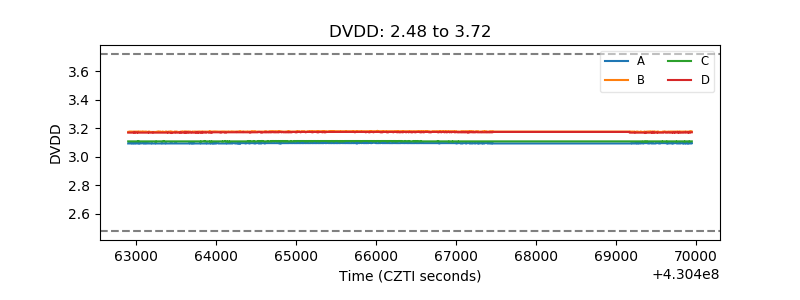 |
| Temperature 1 | 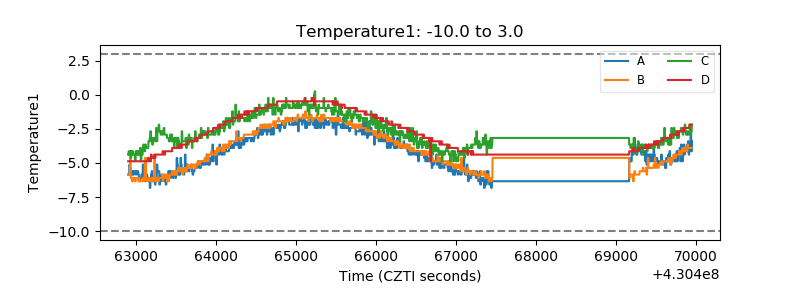 |
| Veto HV Monitor | 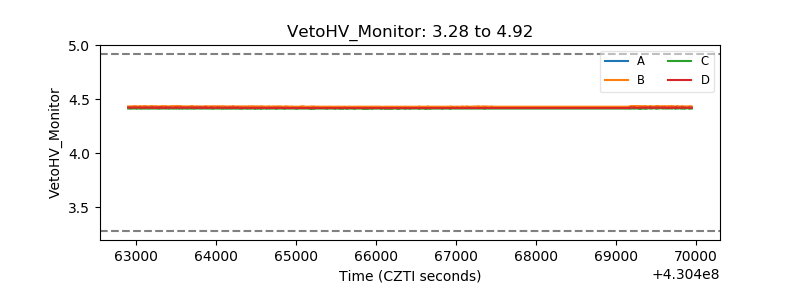 |
| Veto LLD |  |
| Alpha Counter | 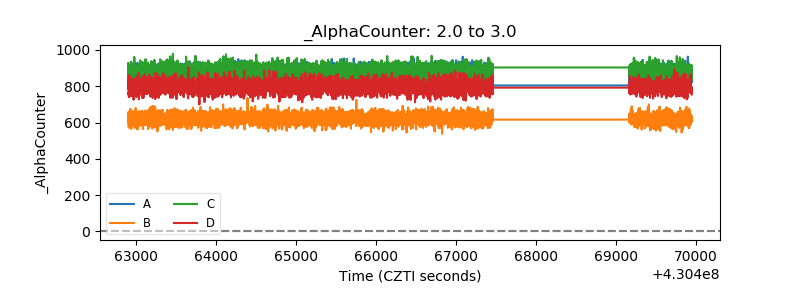 |
| _CPM_Rate | 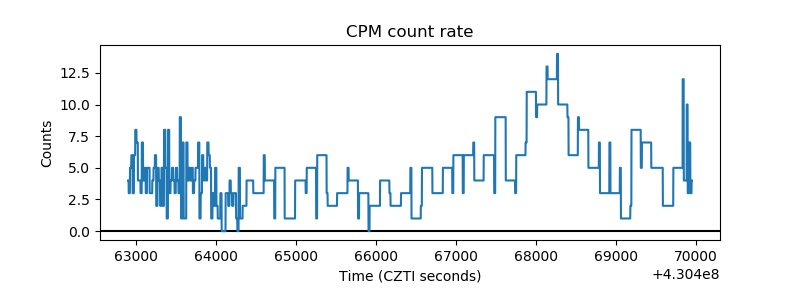 |
| CZT Counter | 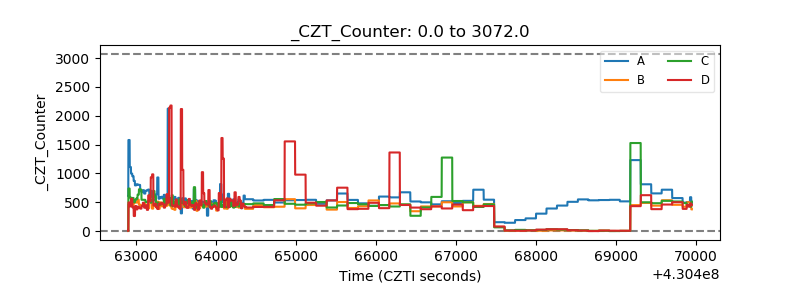 |
| +2.5 Volts monitor | 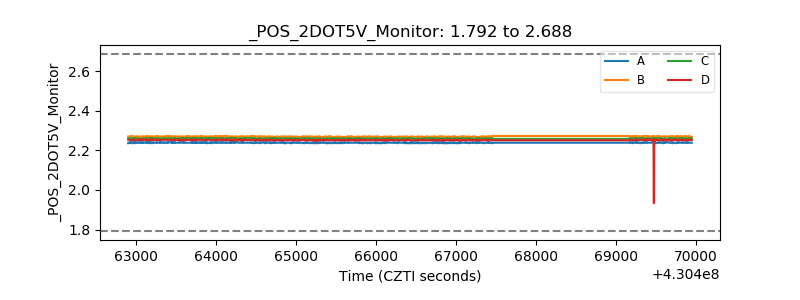 |
| +5 Volts monitor | 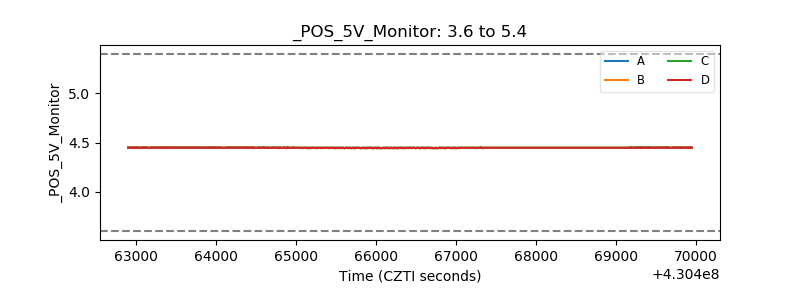 |
| _ROLL_ROT | 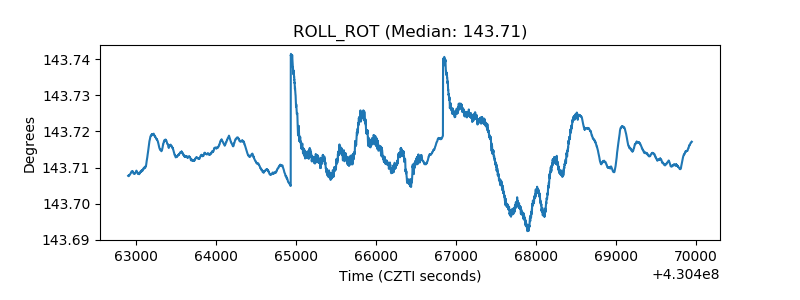 |
| _Roll_DEC | 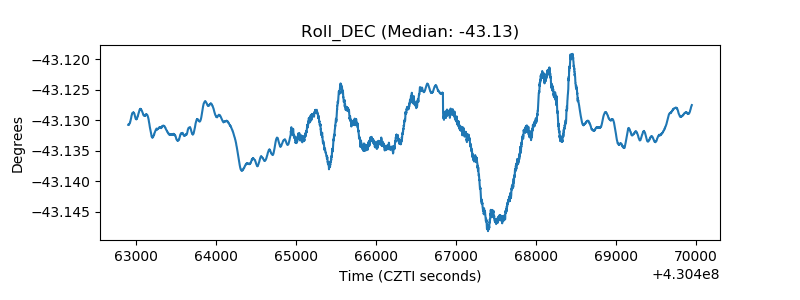 |
| _Roll_RA | 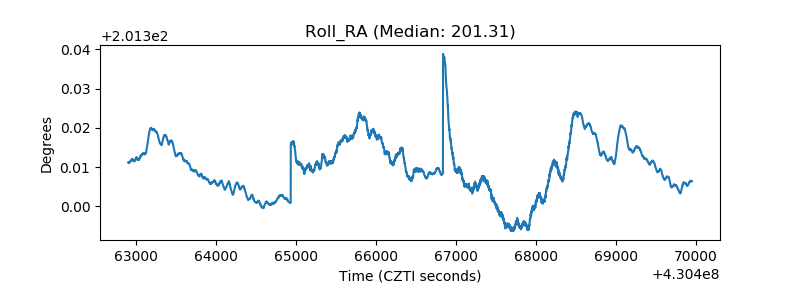 |
| Veto Counter | 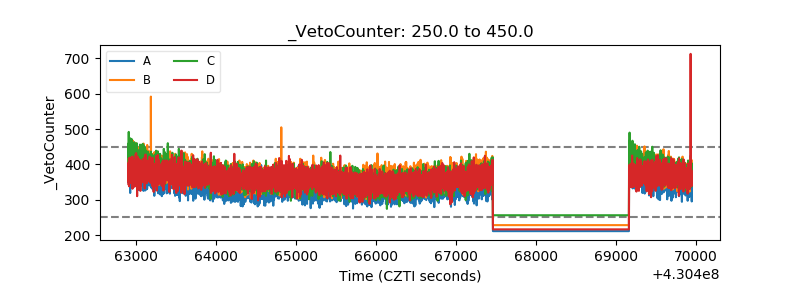 |