| Param | Original file | Final file |
|---|---|---|
| Filename | modeM0/AS1A05_013T01_9000005822_42725cztM0_level2.fits | modeM0/AS1A05_013T01_9000005822_42725cztM0_level2_quad_clean.evt |
| Size (bytes) | 351,365,760 | 96,333,120 |
| Size | 335.1 MB | 91.9 MB |
| Events in quadrant A | 3,292,093 | 646,128 |
| Events in quadrant B | 2,850,772 | 657,957 |
| Events in quadrant C | 2,861,540 | 633,672 |
| Events in quadrant D | 3,546,247 | 569,884 |
| Mode M0 | |||
|---|---|---|---|
| Quadrant | BADHDUFLAG | Total packets | Discarded packets |
| A | 0 | 13194 | 2 |
| B | 0 | 12597 | 2 |
| C | 0 | 12108 | 2 |
| D | 0 | 14621 | 2 |
| Mode M9 | |||
|---|---|---|---|
| Quadrant | BADHDUFLAG | Total packets | Discarded packets |
| A | 0 | 28 | 0 |
| B | 0 | 29 | 0 |
| C | 0 | 29 | 0 |
| D | 0 | 29 | 0 |
| Mode SS | |||
|---|---|---|---|
| Quadrant | BADHDUFLAG | Total packets | Discarded packets |
| A | 0 | 120 | 0 |
| B | 0 | 120 | 0 |
| C | 0 | 120 | 0 |
| D | 0 | 120 | 0 |
| Quadrant | Total seconds | Saturated seconds | Saturation percentage |
|---|---|---|---|
| A | 5853 | 13 | 0.222108% |
| B | 5853 | 31 | 0.529643% |
| C | 5853 | 10 | 0.170853% |
| D | 5853 | 223 | 3.810012% |
Noise dominated data is calculated using 1-second bins in cleaned event files. If a bin has >2000 counts, and if more than 50% of those come from <1% of pixels, then it is considered to be noise-dominated and hence unusable.
| Quadrant | # 1 sec bins | Bins with >0 counts | Bins with >2000 counts | High rate bins dominated by noise | Noise dominated (total time) | Noise dominated (detector-on time) | Marked lightcurve |
|---|---|---|---|---|---|---|---|
| A | 7257 | 5854 | 2 | 2 | 0.03% | 0.03% | 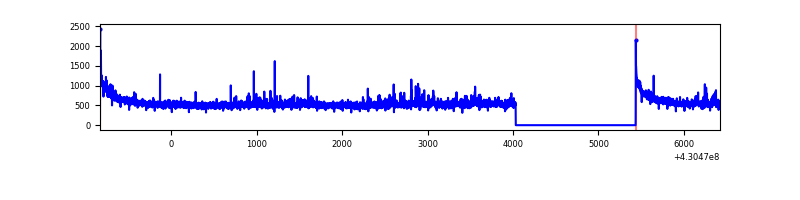 |
| B | 7257 | 5854 | 20 | 20 | 0.28% | 0.34% | 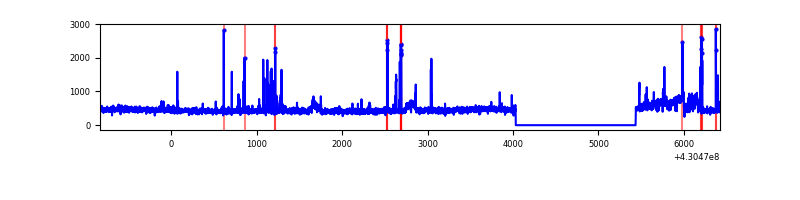 |
| C | 7257 | 5854 | 0 | 0 | 0.00% | 0.00% | 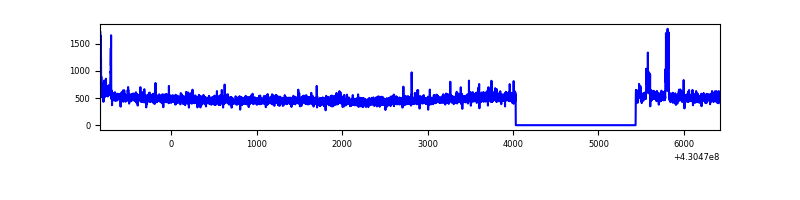 |
| D | 7257 | 5854 | 204 | 204 | 2.81% | 3.48% | 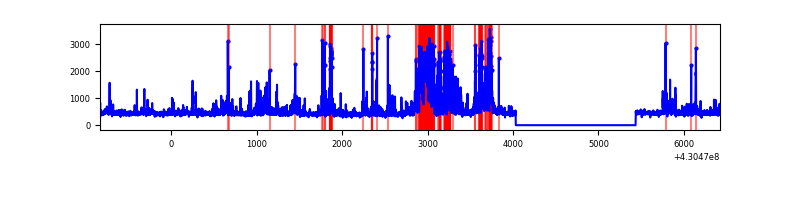 |
Top three noisy pixels from each quadrant. If the there are fewer than three noisy pixels in the level2.evt file, extra rows are filled as -1
| Pixel properties | Quadrant properties | ||||||
|---|---|---|---|---|---|---|---|
| Quadrant | DetID | PixID | Counts | Sigma | Mean | Median | Sigma |
| A | 10 | 83 | 634850 | 4733.56 | 648 | 634 | 134.0 |
| A | 12 | 189 | 118964 | 883.17 | 648 | 634 | 134.0 |
| A | 13 | 248 | 21138 | 153.03 | 648 | 634 | 134.0 |
| B | 6 | 235 | 171171 | 1368.97 | 638 | 621 | 124.6 |
| B | 5 | 172 | 68941 | 548.39 | 638 | 621 | 124.6 |
| B | 5 | 255 | 25654 | 200.93 | 638 | 621 | 124.6 |
| C | 15 | 214 | 246003 | 1671.02 | 629 | 632 | 146.8 |
| C | 3 | 233 | 85542 | 578.25 | 629 | 632 | 146.8 |
| C | 8 | 79 | 66217 | 446.64 | 629 | 632 | 146.8 |
| D | 2 | 249 | 792558 | 5189.8 | 625 | 607 | 152.6 |
| D | 13 | 249 | 80323 | 522.39 | 625 | 607 | 152.6 |
| D | 9 | 19 | 68119 | 442.42 | 625 | 607 | 152.6 |
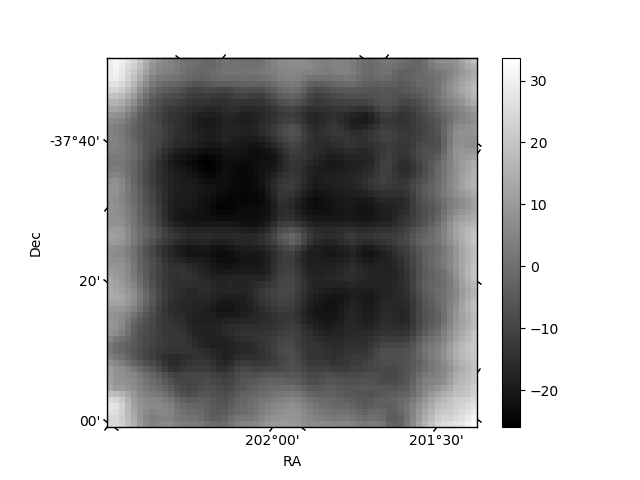
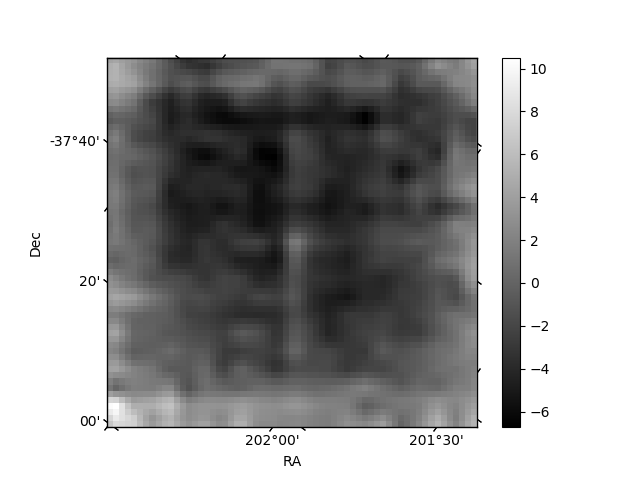
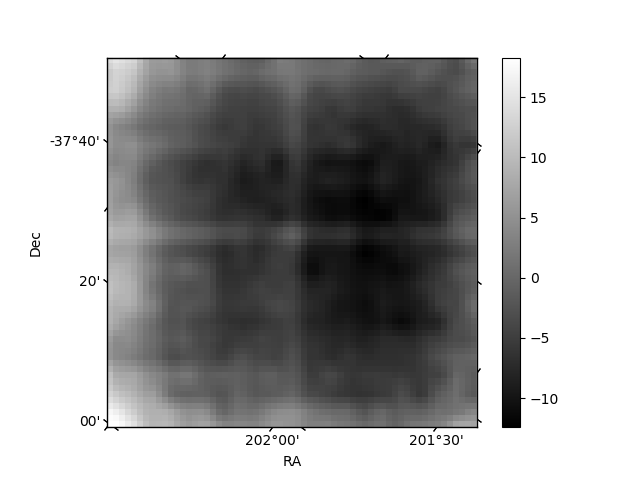
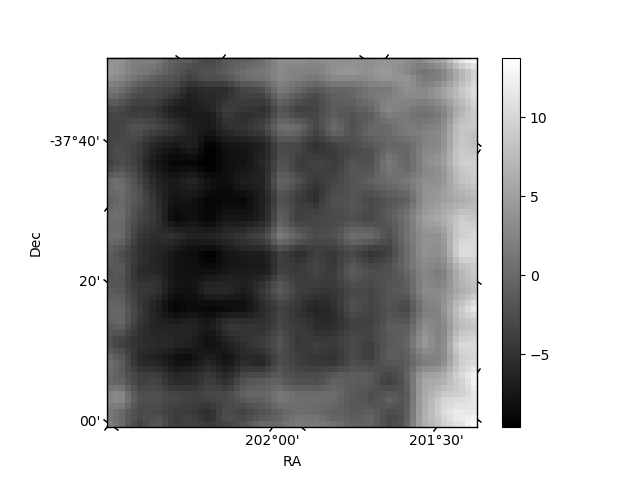
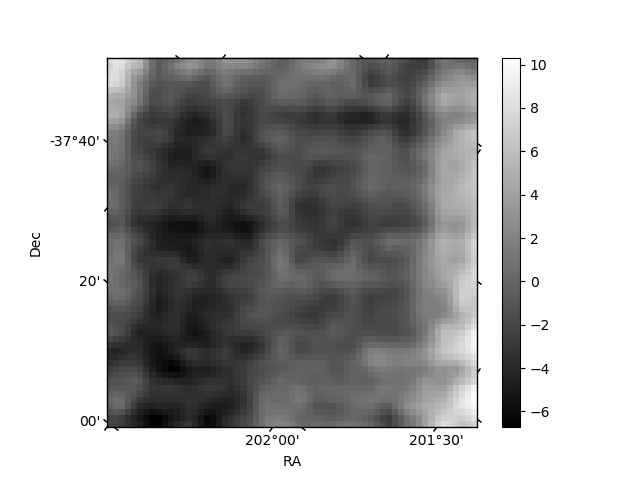
Histogram calculated using DETX and DETY for each event in the final _common_clean file
| Quadrant A | 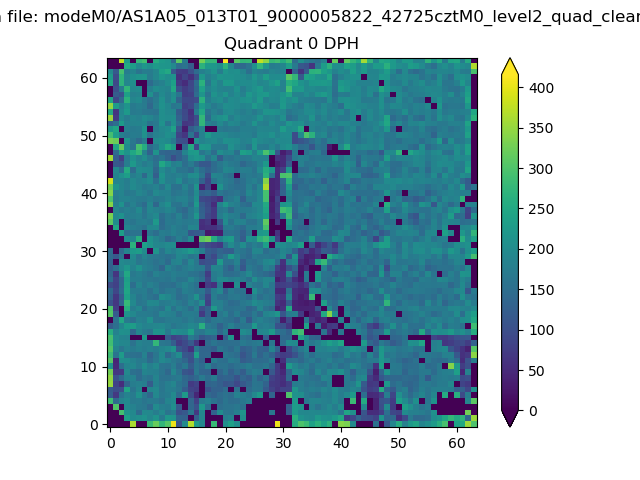 |
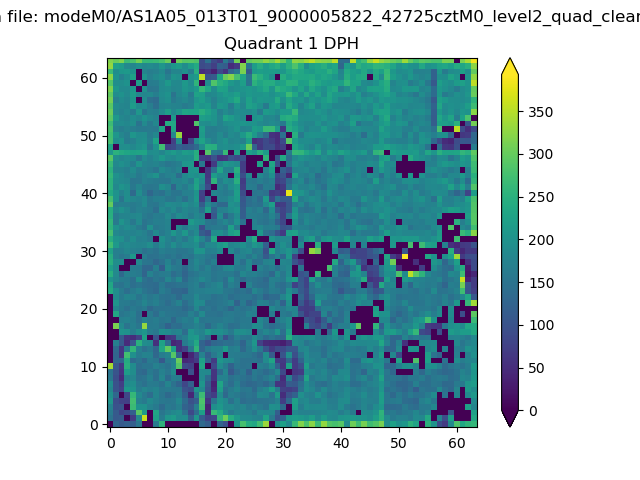 |
Quadrant B |
|---|---|---|---|
| Quadrant D | 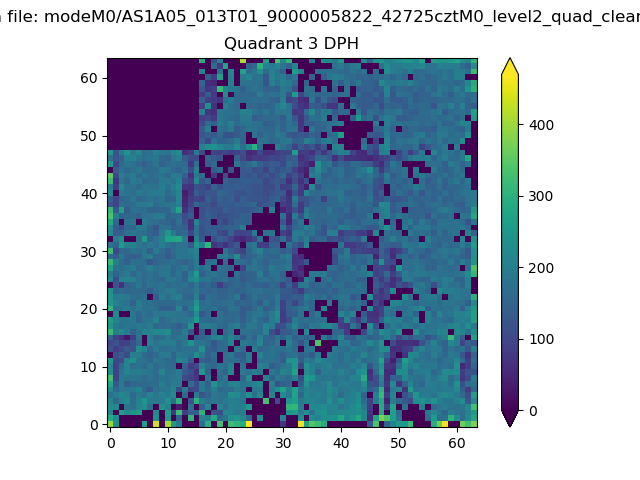 |
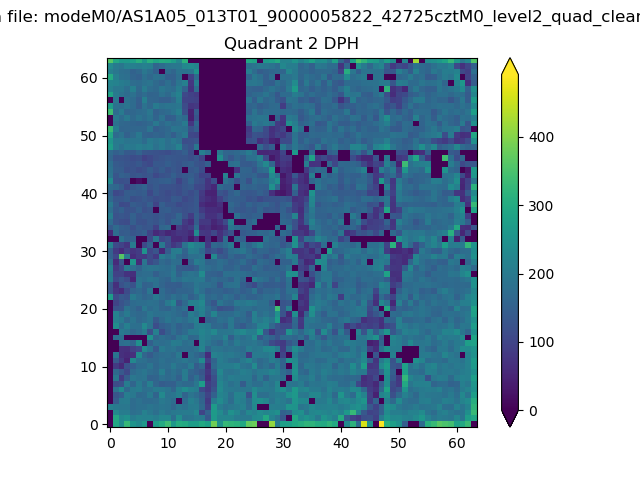 |
Quadrant C |
| Plot type | Count rate plots | Images |
|---|---|---|
| Comparison with Poisson distribution Blue bars denote a histogram of data divided into 1 sec bins. Red curve is a Poisson curve with rate = median count rate of data. |
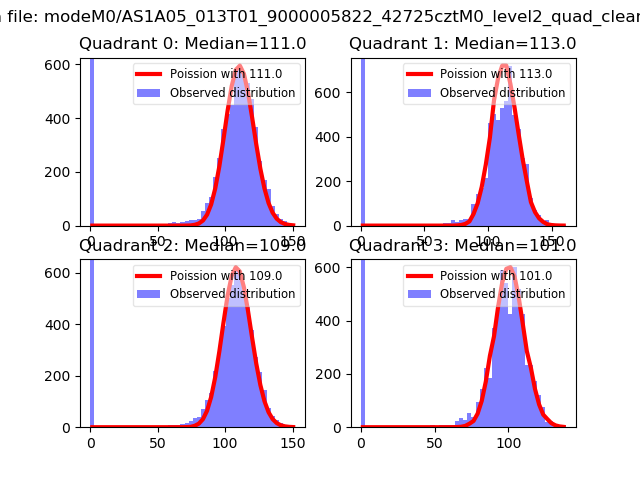 |
 |
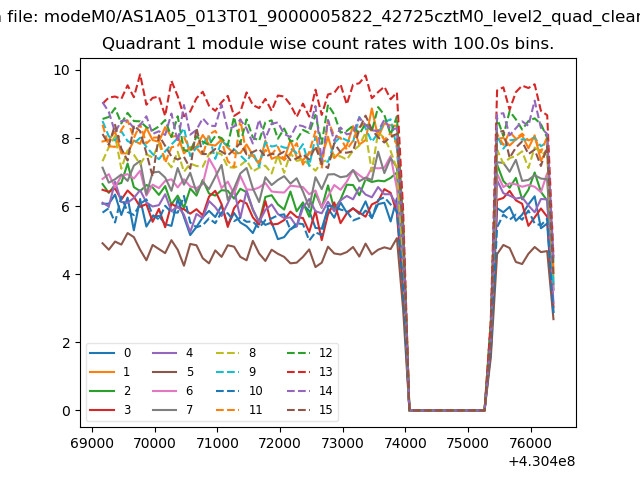
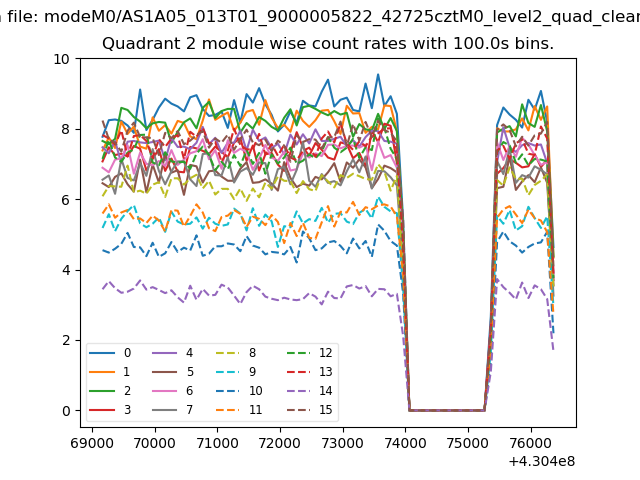
| Quadrant-wise count rates Data is divided into 100 sec bins |
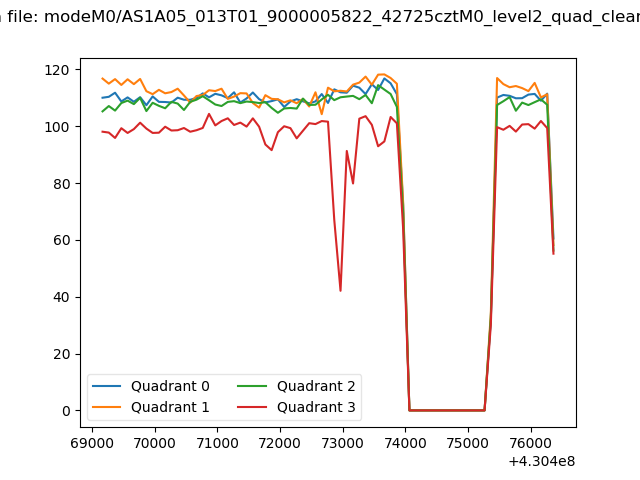 |
|
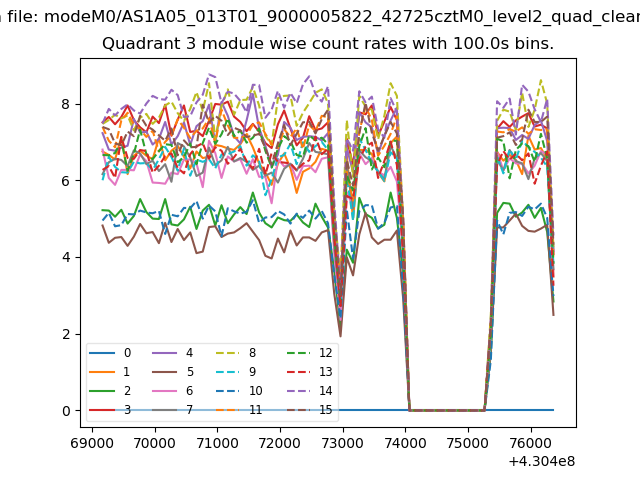
| Module-wise count rates for Quadrant A Data is divided into 100 sec bins |
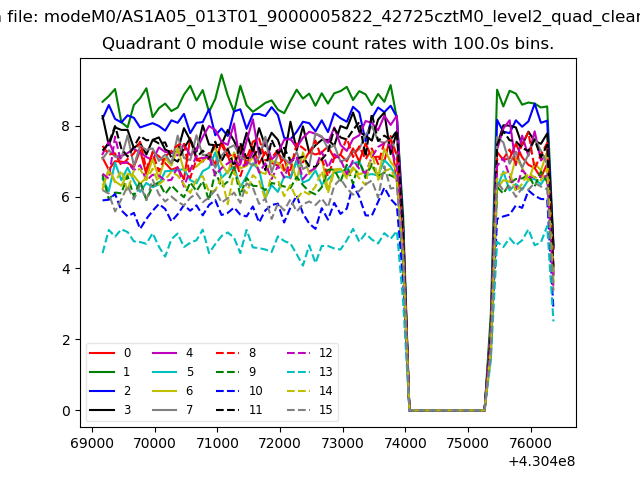 |
 |
| Module-wise count rates for Quadrant B Data is divided into 100 sec bins |
 |
 |
| Module-wise count rates for Quadrant C Data is divided into 100 sec bins |
 |
 |
| Module-wise count rates for Quadrant D Data is divided into 100 sec bins |
 |
 |
| Parameter | Plot |
|---|---|
| CZT HV Monitor |  |
| D_VDD | 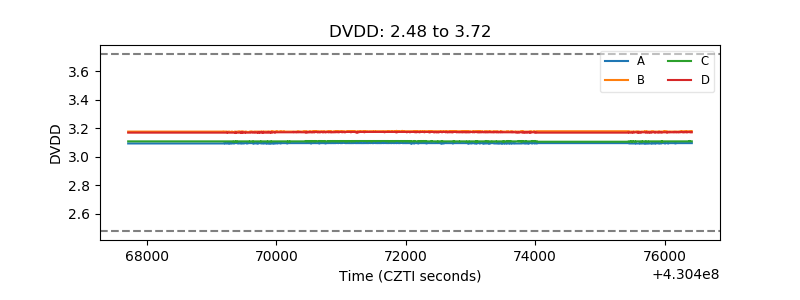 |
| Temperature 1 | 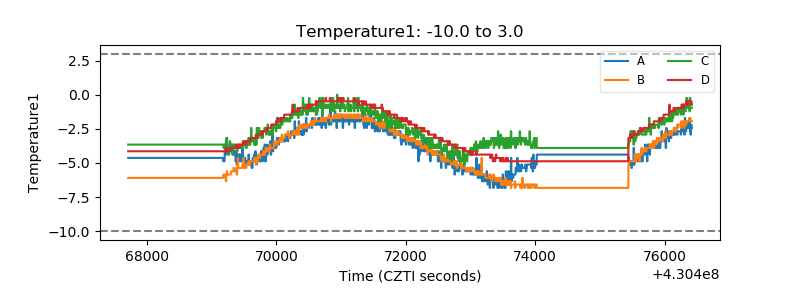 |
| Veto HV Monitor | 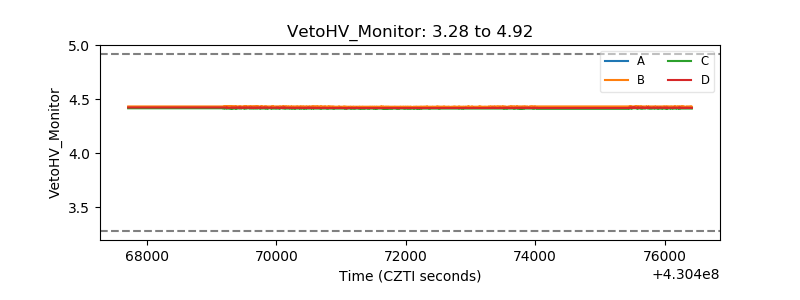 |
| Veto LLD | 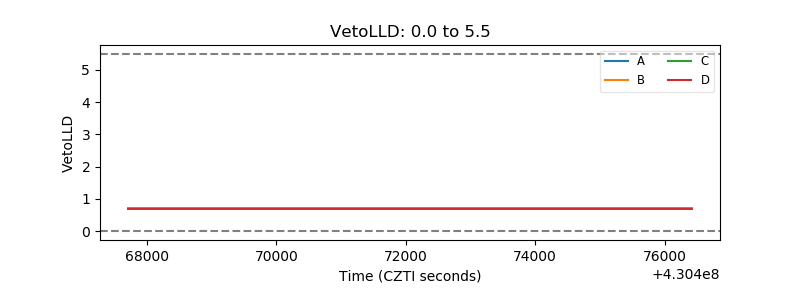 |
| Alpha Counter | 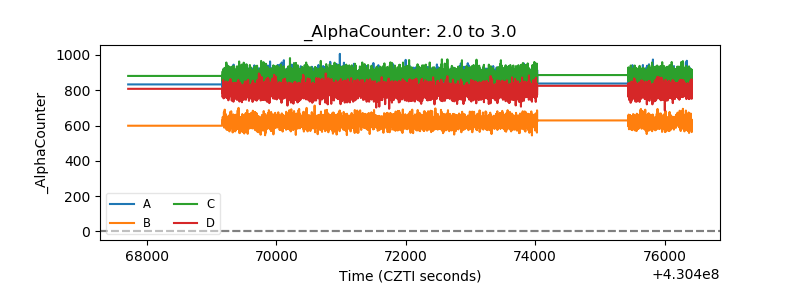 |
| _CPM_Rate | 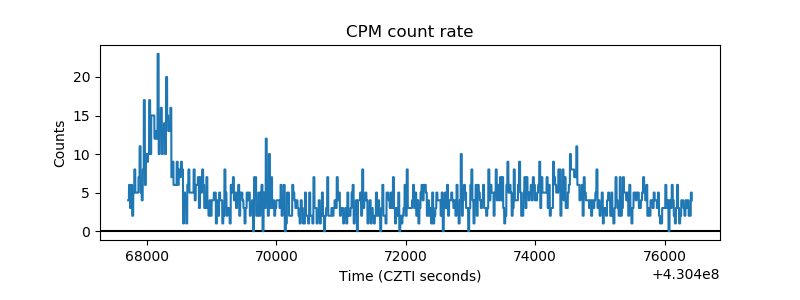 |
| CZT Counter | 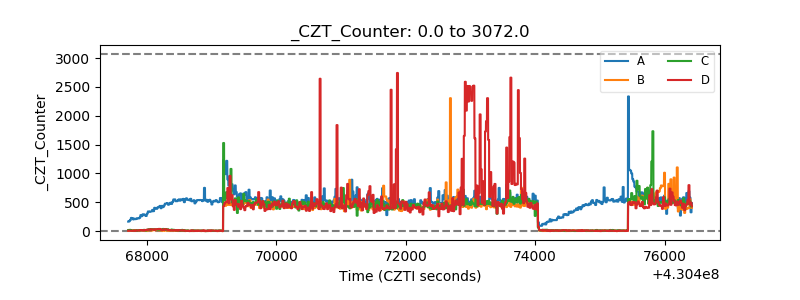 |
| +2.5 Volts monitor |  |
| +5 Volts monitor | 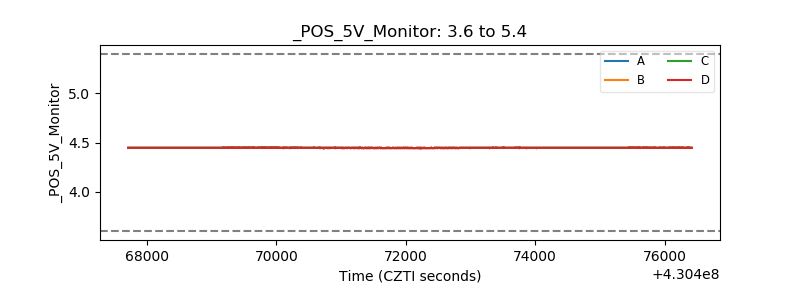 |
| _ROLL_ROT |  |
| _Roll_DEC | 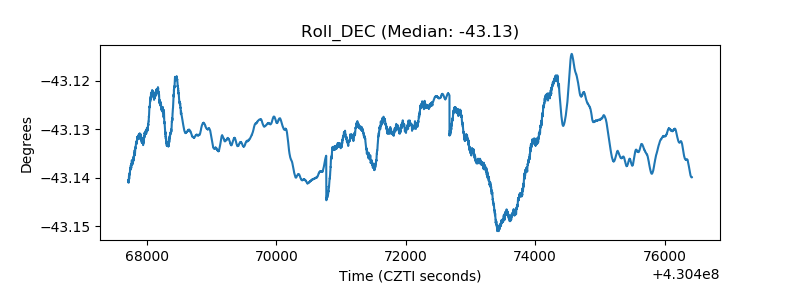 |
| _Roll_RA | 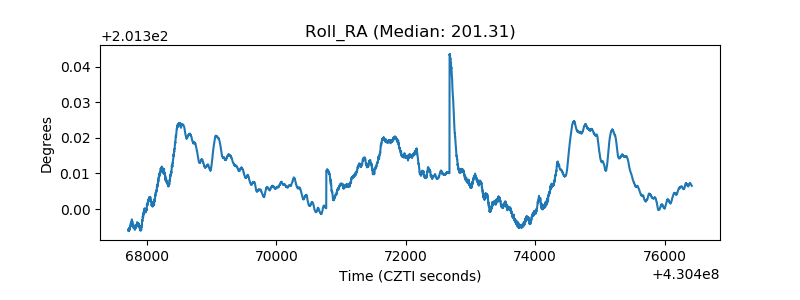 |
| Veto Counter | 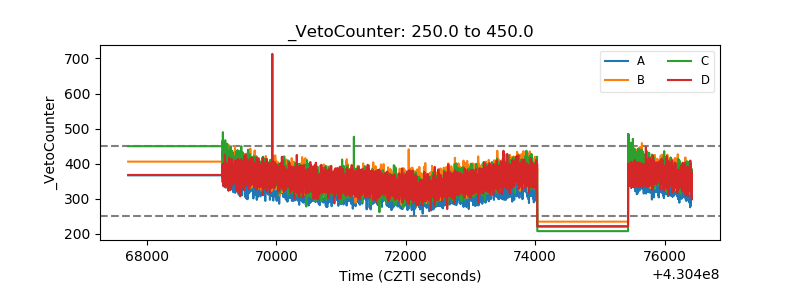 |