| Param | Original file | Final file |
|---|---|---|
| Filename | modeM0/AS1A05_013T01_9000005822_42729cztM0_level2.fits | modeM0/AS1A05_013T01_9000005822_42729cztM0_level2_quad_clean.evt |
| Size (bytes) | 1,157,515,200 | 236,917,440 |
| Size | 1.1 GB | 225.9 MB |
| Events in quadrant A | 8,244,264 | 1,681,512 |
| Events in quadrant B | 7,868,616 | 1,671,709 |
| Events in quadrant C | 16,272,209 | 1,258,533 |
| Events in quadrant D | 9,264,065 | 1,493,356 |
| Mode M0 | |||
|---|---|---|---|
| Quadrant | BADHDUFLAG | Total packets | Discarded packets |
| A | 0 | 33529 | 3 |
| B | 0 | 34098 | 3 |
| C | 0 | 58246 | 3 |
| D | 0 | 38686 | 5 |
| Mode M9 | |||
|---|---|---|---|
| Quadrant | BADHDUFLAG | Total packets | Discarded packets |
| A | 0 | 42 | 0 |
| B | 0 | 42 | 0 |
| C | 0 | 42 | 0 |
| D | 0 | 42 | 0 |
| Mode SS | |||
|---|---|---|---|
| Quadrant | BADHDUFLAG | Total packets | Discarded packets |
| A | 0 | 316 | 0 |
| B | 0 | 316 | 0 |
| C | 0 | 316 | 0 |
| D | 0 | 316 | 0 |
| Quadrant | Total seconds | Saturated seconds | Saturation percentage |
|---|---|---|---|
| A | 15473 | 31 | 0.200349% |
| B | 15473 | 273 | 1.764364% |
| C | 15474 | 3655 | 23.620266% |
| D | 15473 | 415 | 2.682091% |
Noise dominated data is calculated using 1-second bins in cleaned event files. If a bin has >2000 counts, and if more than 50% of those come from <1% of pixels, then it is considered to be noise-dominated and hence unusable.
| Quadrant | # 1 sec bins | Bins with >0 counts | Bins with >2000 counts | High rate bins dominated by noise | Noise dominated (total time) | Noise dominated (detector-on time) | Marked lightcurve |
|---|---|---|---|---|---|---|---|
| A | 19683 | 15476 | 7 | 7 | 0.04% | 0.05% |  |
| B | 19682 | 15475 | 230 | 230 | 1.17% | 1.49% |  |
| C | 19684 | 15476 | 3595 | 3595 | 18.26% | 23.23% |  |
| D | 19683 | 15476 | 349 | 349 | 1.77% | 2.26% |  |
Top three noisy pixels from each quadrant. If the there are fewer than three noisy pixels in the level2.evt file, extra rows are filled as -1
| Pixel properties | Quadrant properties | ||||||
|---|---|---|---|---|---|---|---|
| Quadrant | DetID | PixID | Counts | Sigma | Mean | Median | Sigma |
| A | 10 | 83 | 1536549 | 4427.1 | 1697 | 1664 | 346.7 |
| A | 12 | 189 | 72495 | 204.3 | 1697 | 1664 | 346.7 |
| A | 13 | 248 | 46897 | 130.47 | 1697 | 1664 | 346.7 |
| B | 0 | 229 | 678534 | 2090.82 | 1670 | 1622 | 323.8 |
| B | 5 | 172 | 386939 | 1190.15 | 1670 | 1622 | 323.8 |
| B | 0 | 245 | 66169 | 199.37 | 1670 | 1622 | 323.8 |
| C | 8 | 79 | 10117367 | 31356.67 | 1383 | 1392 | 322.6 |
| C | 15 | 214 | 548255 | 1695.12 | 1383 | 1392 | 322.6 |
| C | 0 | 207 | 93787 | 286.4 | 1383 | 1392 | 322.6 |
| D | 2 | 249 | 1723213 | 4304.82 | 1632 | 1586 | 399.9 |
| D | 12 | 233 | 306083 | 761.38 | 1632 | 1586 | 399.9 |
| D | 13 | 112 | 207404 | 514.64 | 1632 | 1586 | 399.9 |
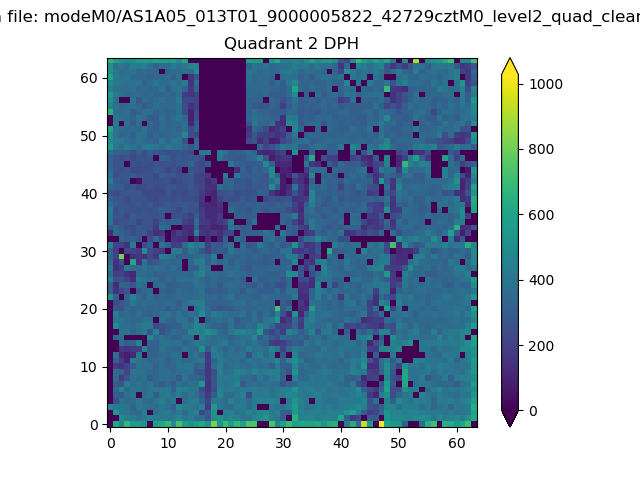
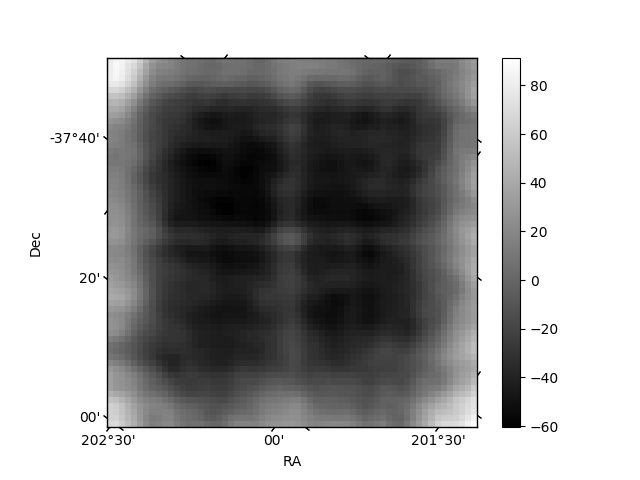
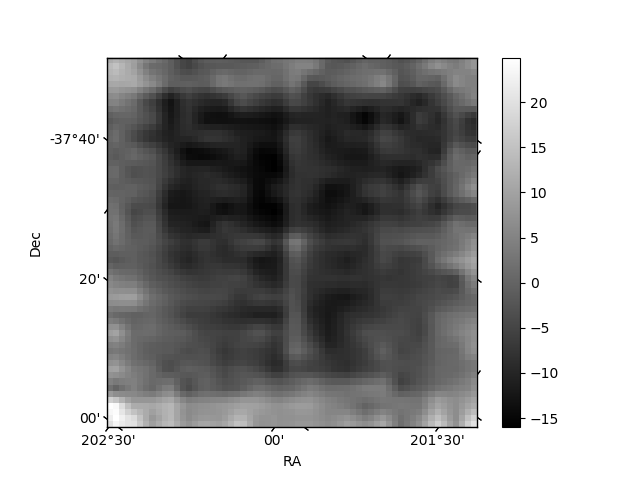
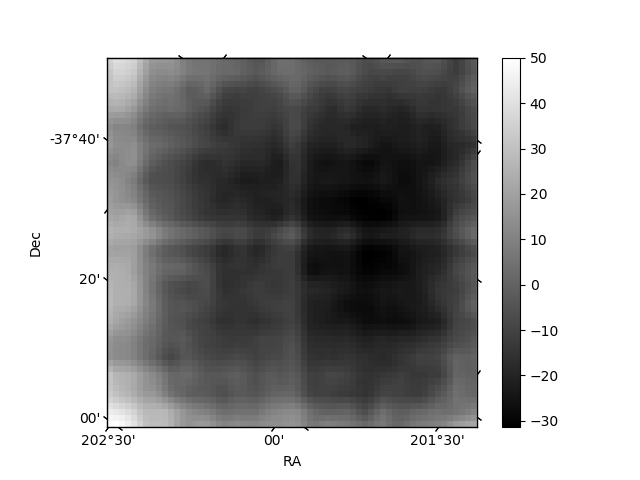
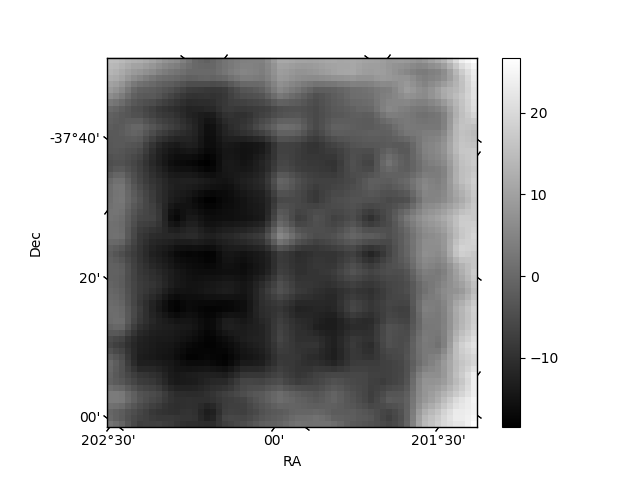
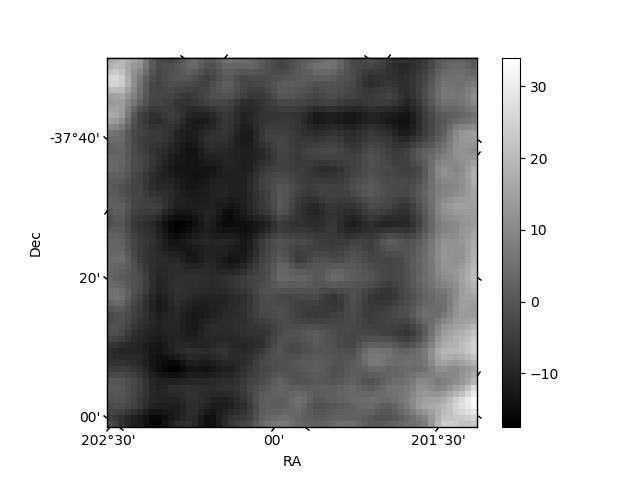
Histogram calculated using DETX and DETY for each event in the final _common_clean file
| Quadrant A | 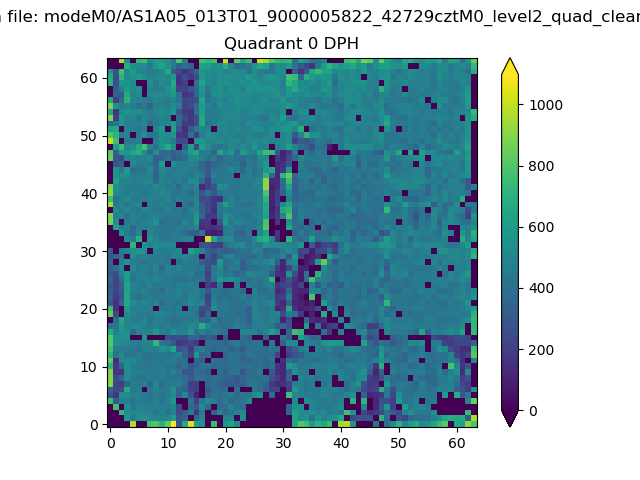 |
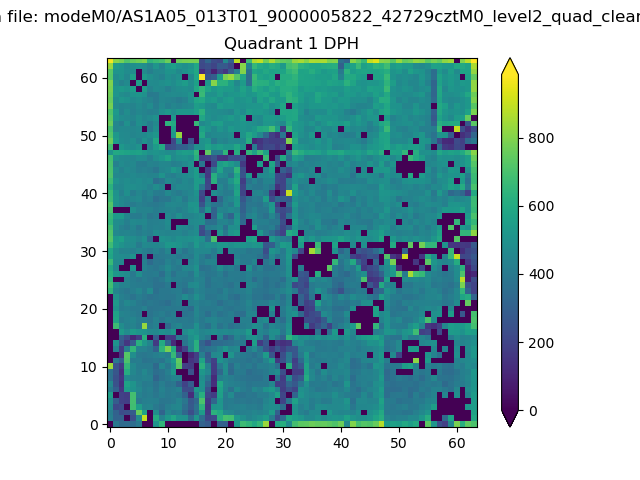 |
Quadrant B |
|---|---|---|---|
| Quadrant D | 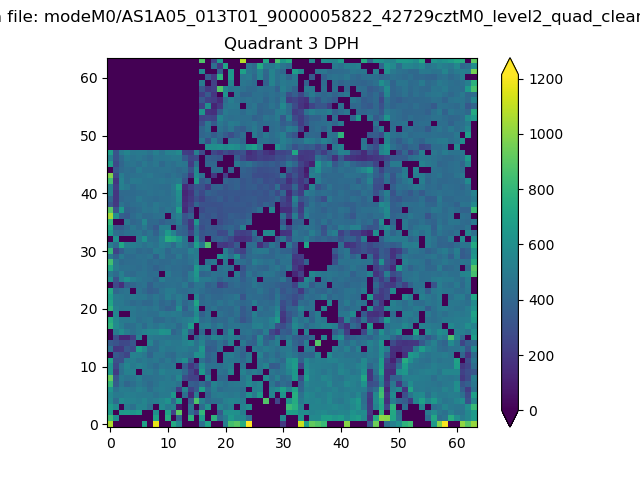 |
 |
Quadrant C |
| Plot type | Count rate plots | Images |
|---|---|---|
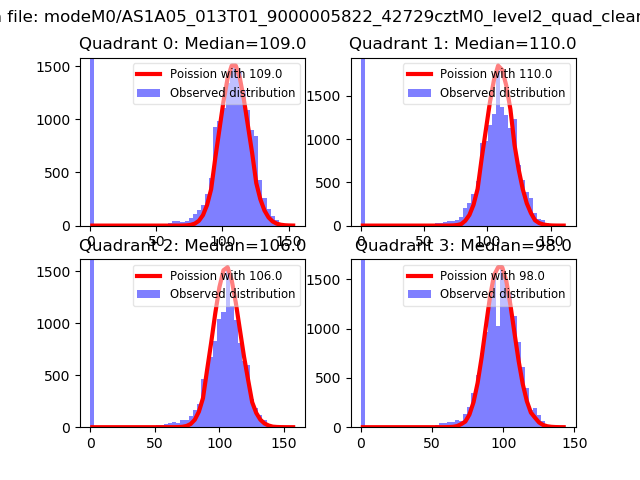
| Comparison with Poisson distribution Blue bars denote a histogram of data divided into 1 sec bins. Red curve is a Poisson curve with rate = median count rate of data. |
 |
 |
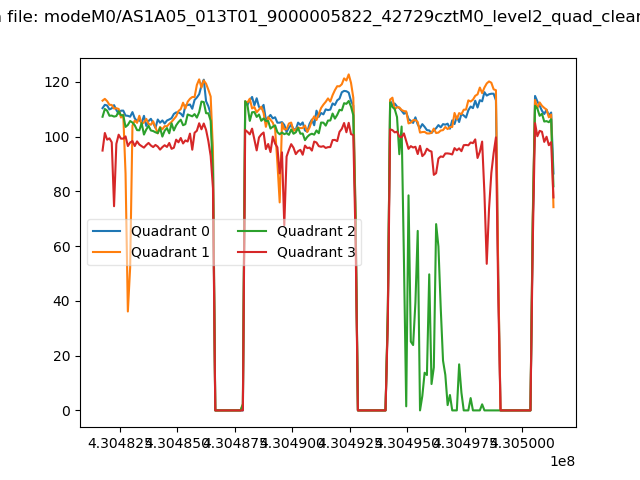
| Quadrant-wise count rates Data is divided into 100 sec bins |
 |
|
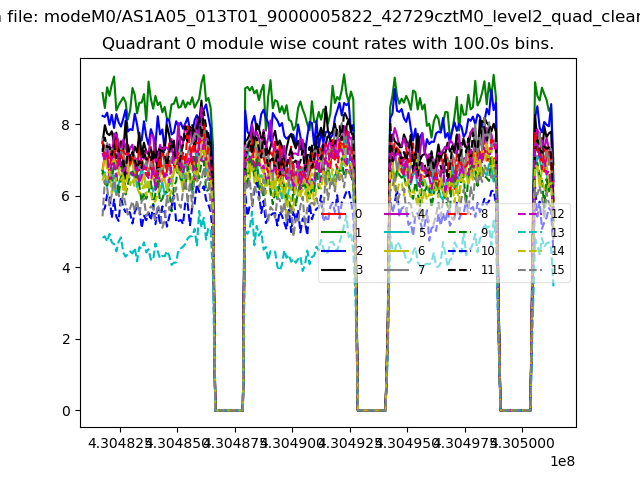
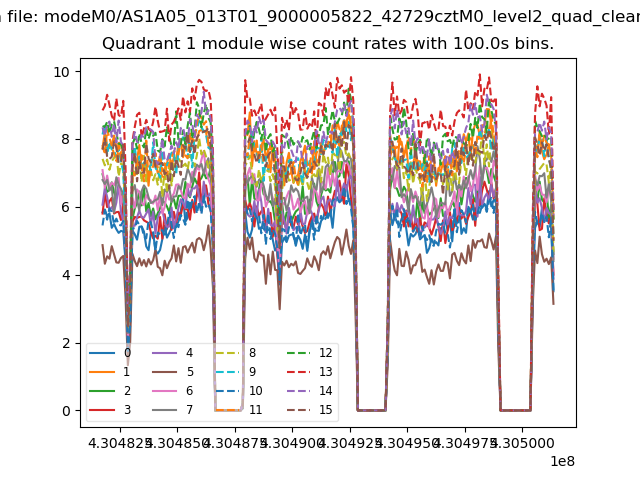
| Module-wise count rates for Quadrant A Data is divided into 100 sec bins |
 |
 |
| Module-wise count rates for Quadrant B Data is divided into 100 sec bins |
 |
 |
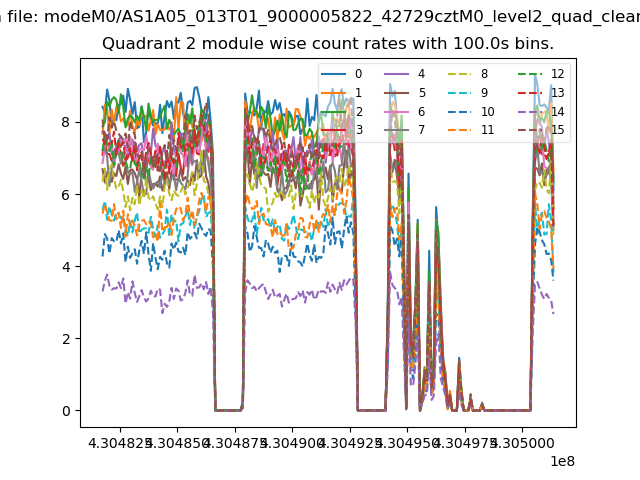
| Module-wise count rates for Quadrant C Data is divided into 100 sec bins |
 |
 |
| Module-wise count rates for Quadrant D Data is divided into 100 sec bins |
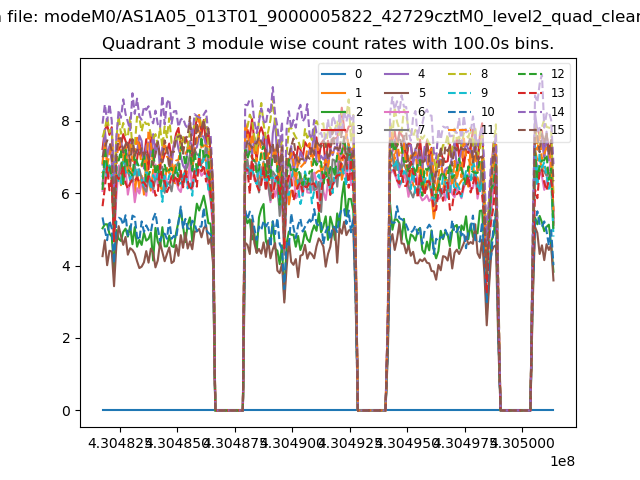 |
 |
| Parameter | Plot |
|---|---|
| CZT HV Monitor | 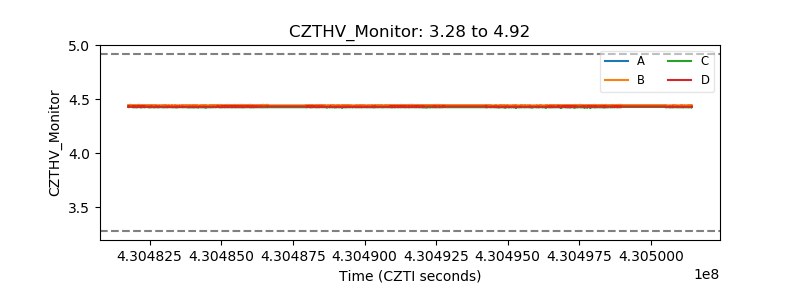 |
| D_VDD | 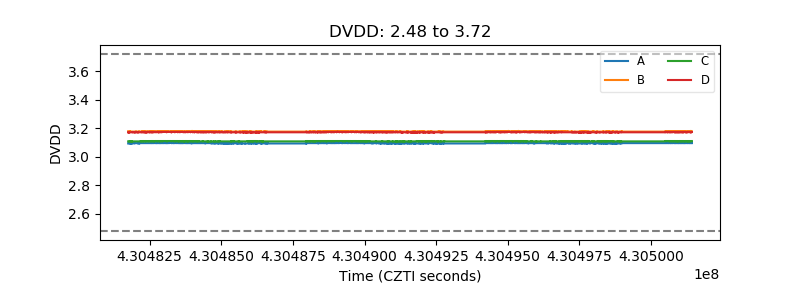 |
| Temperature 1 | 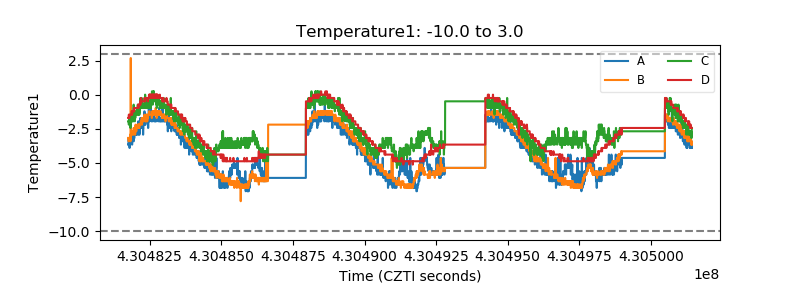 |
| Veto HV Monitor | 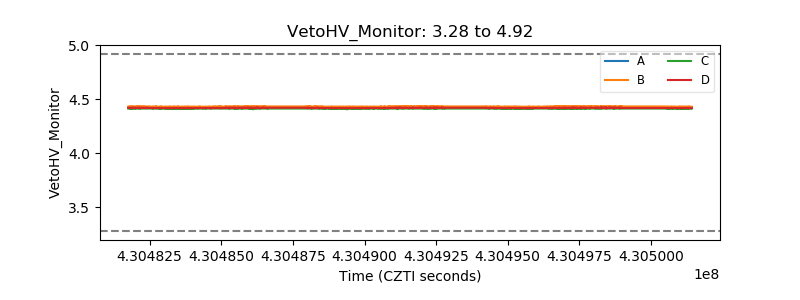 |
| Veto LLD | 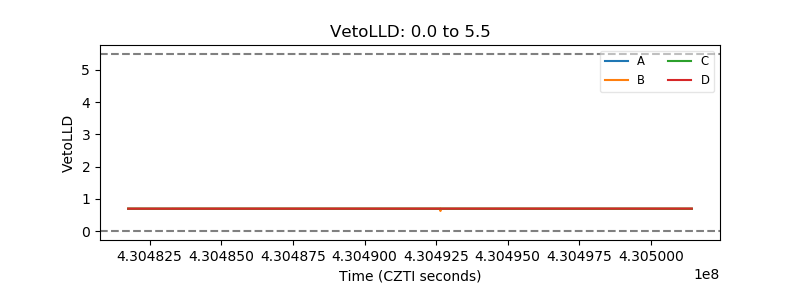 |
| Alpha Counter | 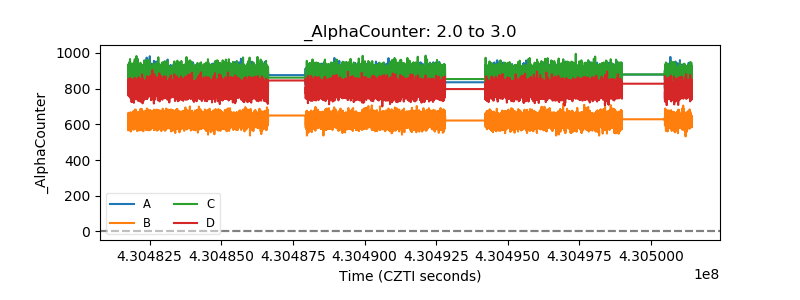 |
| _CPM_Rate | 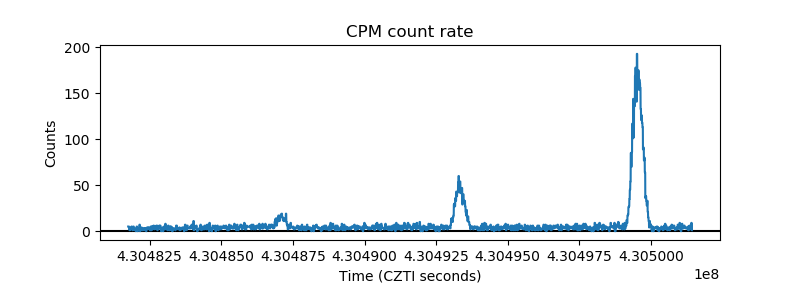 |
| CZT Counter | 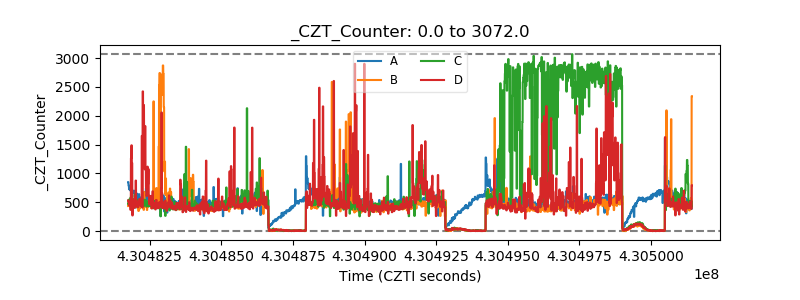 |
| +2.5 Volts monitor | 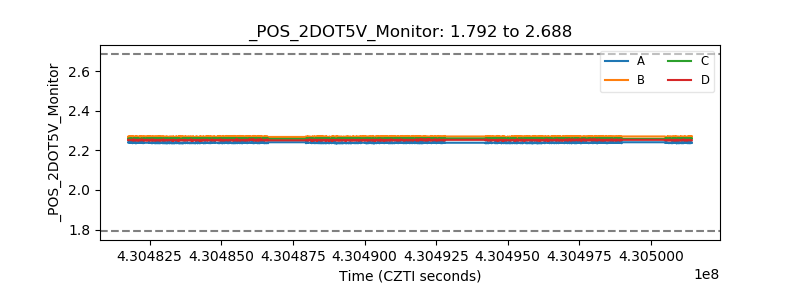 |
| +5 Volts monitor | 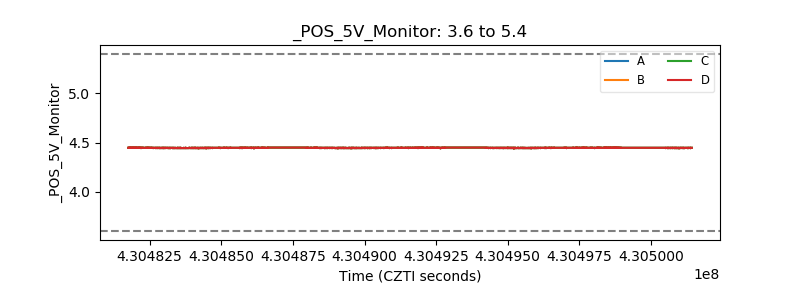 |
| _ROLL_ROT | 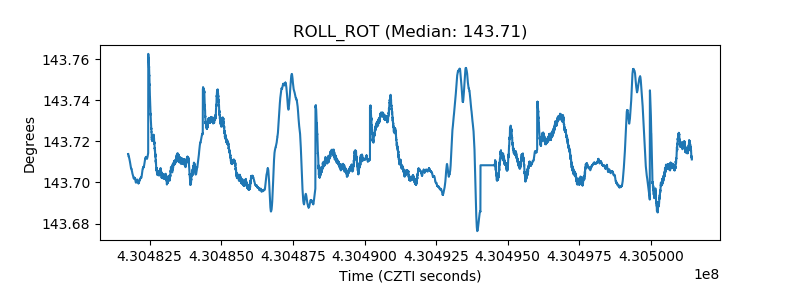 |
| _Roll_DEC | 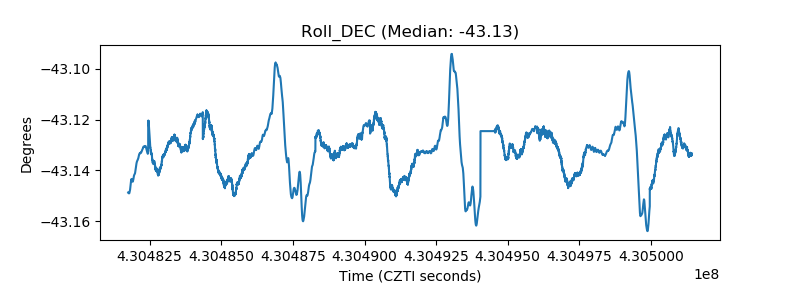 |
| _Roll_RA | 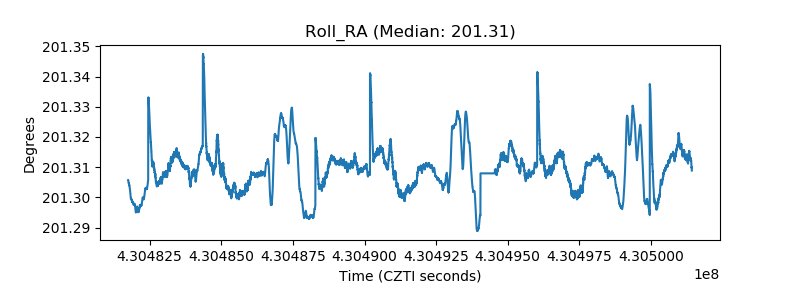 |
| Veto Counter | 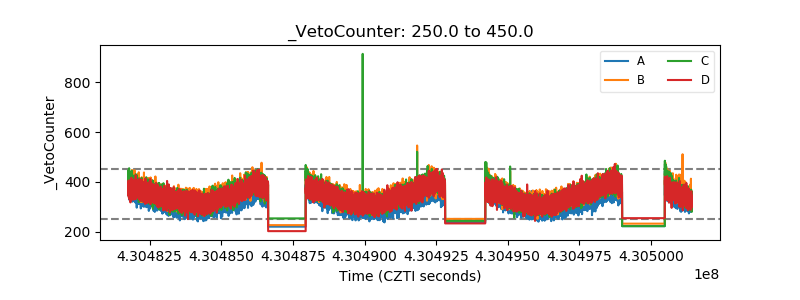 |