| Param | Original file | Final file |
|---|---|---|
| Filename | modeM0/AS1A05_013T01_9000005822_42732cztM0_level2.fits | modeM0/AS1A05_013T01_9000005822_42732cztM0_level2_quad_clean.evt |
| Size (bytes) | 589,337,280 | 76,057,920 |
| Size | 562.0 MB | 72.5 MB |
| Events in quadrant A | 2,899,565 | 601,565 |
| Events in quadrant B | 2,425,295 | 609,831 |
| Events in quadrant C | 7,820,769 | 411,506 |
| Events in quadrant D | 8,252,108 | 303,777 |
| Mode M0 | |||
|---|---|---|---|
| Quadrant | BADHDUFLAG | Total packets | Discarded packets |
| A | 0 | 11768 | 2 |
| B | 0 | 10999 | 2 |
| C | 0 | 26835 | 2 |
| D | 0 | 28274 | 2 |
| Mode M9 | |||
|---|---|---|---|
| Quadrant | BADHDUFLAG | Total packets | Discarded packets |
| A | 0 | 18 | 0 |
| B | 0 | 19 | 0 |
| C | 0 | 19 | 0 |
| D | 0 | 19 | 0 |
| Mode SS | |||
|---|---|---|---|
| Quadrant | BADHDUFLAG | Total packets | Discarded packets |
| A | 0 | 110 | 0 |
| B | 0 | 110 | 0 |
| C | 0 | 110 | 0 |
| D | 0 | 110 | 0 |
| Quadrant | Total seconds | Saturated seconds | Saturation percentage |
|---|---|---|---|
| A | 5370 | 11 | 0.204842% |
| B | 5370 | 16 | 0.297952% |
| C | 5369 | 1740 | 32.408270% |
| D | 5369 | 2492 | 46.414602% |
Noise dominated data is calculated using 1-second bins in cleaned event files. If a bin has >2000 counts, and if more than 50% of those come from <1% of pixels, then it is considered to be noise-dominated and hence unusable.
| Quadrant | # 1 sec bins | Bins with >0 counts | Bins with >2000 counts | High rate bins dominated by noise | Noise dominated (total time) | Noise dominated (detector-on time) | Marked lightcurve |
|---|---|---|---|---|---|---|---|
| A | 7133 | 5371 | 7 | 7 | 0.10% | 0.13% | 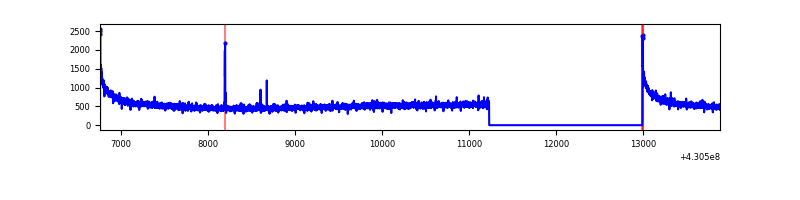 |
| B | 7133 | 5371 | 9 | 9 | 0.13% | 0.17% | 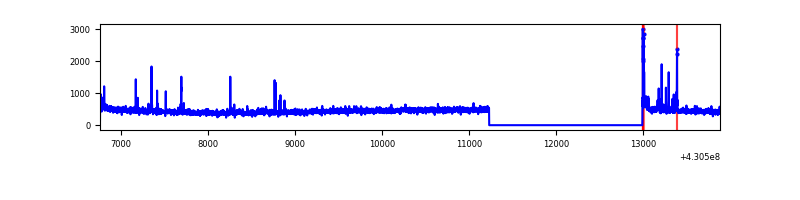 |
| C | 7132 | 5370 | 1754 | 1754 | 24.59% | 32.66% | 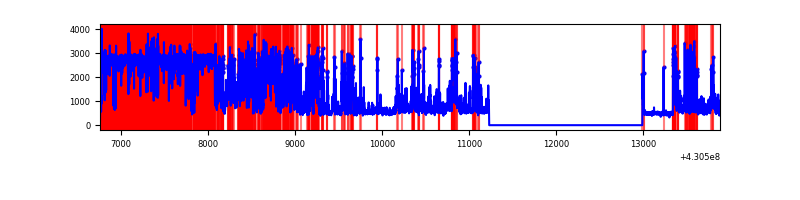 |
| D | 7131 | 5368 | 2357 | 2357 | 33.05% | 43.91% | 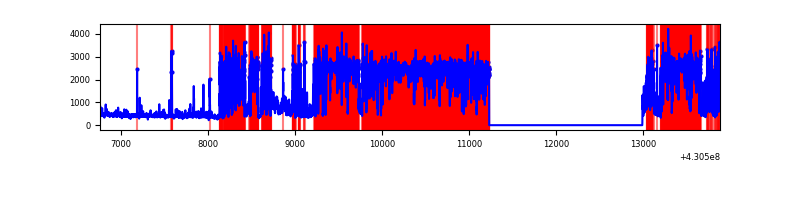 |
Top three noisy pixels from each quadrant. If the there are fewer than three noisy pixels in the level2.evt file, extra rows are filled as -1
| Pixel properties | Quadrant properties | ||||||
|---|---|---|---|---|---|---|---|
| Quadrant | DetID | PixID | Counts | Sigma | Mean | Median | Sigma |
| A | 10 | 83 | 582344 | 4757.71 | 591 | 580 | 122.3 |
| A | 13 | 6 | 11597 | 90.1 | 591 | 580 | 122.3 |
| A | 13 | 248 | 11589 | 90.03 | 591 | 580 | 122.3 |
| B | 5 | 172 | 37086 | 323.54 | 586 | 571 | 112.9 |
| B | 0 | 230 | 19064 | 163.86 | 586 | 571 | 112.9 |
| B | 0 | 229 | 18044 | 154.82 | 586 | 571 | 112.9 |
| C | 8 | 79 | 5735900 | 50959.42 | 481 | 485 | 112.5 |
| C | 15 | 214 | 188289 | 1668.65 | 481 | 485 | 112.5 |
| C | 3 | 233 | 16629 | 143.44 | 481 | 485 | 112.5 |
| D | 2 | 249 | 6446486 | 61046.68 | 427 | 416 | 105.6 |
| D | 1 | 52 | 38464 | 360.33 | 427 | 416 | 105.6 |
| D | 7 | 96 | 31734 | 296.59 | 427 | 416 | 105.6 |
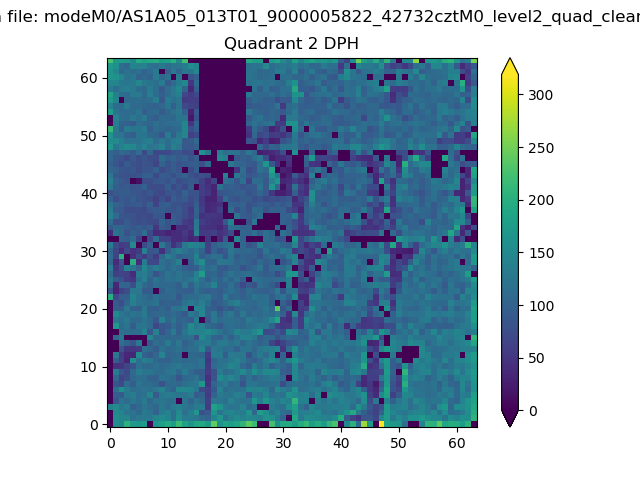
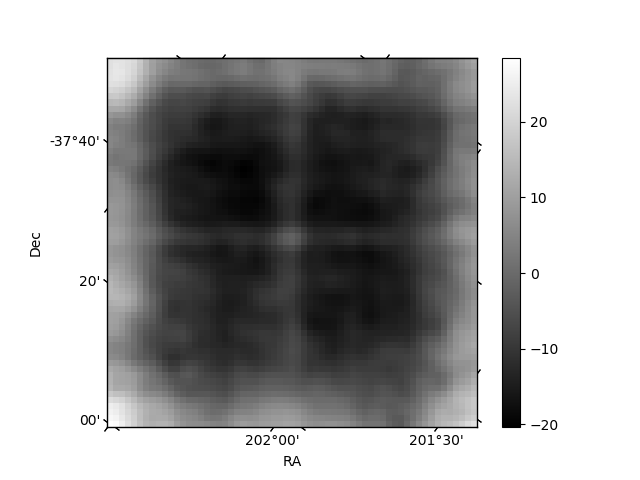
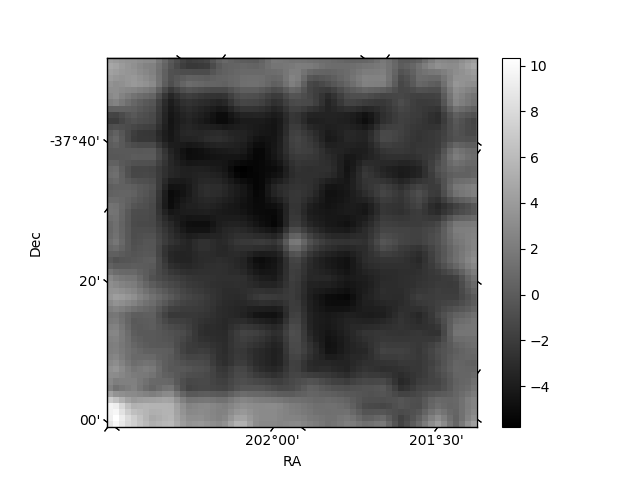
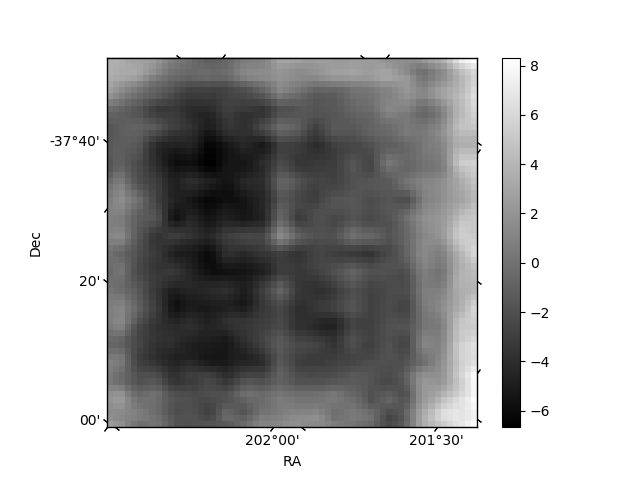
Histogram calculated using DETX and DETY for each event in the final _common_clean file
| Quadrant A | 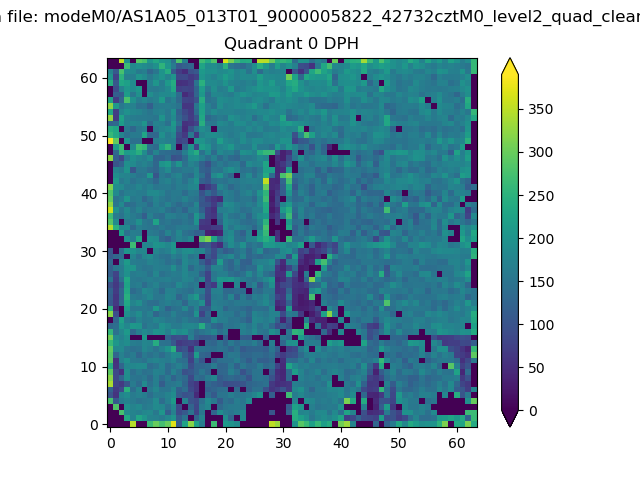 |
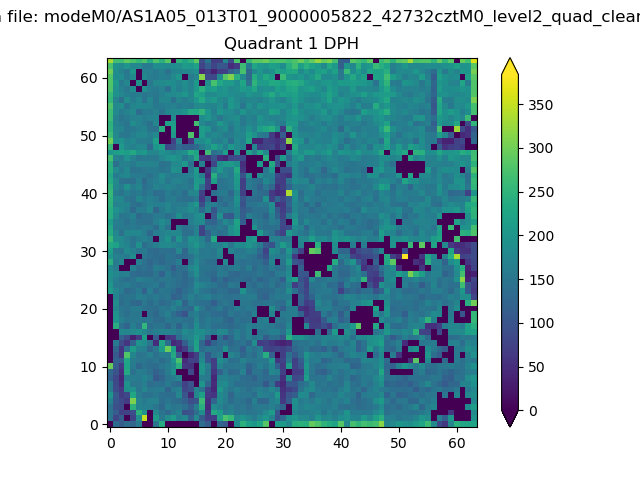 |
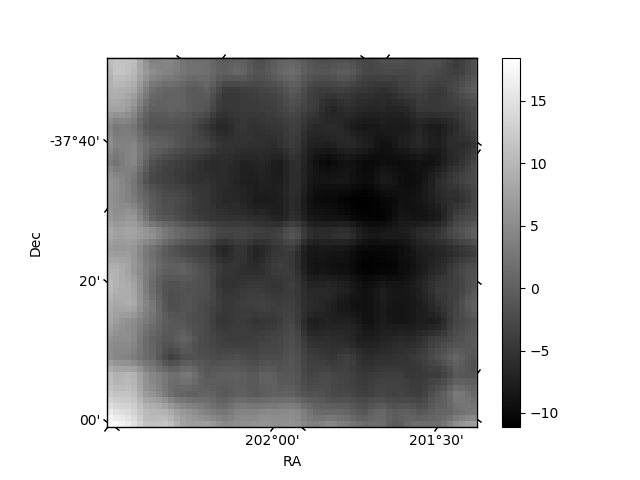
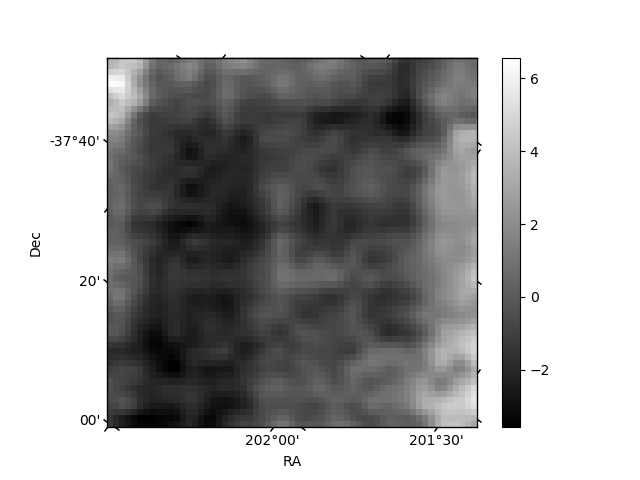
Quadrant B |
|---|---|---|---|
| Quadrant D | 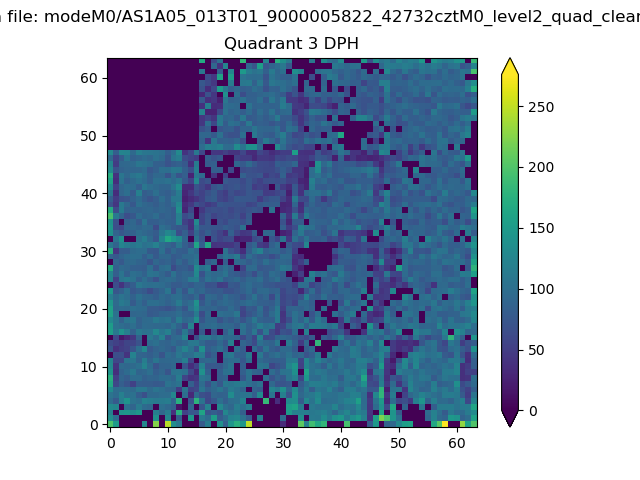 |
 |
Quadrant C |
| Plot type | Count rate plots | Images |
|---|---|---|
| Comparison with Poisson distribution Blue bars denote a histogram of data divided into 1 sec bins. Red curve is a Poisson curve with rate = median count rate of data. |
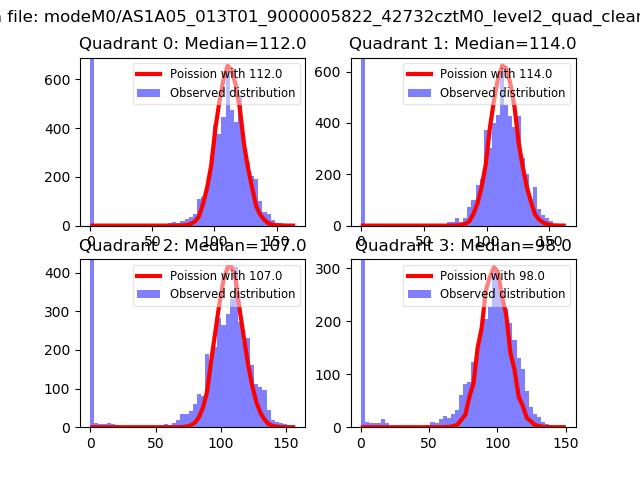 |
 |
| Quadrant-wise count rates Data is divided into 100 sec bins |
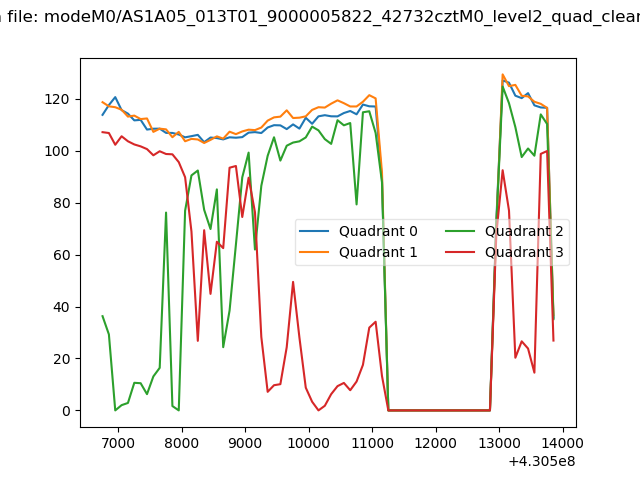 |
|
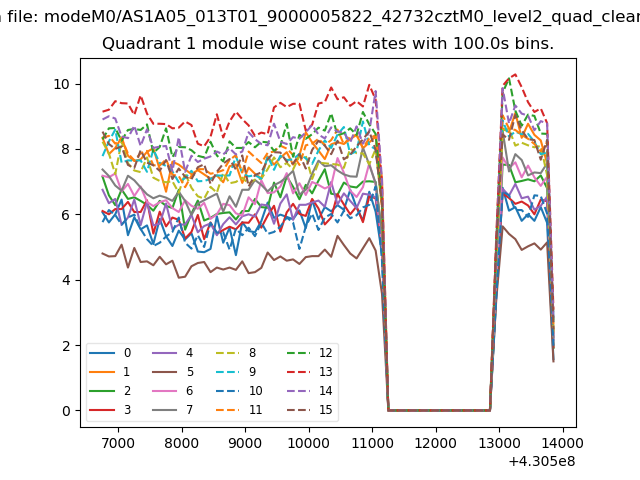
| Module-wise count rates for Quadrant A Data is divided into 100 sec bins |
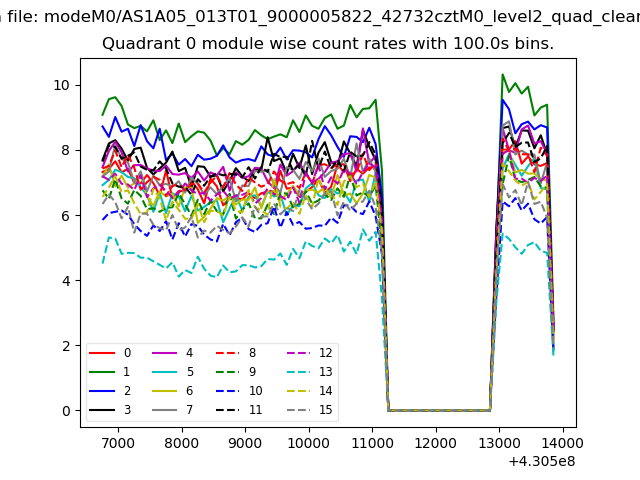 |
 |
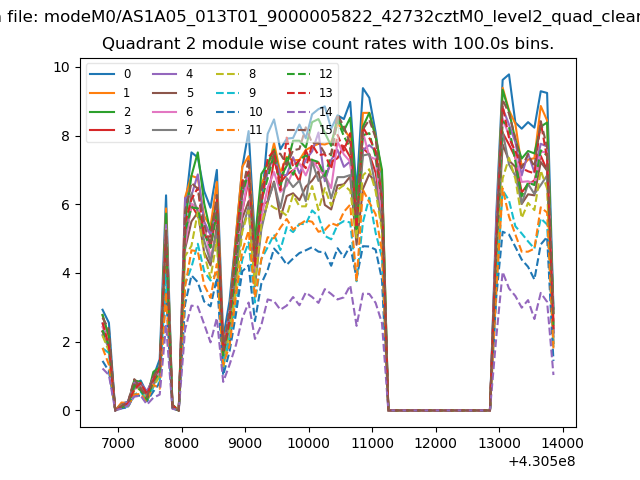
| Module-wise count rates for Quadrant B Data is divided into 100 sec bins |
 |
 |
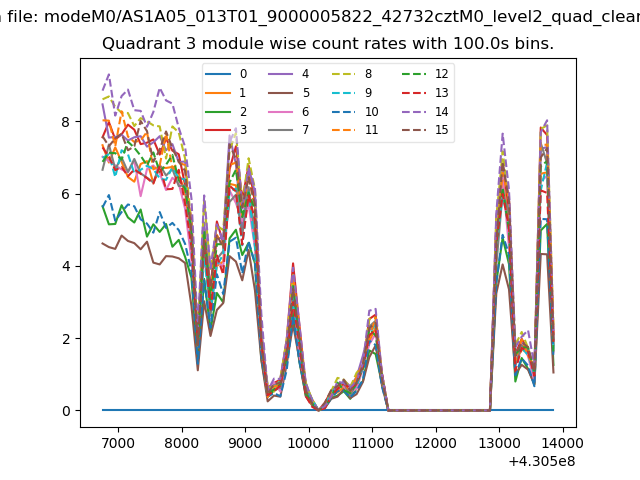
| Module-wise count rates for Quadrant C Data is divided into 100 sec bins |
 |
 |
| Module-wise count rates for Quadrant D Data is divided into 100 sec bins |
 |
 |
| Parameter | Plot |
|---|---|
| CZT HV Monitor | 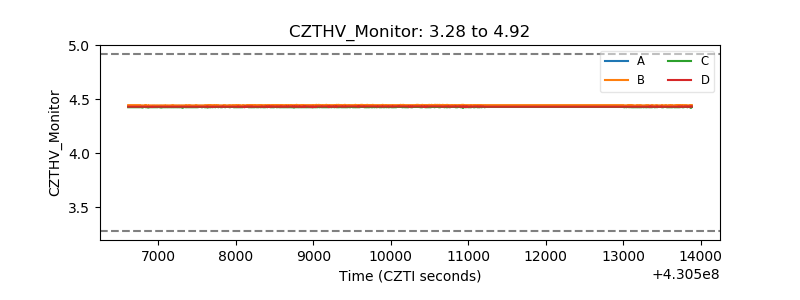 |
| D_VDD | 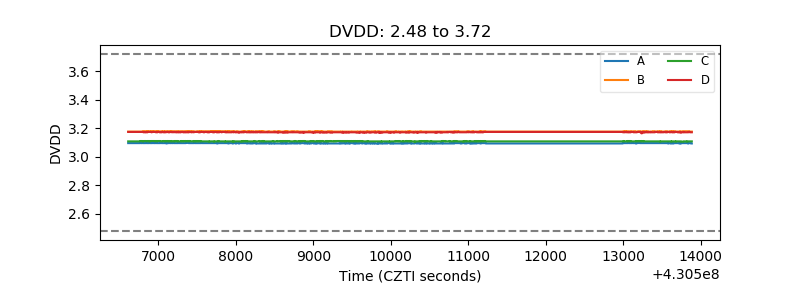 |
| Temperature 1 | 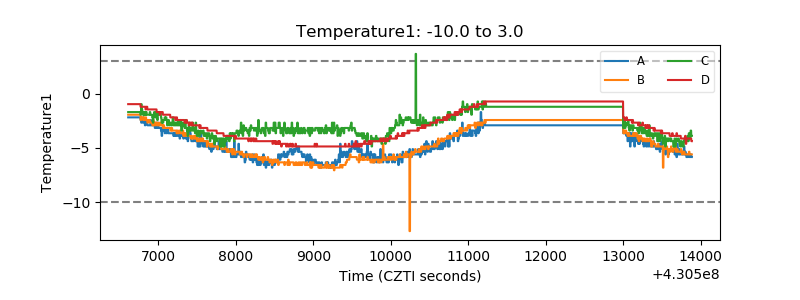 |
| Veto HV Monitor | 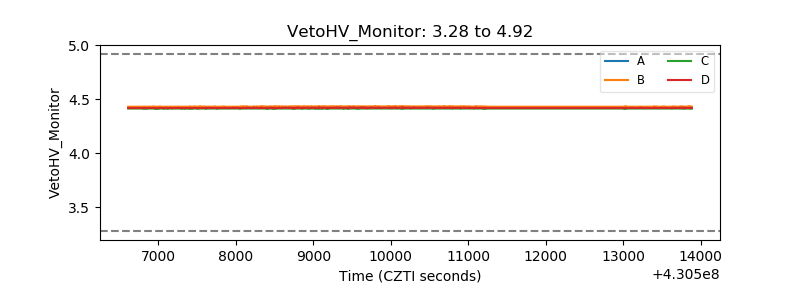 |
| Veto LLD | 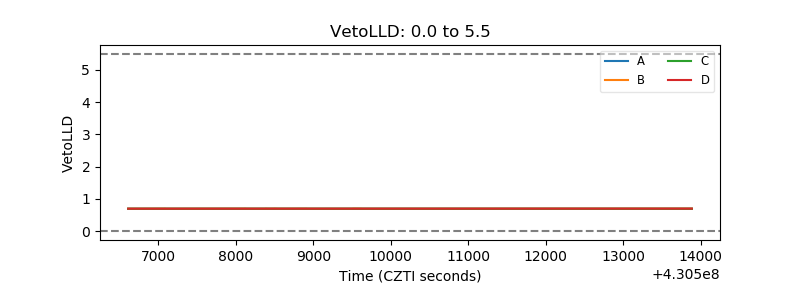 |
| Alpha Counter | 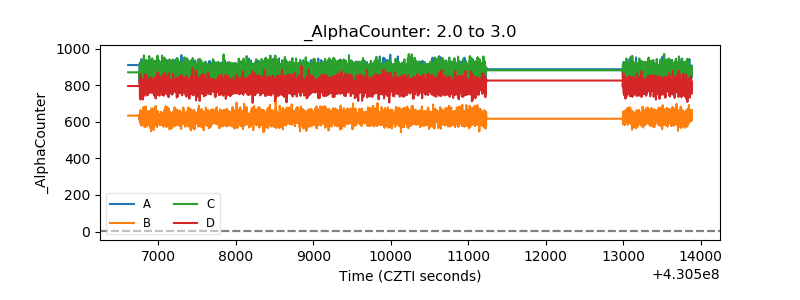 |
| _CPM_Rate | 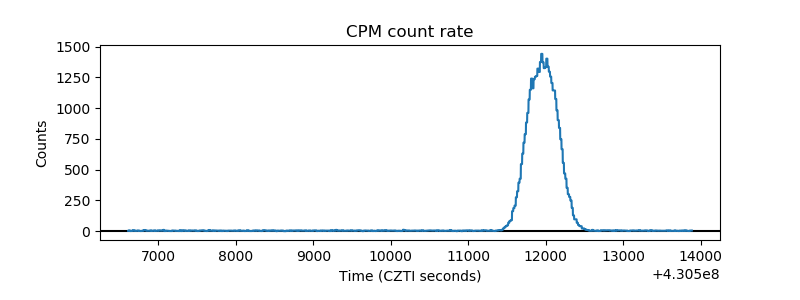 |
| CZT Counter | 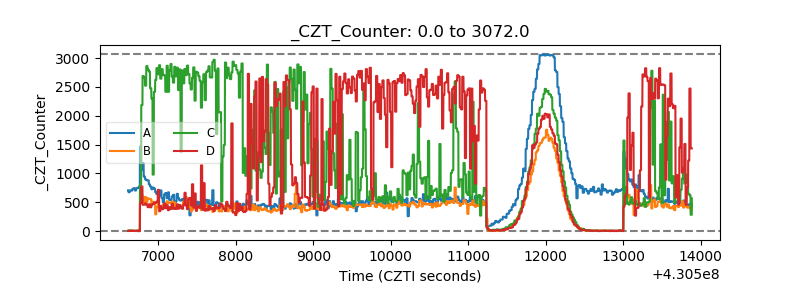 |
| +2.5 Volts monitor | 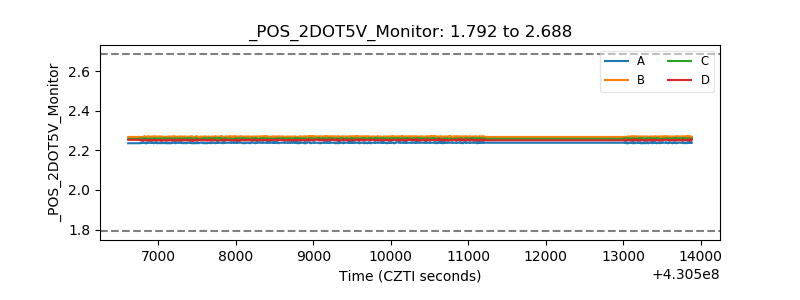 |
| +5 Volts monitor | 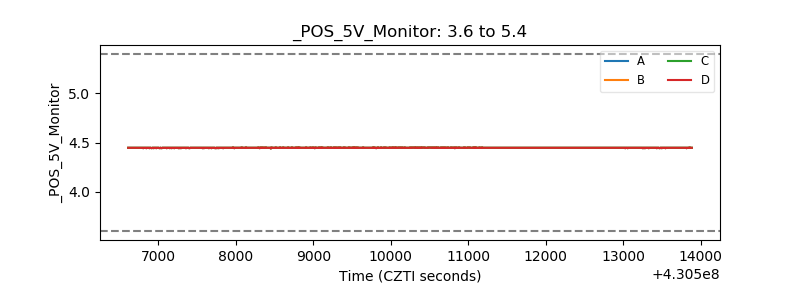 |
| _ROLL_ROT | 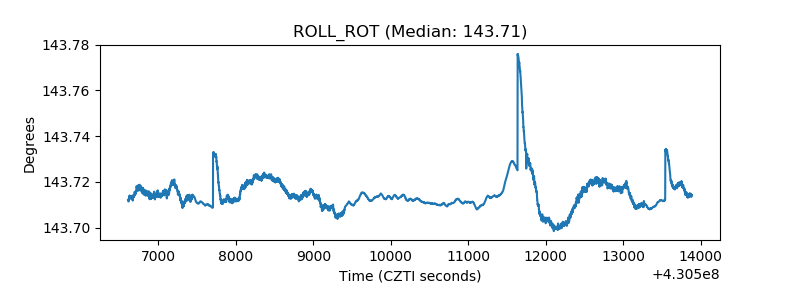 |
| _Roll_DEC | 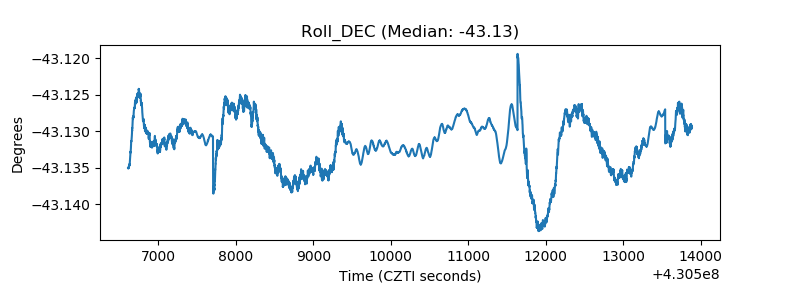 |
| _Roll_RA | 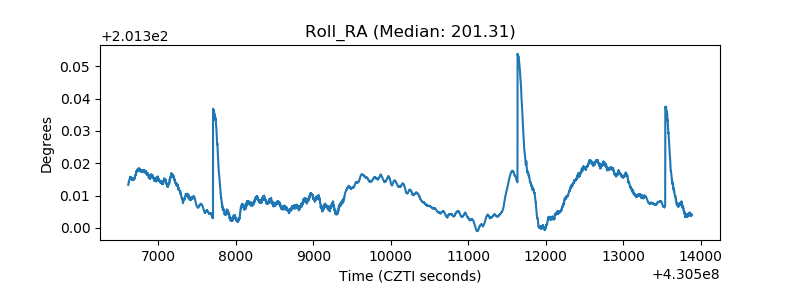 |
| Veto Counter | 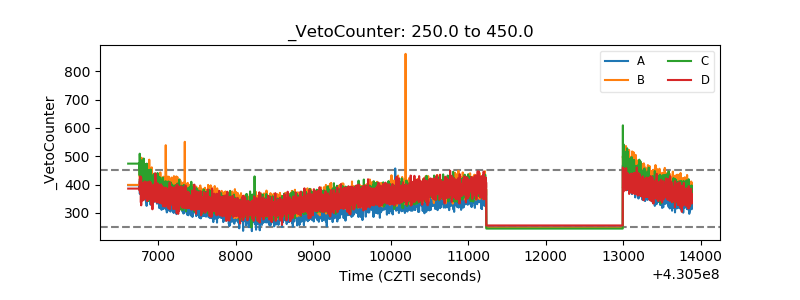 |