| Param | Original file | Final file |
|---|---|---|
| Filename | modeM0/AS1A05_013T01_9000005822_42733cztM0_level2.fits | modeM0/AS1A05_013T01_9000005822_42733cztM0_level2_quad_clean.evt |
| Size (bytes) | 424,353,600 | 85,020,480 |
| Size | 404.7 MB | 81.1 MB |
| Events in quadrant A | 2,871,618 | 615,903 |
| Events in quadrant B | 2,410,477 | 627,647 |
| Events in quadrant C | 6,315,408 | 468,368 |
| Events in quadrant D | 3,701,536 | 494,290 |
| Mode M0 | |||
|---|---|---|---|
| Quadrant | BADHDUFLAG | Total packets | Discarded packets |
| A | 0 | 11581 | 2 |
| B | 0 | 10752 | 2 |
| C | 0 | 22137 | 2 |
| D | 0 | 14772 | 2 |
| Mode M9 | |||
|---|---|---|---|
| Quadrant | BADHDUFLAG | Total packets | Discarded packets |
| A | 0 | 28 | 0 |
| B | 0 | 29 | 0 |
| C | 0 | 29 | 0 |
| D | 0 | 29 | 0 |
| Mode SS | |||
|---|---|---|---|
| Quadrant | BADHDUFLAG | Total packets | Discarded packets |
| A | 0 | 108 | 0 |
| B | 0 | 108 | 0 |
| C | 0 | 108 | 0 |
| D | 0 | 108 | 0 |
| Quadrant | Total seconds | Saturated seconds | Saturation percentage |
|---|---|---|---|
| A | 5255 | 9 | 0.171265% |
| B | 5255 | 14 | 0.266413% |
| C | 5254 | 1256 | 23.905596% |
| D | 5254 | 521 | 9.916254% |
Noise dominated data is calculated using 1-second bins in cleaned event files. If a bin has >2000 counts, and if more than 50% of those come from <1% of pixels, then it is considered to be noise-dominated and hence unusable.
| Quadrant | # 1 sec bins | Bins with >0 counts | Bins with >2000 counts | High rate bins dominated by noise | Noise dominated (total time) | Noise dominated (detector-on time) | Marked lightcurve |
|---|---|---|---|---|---|---|---|
| A | 7138 | 5256 | 6 | 6 | 0.08% | 0.11% | 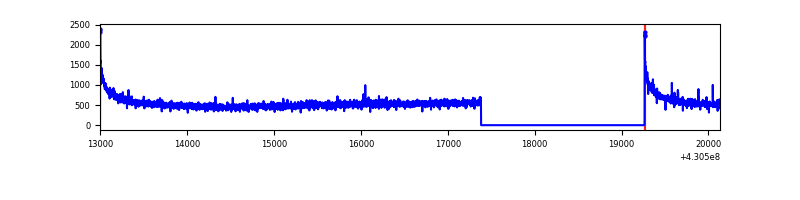 |
| B | 7138 | 5256 | 10 | 10 | 0.14% | 0.19% | 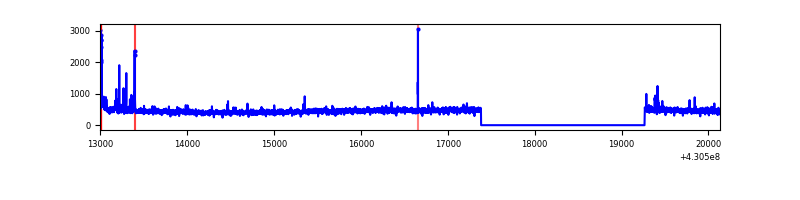 |
| C | 7137 | 5255 | 1227 | 1227 | 17.19% | 23.35% | 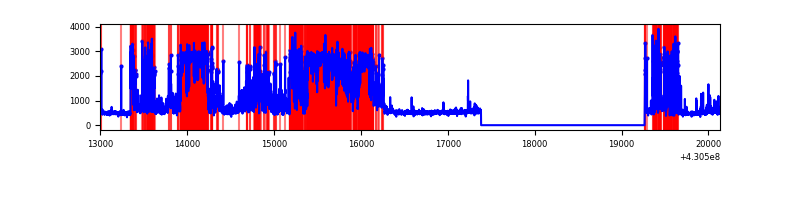 |
| D | 7137 | 5255 | 515 | 515 | 7.22% | 9.80% | 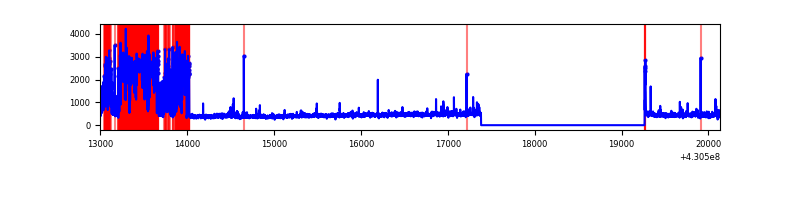 |
Top three noisy pixels from each quadrant. If the there are fewer than three noisy pixels in the level2.evt file, extra rows are filled as -1
| Pixel properties | Quadrant properties | ||||||
|---|---|---|---|---|---|---|---|
| Quadrant | DetID | PixID | Counts | Sigma | Mean | Median | Sigma |
| A | 10 | 83 | 555327 | 4567.1 | 594 | 583 | 121.5 |
| A | 13 | 248 | 8035 | 61.35 | 594 | 583 | 121.5 |
| A | 13 | 254 | 7639 | 58.09 | 594 | 583 | 121.5 |
| B | 5 | 172 | 31761 | 273.41 | 590 | 574 | 114.1 |
| B | 5 | 255 | 19467 | 165.63 | 590 | 574 | 114.1 |
| B | 12 | 111 | 14320 | 120.51 | 590 | 574 | 114.1 |
| C | 8 | 79 | 3759132 | 31656.81 | 507 | 509 | 118.7 |
| C | 0 | 239 | 371332 | 3123.24 | 507 | 509 | 118.7 |
| C | 15 | 214 | 194146 | 1630.9 | 507 | 509 | 118.7 |
| D | 2 | 249 | 1445690 | 10821.67 | 546 | 530 | 133.5 |
| D | 1 | 52 | 34436 | 253.9 | 546 | 530 | 133.5 |
| D | 5 | 70 | 26949 | 197.83 | 546 | 530 | 133.5 |
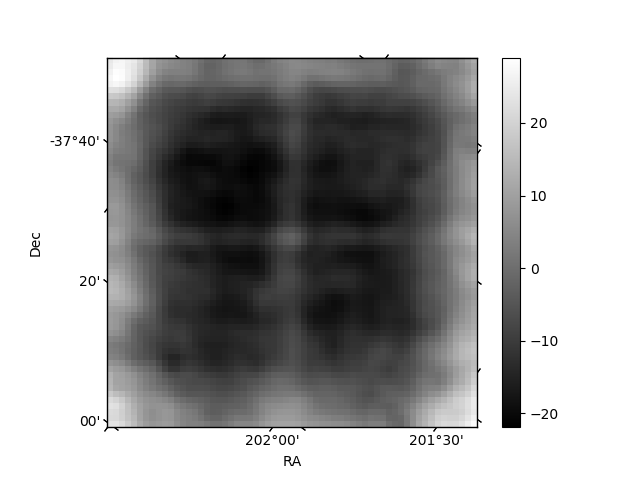
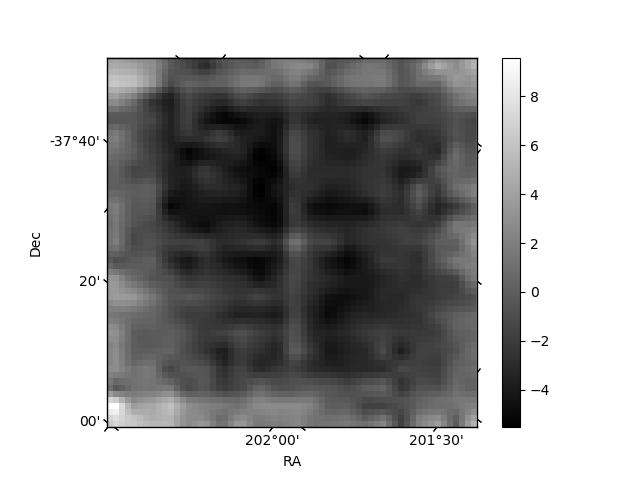
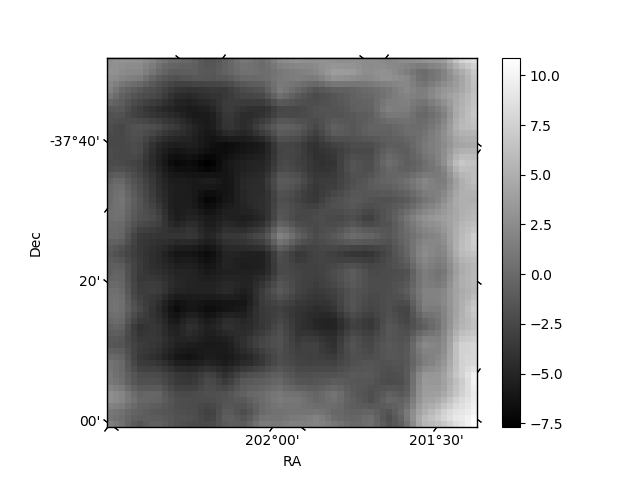
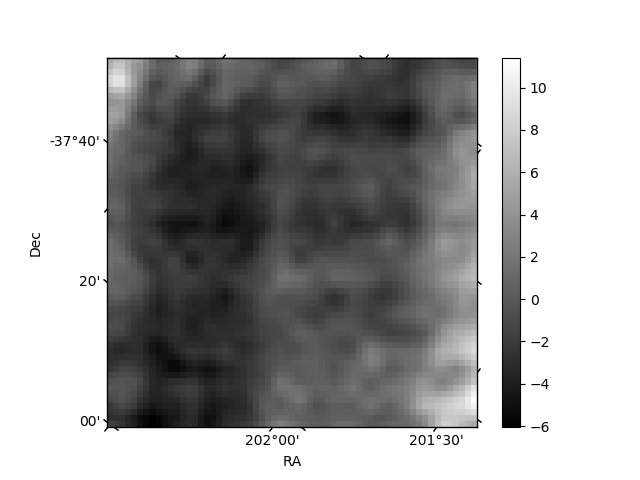
Histogram calculated using DETX and DETY for each event in the final _common_clean file
| Quadrant A | 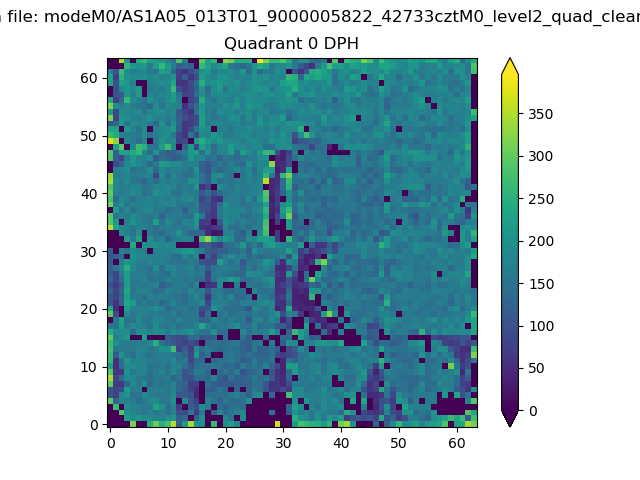 |
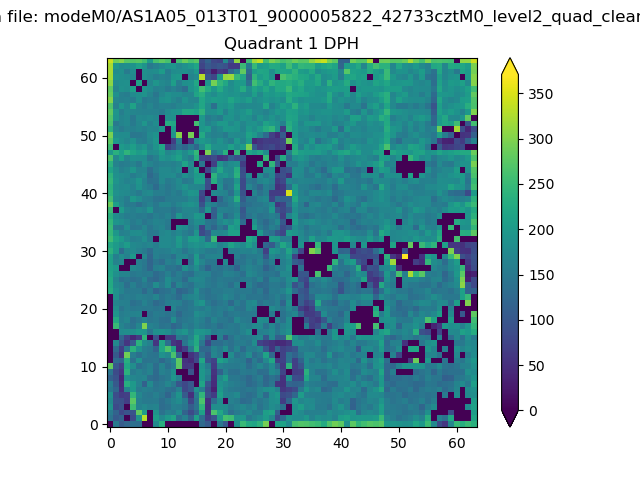 |
Quadrant B |
|---|---|---|---|
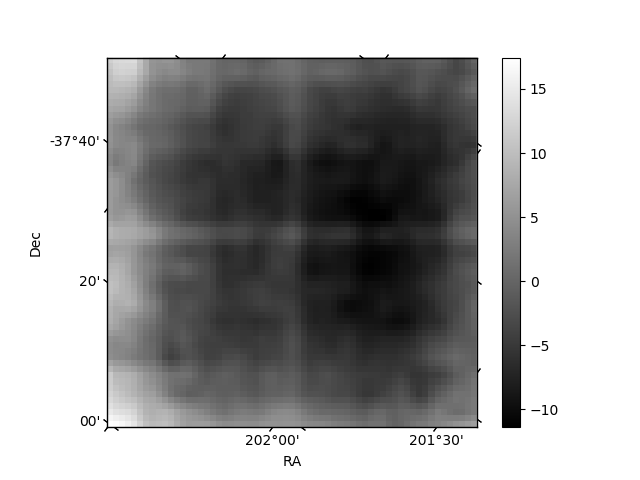
| Quadrant D | 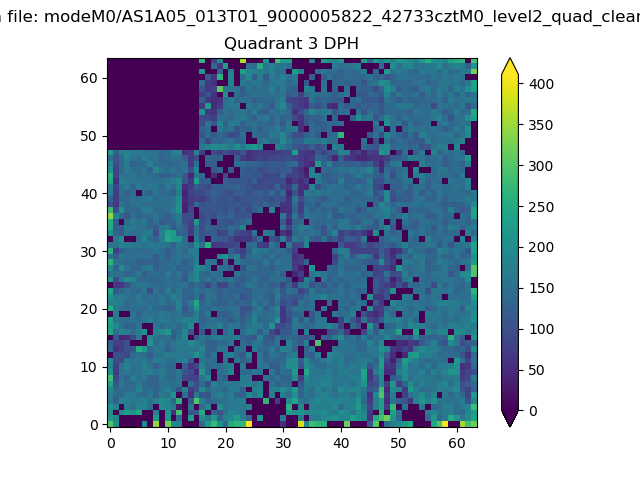 |
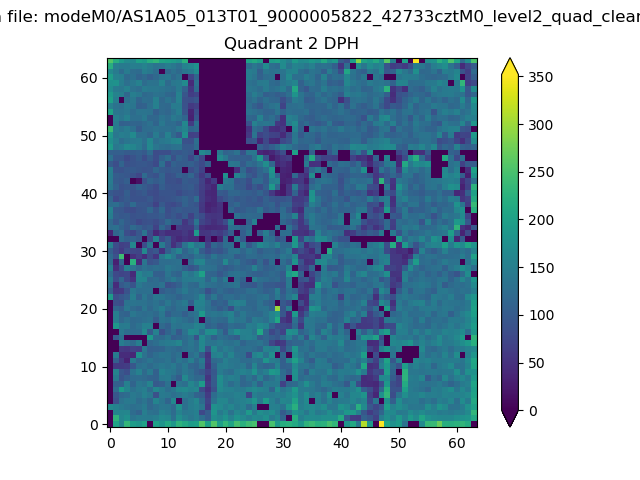 |
Quadrant C |
| Plot type | Count rate plots | Images |
|---|---|---|
| Comparison with Poisson distribution Blue bars denote a histogram of data divided into 1 sec bins. Red curve is a Poisson curve with rate = median count rate of data. |
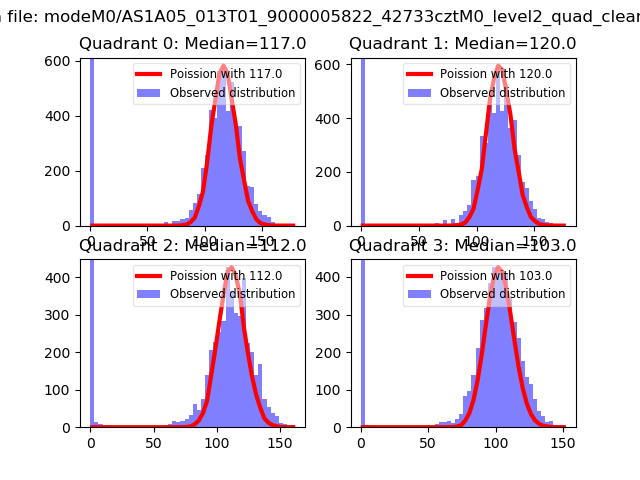 |
 |
| Quadrant-wise count rates Data is divided into 100 sec bins |
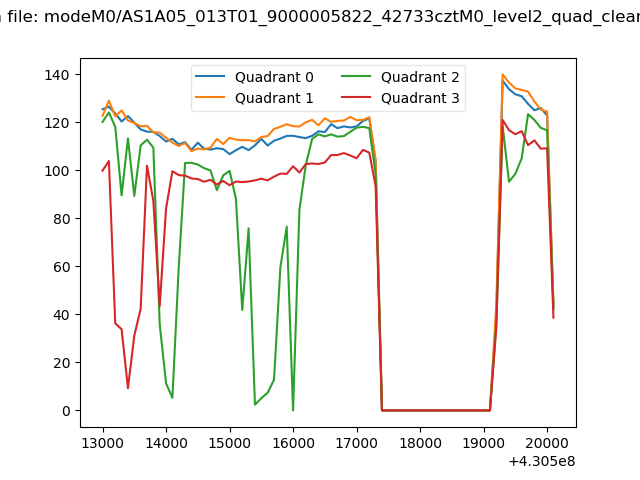 |
|
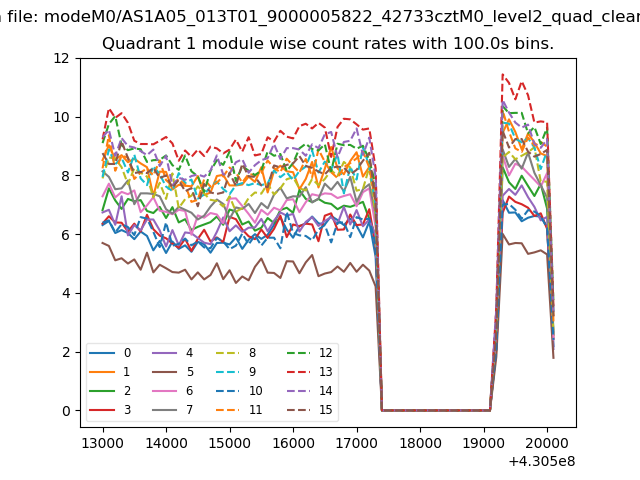
| Module-wise count rates for Quadrant A Data is divided into 100 sec bins |
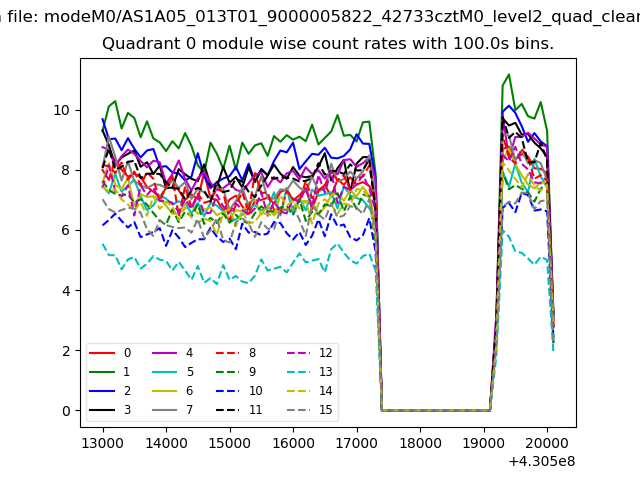 |
 |
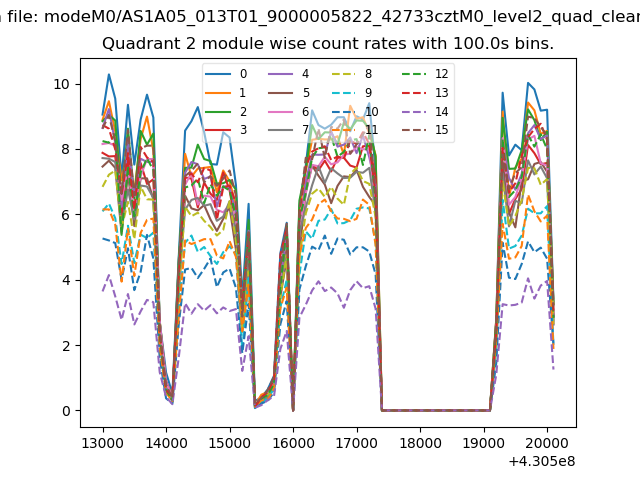
| Module-wise count rates for Quadrant B Data is divided into 100 sec bins |
 |
 |
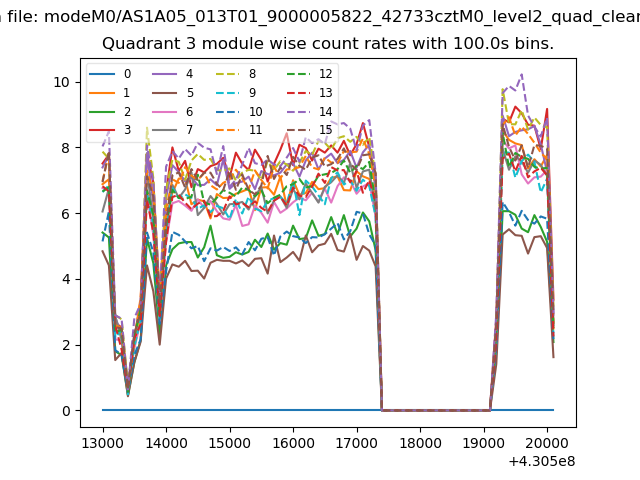
| Module-wise count rates for Quadrant C Data is divided into 100 sec bins |
 |
 |
| Module-wise count rates for Quadrant D Data is divided into 100 sec bins |
 |
 |
| Parameter | Plot |
|---|---|
| CZT HV Monitor | 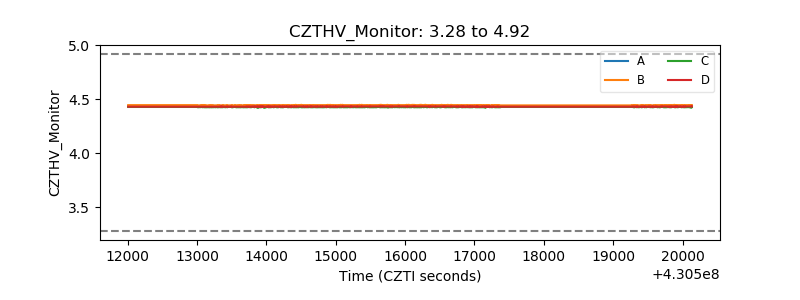 |
| D_VDD | 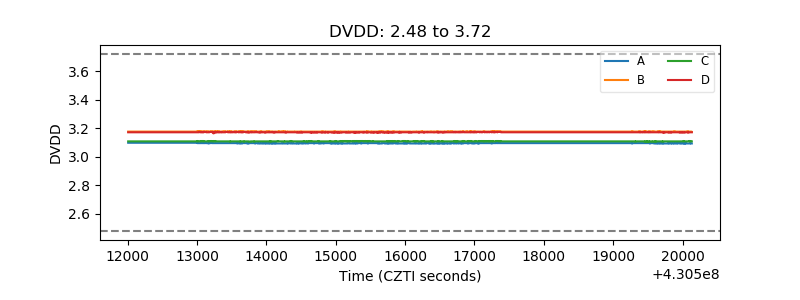 |
| Temperature 1 | 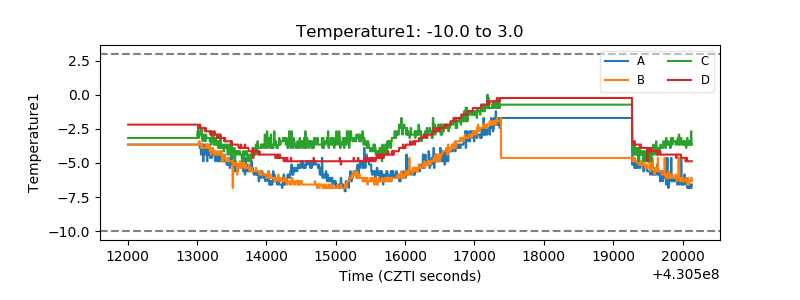 |
| Veto HV Monitor | 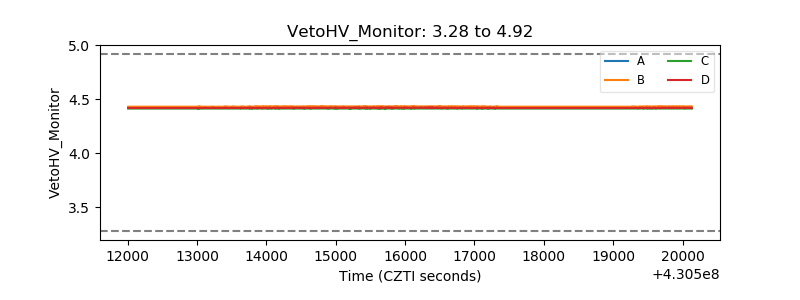 |
| Veto LLD | 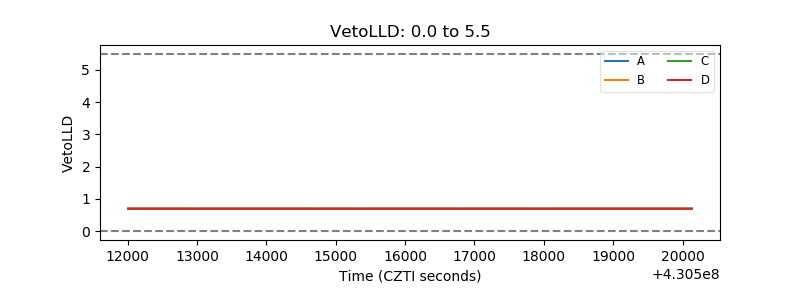 |
| Alpha Counter | 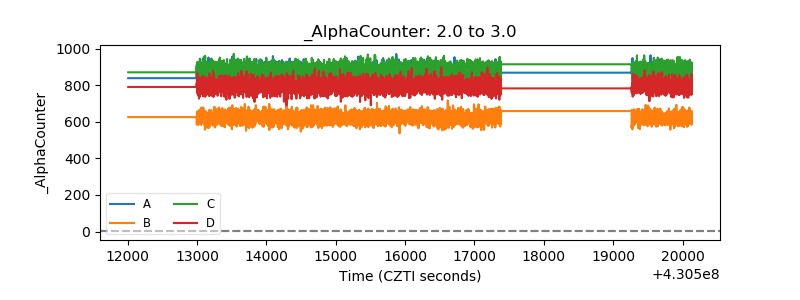 |
| _CPM_Rate | 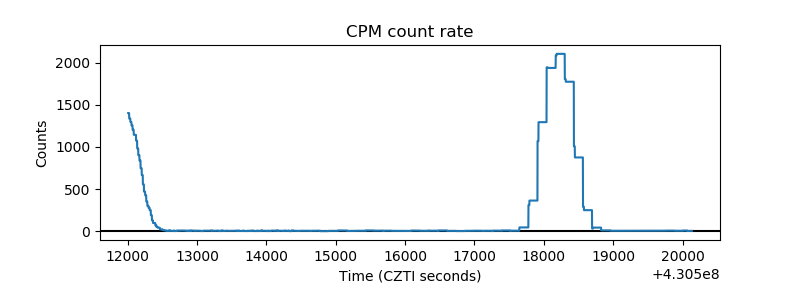 |
| CZT Counter | 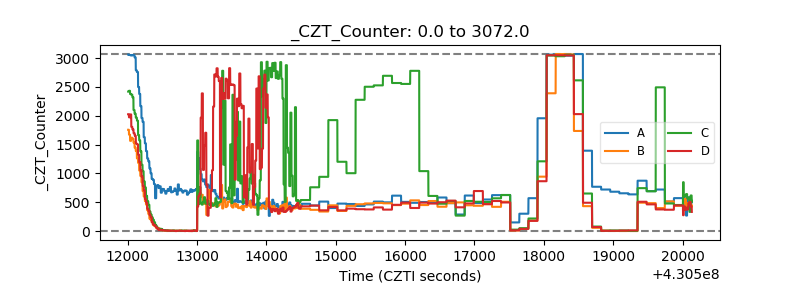 |
| +2.5 Volts monitor | 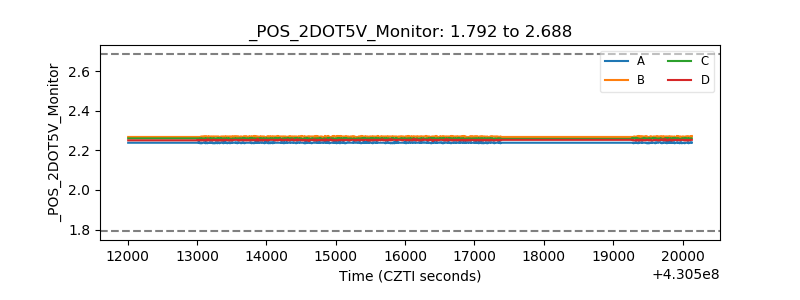 |
| +5 Volts monitor | 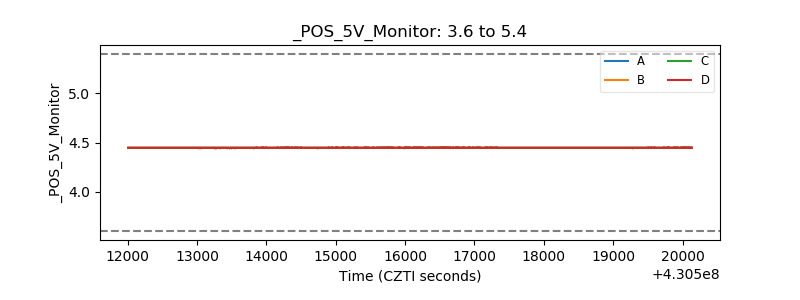 |
| _ROLL_ROT | 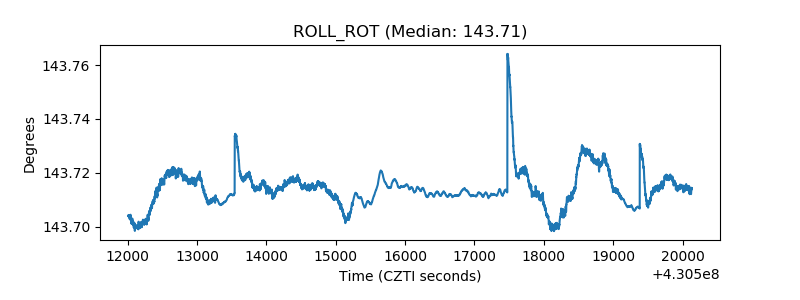 |
| _Roll_DEC | 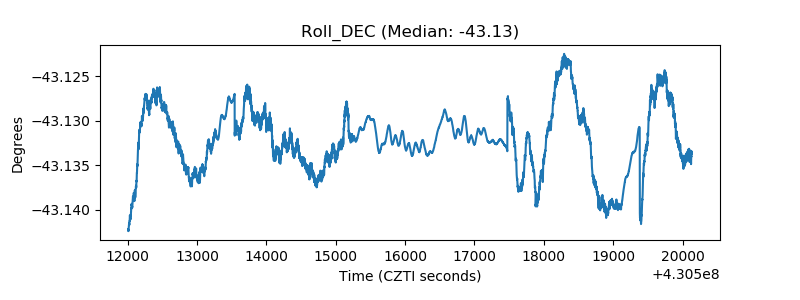 |
| _Roll_RA | 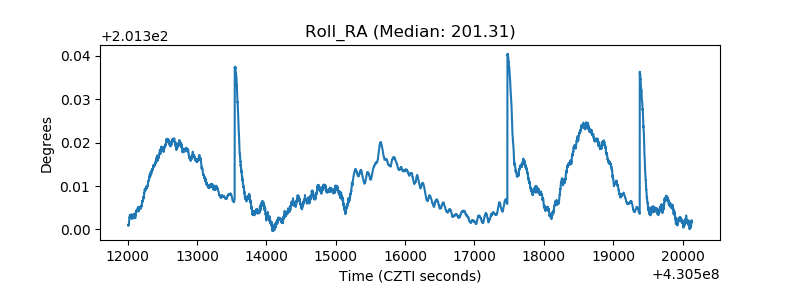 |
| Veto Counter | 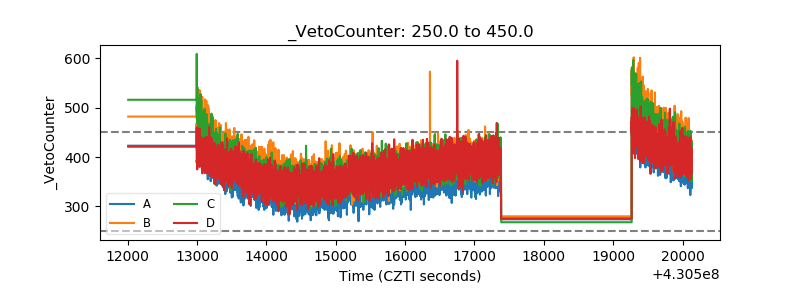 |