| Param | Original file | Final file |
|---|---|---|
| Filename | modeM0/AS1A05_013T01_9000005822_42734cztM0_level2.fits | modeM0/AS1A05_013T01_9000005822_42734cztM0_level2_quad_clean.evt |
| Size (bytes) | 319,152,960 | 87,779,520 |
| Size | 304.4 MB | 83.7 MB |
| Events in quadrant A | 2,840,555 | 603,258 |
| Events in quadrant B | 2,313,495 | 622,431 |
| Events in quadrant C | 3,638,738 | 558,979 |
| Events in quadrant D | 2,636,877 | 527,654 |
| Mode M0 | |||
|---|---|---|---|
| Quadrant | BADHDUFLAG | Total packets | Discarded packets |
| A | 0 | 11275 | 2 |
| B | 0 | 10034 | 2 |
| C | 0 | 13755 | 2 |
| D | 0 | 11187 | 2 |
| Mode M9 | |||
|---|---|---|---|
| Quadrant | BADHDUFLAG | Total packets | Discarded packets |
| A | 0 | 33 | 0 |
| B | 0 | 34 | 0 |
| C | 0 | 34 | 0 |
| D | 0 | 34 | 0 |
| Mode SS | |||
|---|---|---|---|
| Quadrant | BADHDUFLAG | Total packets | Discarded packets |
| A | 0 | 100 | 0 |
| B | 0 | 100 | 0 |
| C | 0 | 100 | 0 |
| D | 0 | 100 | 0 |
| Quadrant | Total seconds | Saturated seconds | Saturation percentage |
|---|---|---|---|
| A | 4931 | 22 | 0.446157% |
| B | 4930 | 9 | 0.182556% |
| C | 4930 | 268 | 5.436105% |
| D | 4930 | 84 | 1.703854% |
Noise dominated data is calculated using 1-second bins in cleaned event files. If a bin has >2000 counts, and if more than 50% of those come from <1% of pixels, then it is considered to be noise-dominated and hence unusable.
| Quadrant | # 1 sec bins | Bins with >0 counts | Bins with >2000 counts | High rate bins dominated by noise | Noise dominated (total time) | Noise dominated (detector-on time) | Marked lightcurve |
|---|---|---|---|---|---|---|---|
| A | 6933 | 4932 | 18 | 18 | 0.26% | 0.36% | 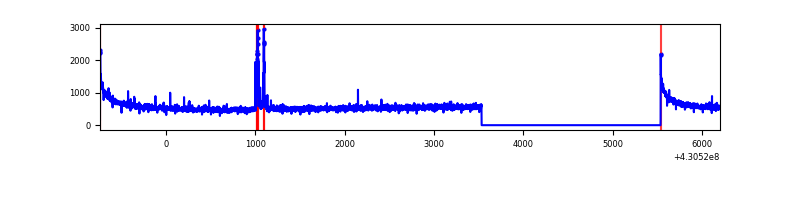 |
| B | 6932 | 4931 | 2 | 2 | 0.03% | 0.04% | 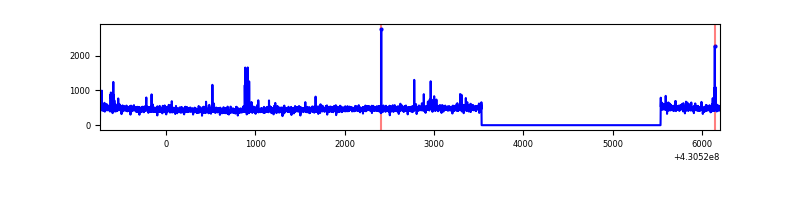 |
| C | 6932 | 4931 | 260 | 260 | 3.75% | 5.27% | 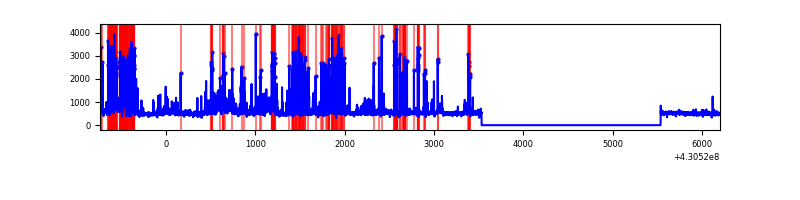 |
| D | 6932 | 4931 | 77 | 77 | 1.11% | 1.56% | 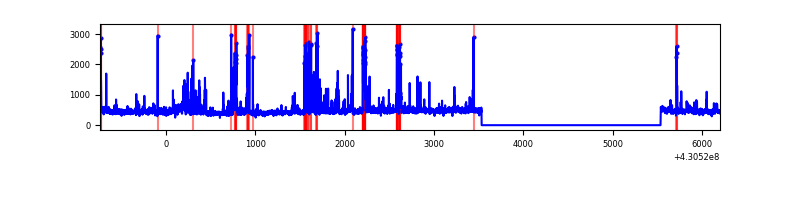 |
Top three noisy pixels from each quadrant. If the there are fewer than three noisy pixels in the level2.evt file, extra rows are filled as -1
| Pixel properties | Quadrant properties | ||||||
|---|---|---|---|---|---|---|---|
| Quadrant | DetID | PixID | Counts | Sigma | Mean | Median | Sigma |
| A | 10 | 83 | 515800 | 4360.38 | 574 | 562 | 118.2 |
| A | 13 | 248 | 98261 | 826.81 | 574 | 562 | 118.2 |
| A | 13 | 254 | 7052 | 54.92 | 574 | 562 | 118.2 |
| B | 4 | 80 | 17707 | 157.23 | 572 | 558 | 109.1 |
| B | 12 | 111 | 13412 | 117.85 | 572 | 558 | 109.1 |
| B | 5 | 255 | 13063 | 114.65 | 572 | 558 | 109.1 |
| C | 0 | 239 | 934962 | 7393.6 | 545 | 549 | 126.4 |
| C | 8 | 79 | 337547 | 2666.51 | 545 | 549 | 126.4 |
| C | 15 | 214 | 201347 | 1588.82 | 545 | 549 | 126.4 |
| D | 1 | 47 | 200610 | 1500.76 | 550 | 535 | 133.3 |
| D | 2 | 249 | 154294 | 1153.35 | 550 | 535 | 133.3 |
| D | 5 | 70 | 47717 | 353.91 | 550 | 535 | 133.3 |
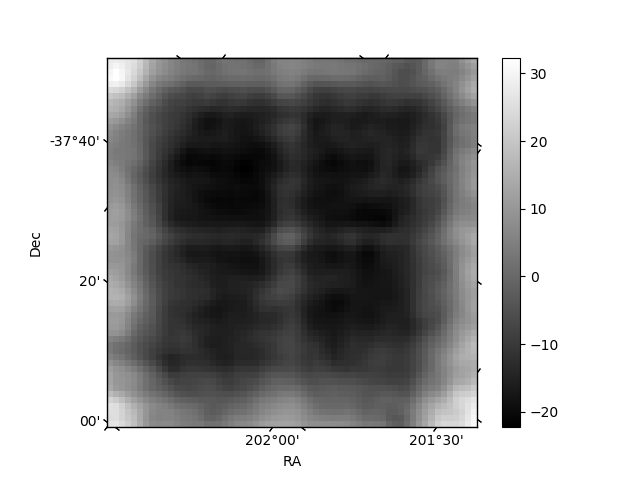
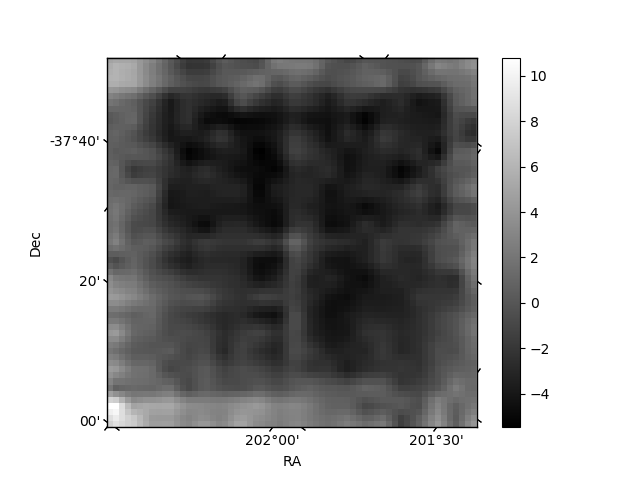
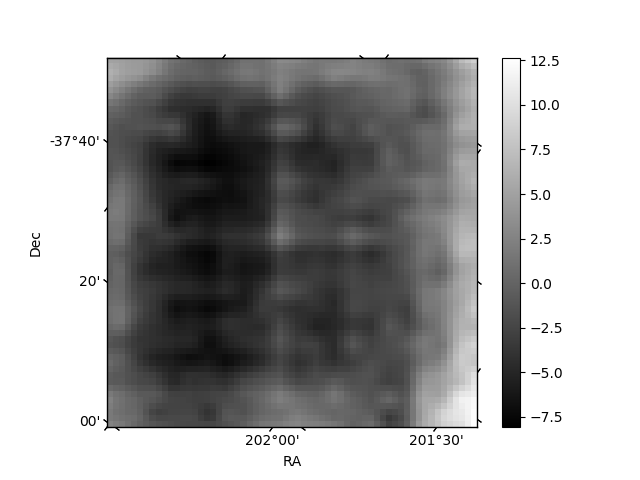
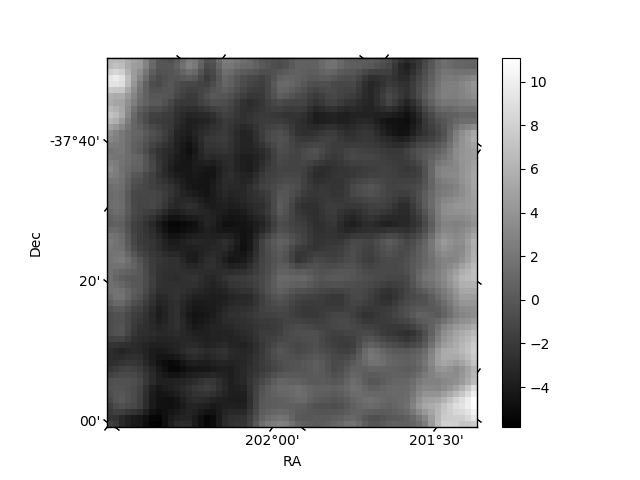
Histogram calculated using DETX and DETY for each event in the final _common_clean file
| Quadrant A | 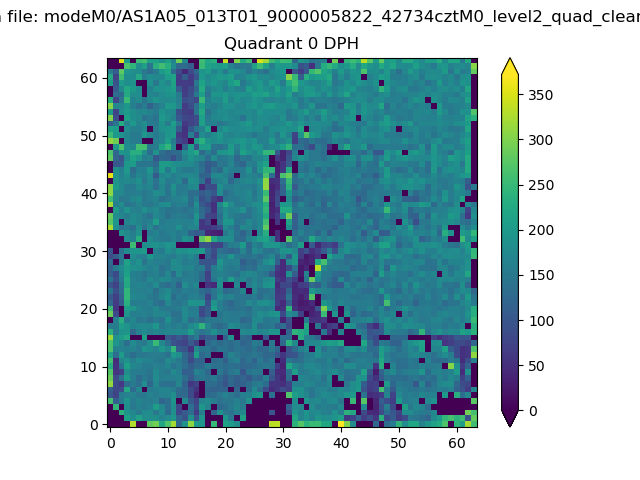 |
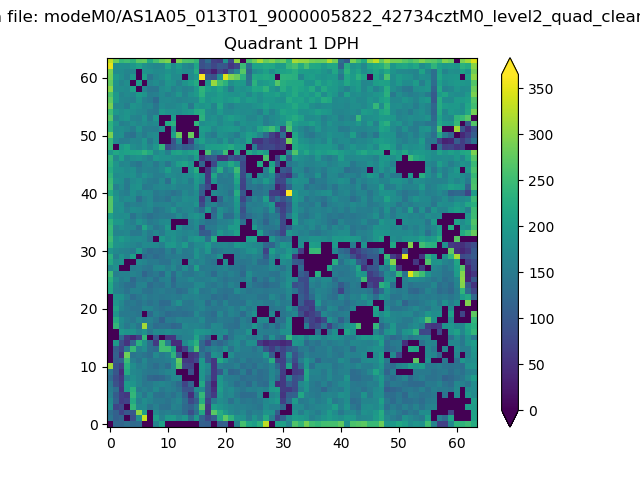 |
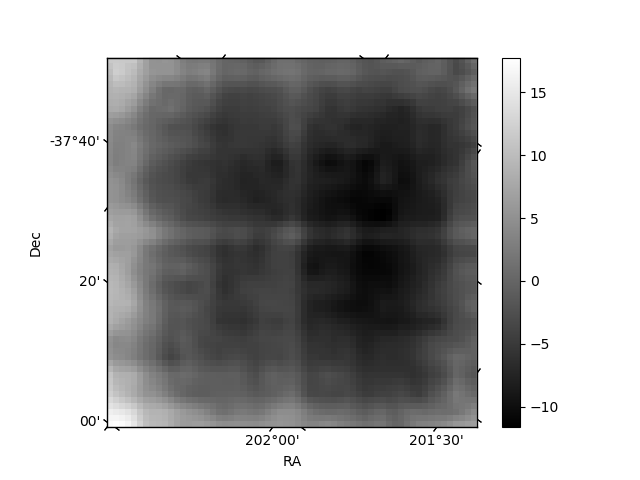
Quadrant B |
|---|---|---|---|
| Quadrant D | 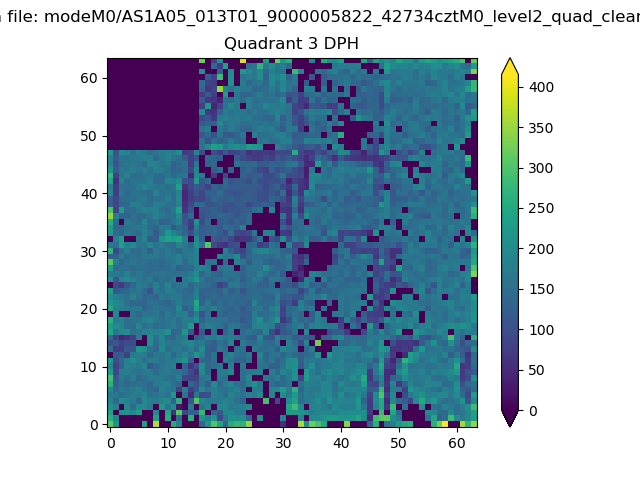 |
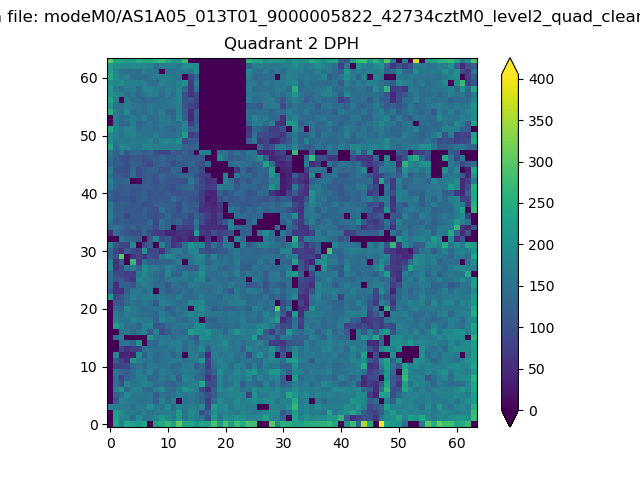 |
Quadrant C |
| Plot type | Count rate plots | Images |
|---|---|---|
| Comparison with Poisson distribution Blue bars denote a histogram of data divided into 1 sec bins. Red curve is a Poisson curve with rate = median count rate of data. |
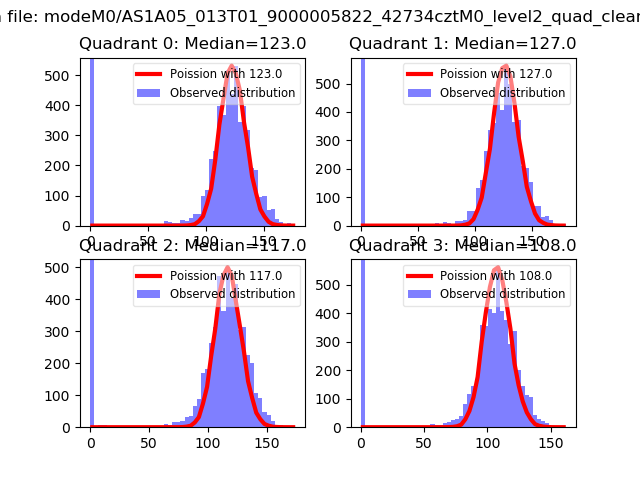 |
 |
| Quadrant-wise count rates Data is divided into 100 sec bins |
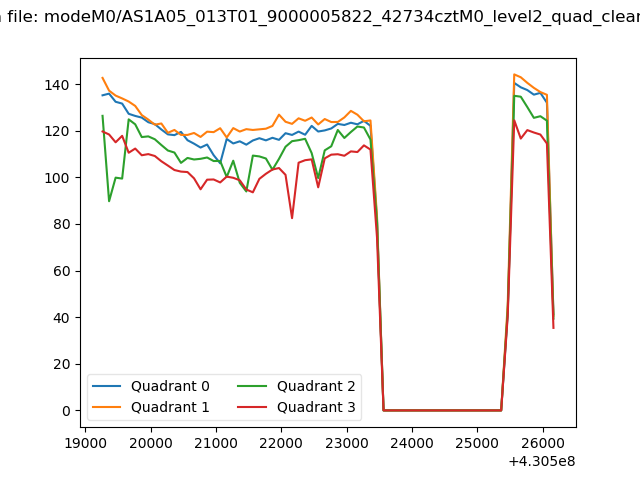 |
|
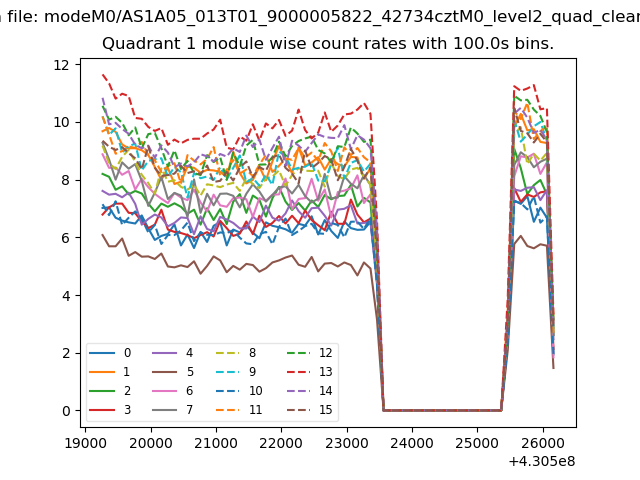
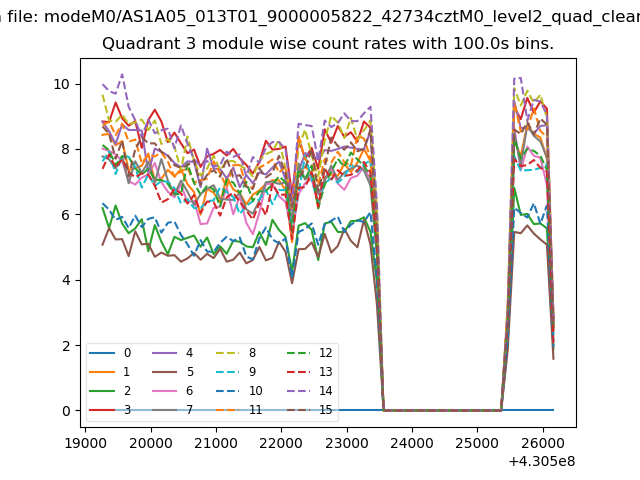
| Module-wise count rates for Quadrant A Data is divided into 100 sec bins |
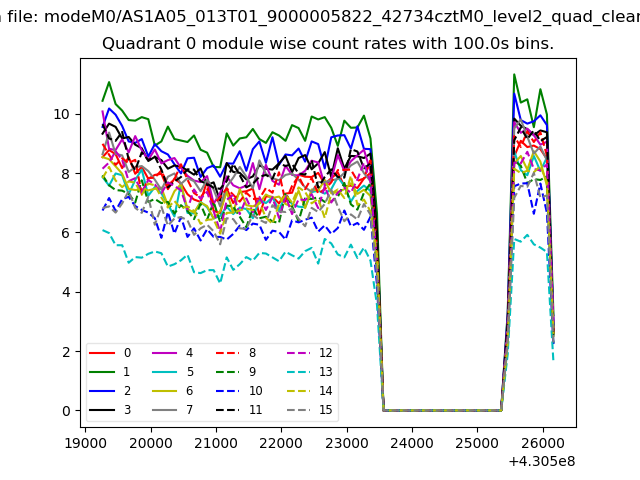 |
 |
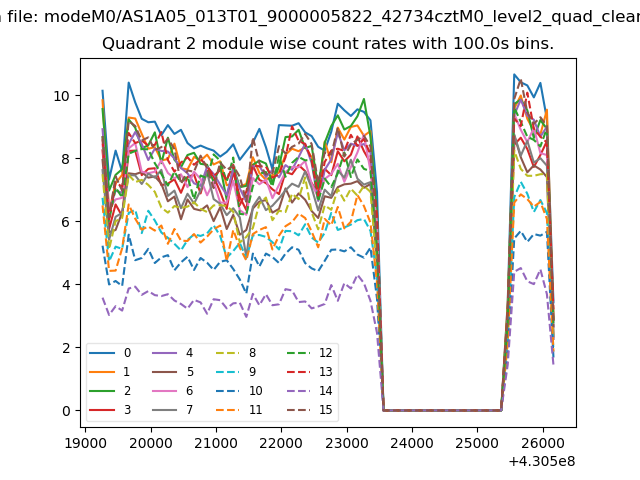
| Module-wise count rates for Quadrant B Data is divided into 100 sec bins |
 |
 |
| Module-wise count rates for Quadrant C Data is divided into 100 sec bins |
 |
 |
| Module-wise count rates for Quadrant D Data is divided into 100 sec bins |
 |
 |
| Parameter | Plot |
|---|---|
| CZT HV Monitor | 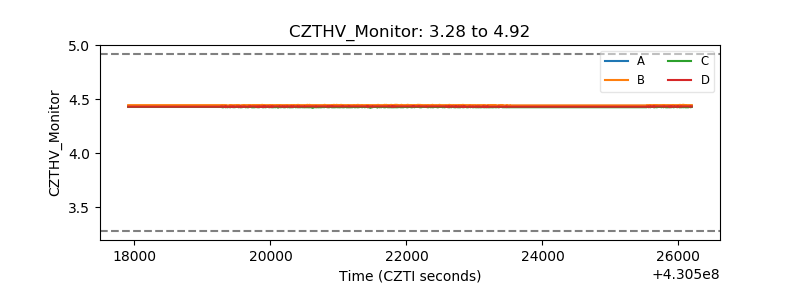 |
| D_VDD | 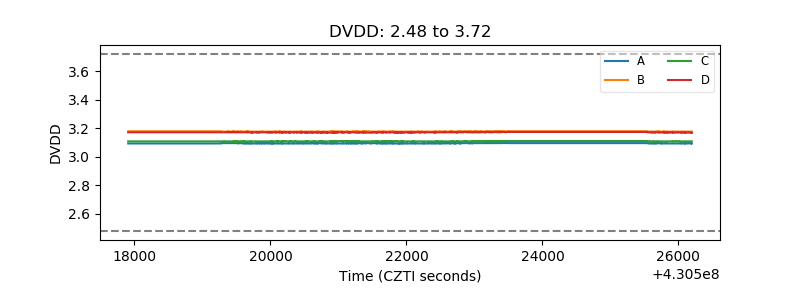 |
| Temperature 1 | 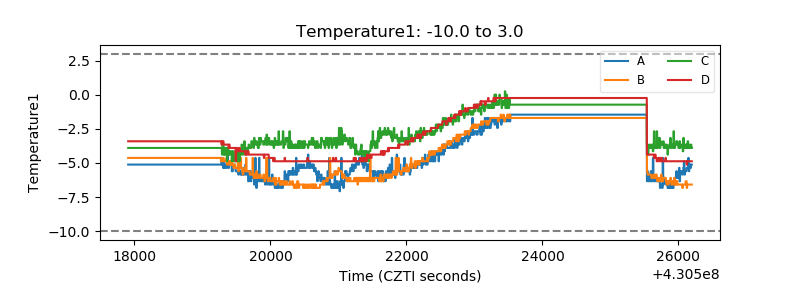 |
| Veto HV Monitor | 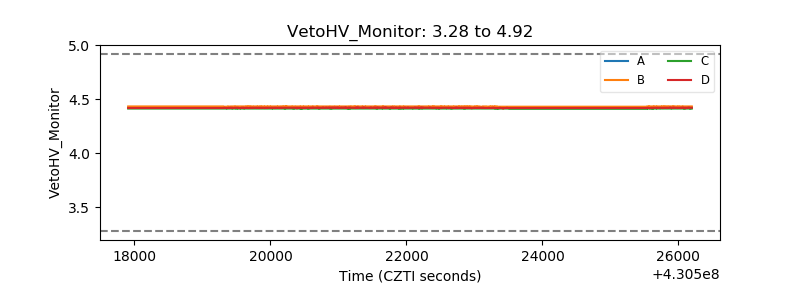 |
| Veto LLD | 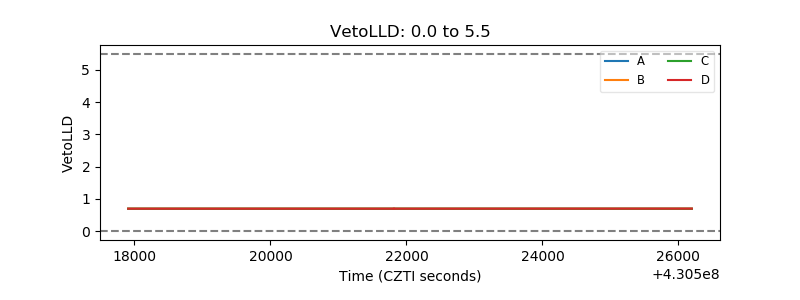 |
| Alpha Counter | 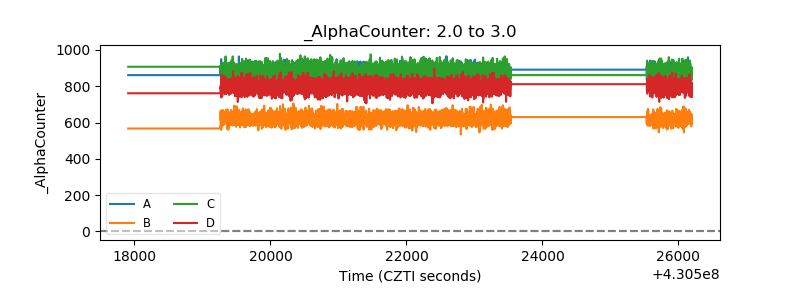 |
| _CPM_Rate | 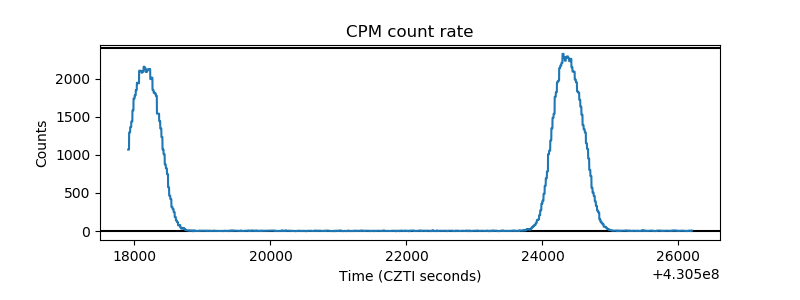 |
| CZT Counter | 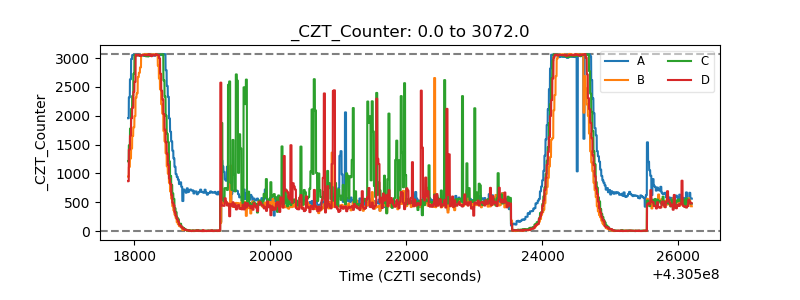 |
| +2.5 Volts monitor | 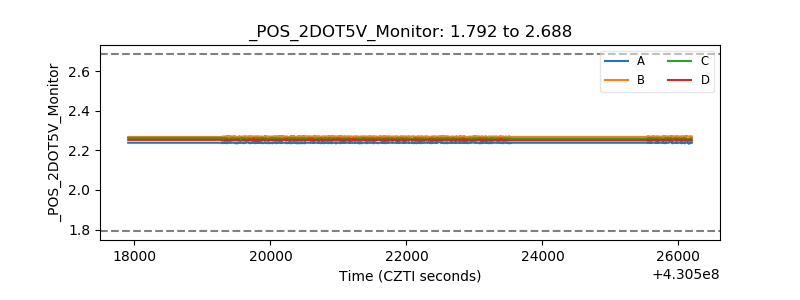 |
| +5 Volts monitor | 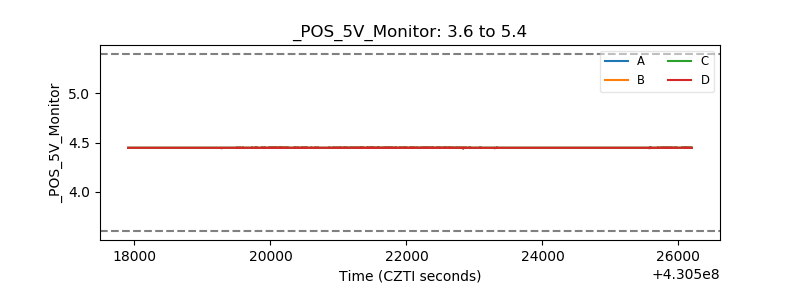 |
| _ROLL_ROT | 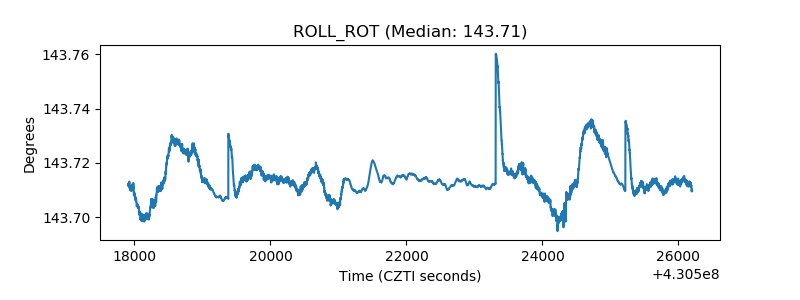 |
| _Roll_DEC |  |
| _Roll_RA | 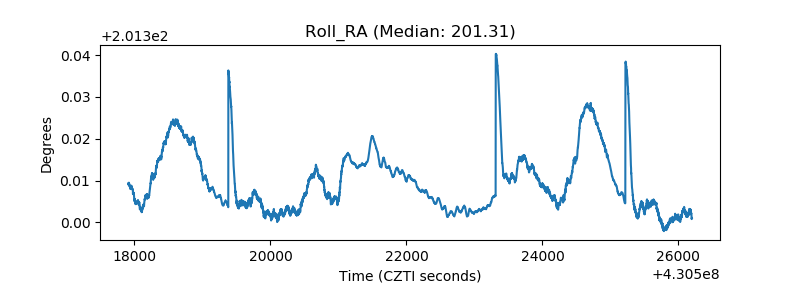 |
| Veto Counter | 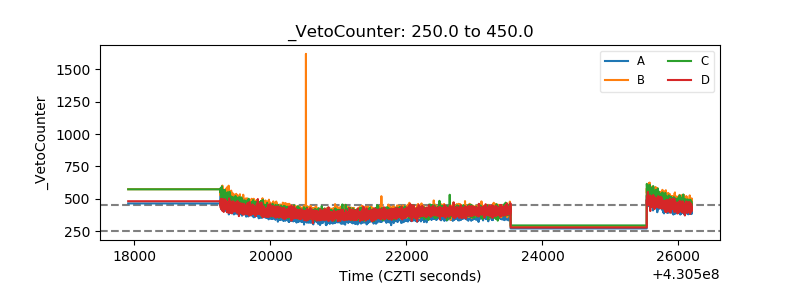 |