| Param | Original file | Final file |
|---|---|---|
| Filename | modeM0/AS1A05_013T01_9000005822_42735cztM0_level2.fits | modeM0/AS1A05_013T01_9000005822_42735cztM0_level2_quad_clean.evt |
| Size (bytes) | 297,653,760 | 91,206,720 |
| Size | 283.9 MB | 87.0 MB |
| Events in quadrant A | 2,860,368 | 627,848 |
| Events in quadrant B | 2,569,848 | 640,998 |
| Events in quadrant C | 2,567,629 | 598,003 |
| Events in quadrant D | 2,631,800 | 545,181 |
| Mode M0 | |||
|---|---|---|---|
| Quadrant | BADHDUFLAG | Total packets | Discarded packets |
| A | 0 | 11327 | 2 |
| B | 0 | 10761 | 2 |
| C | 0 | 10361 | 2 |
| D | 0 | 11227 | 2 |
| Mode M9 | |||
|---|---|---|---|
| Quadrant | BADHDUFLAG | Total packets | Discarded packets |
| A | 0 | 33 | 0 |
| B | 0 | 34 | 0 |
| C | 0 | 34 | 0 |
| D | 0 | 34 | 0 |
| Mode SS | |||
|---|---|---|---|
| Quadrant | BADHDUFLAG | Total packets | Discarded packets |
| A | 0 | 104 | 0 |
| B | 0 | 104 | 0 |
| C | 0 | 104 | 0 |
| D | 0 | 104 | 0 |
| Quadrant | Total seconds | Saturated seconds | Saturation percentage |
|---|---|---|---|
| A | 4984 | 7 | 0.140449% |
| B | 4984 | 27 | 0.541734% |
| C | 4984 | 13 | 0.260835% |
| D | 4984 | 63 | 1.264045% |
Noise dominated data is calculated using 1-second bins in cleaned event files. If a bin has >2000 counts, and if more than 50% of those come from <1% of pixels, then it is considered to be noise-dominated and hence unusable.
| Quadrant | # 1 sec bins | Bins with >0 counts | Bins with >2000 counts | High rate bins dominated by noise | Noise dominated (total time) | Noise dominated (detector-on time) | Marked lightcurve |
|---|---|---|---|---|---|---|---|
| A | 7078 | 4985 | 3 | 3 | 0.04% | 0.06% | 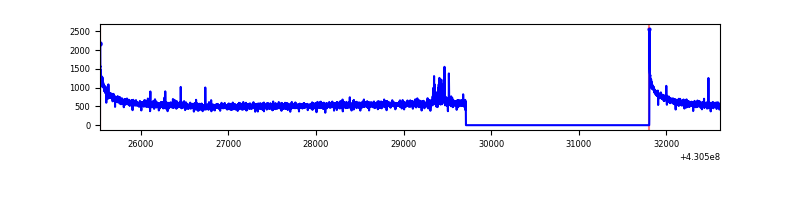 |
| B | 7078 | 4985 | 12 | 12 | 0.17% | 0.24% | 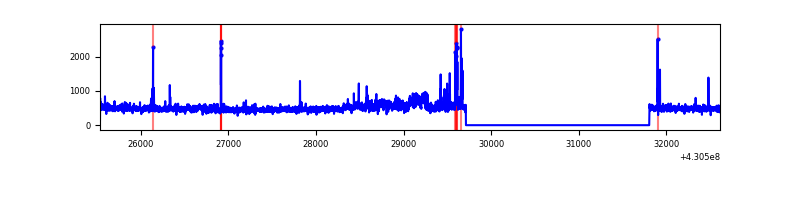 |
| C | 7078 | 4985 | 9 | 9 | 0.13% | 0.18% | 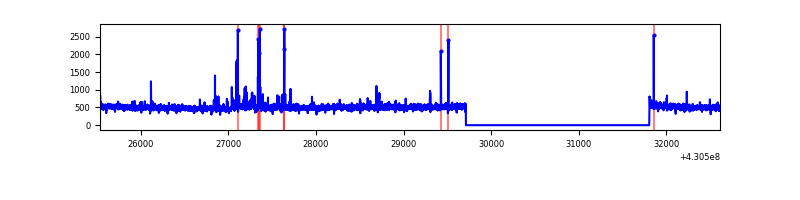 |
| D | 7078 | 4985 | 62 | 62 | 0.88% | 1.24% | 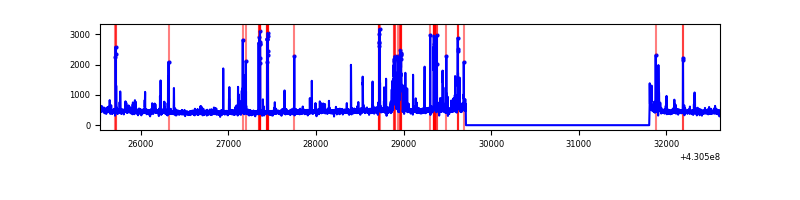 |
Top three noisy pixels from each quadrant. If the there are fewer than three noisy pixels in the level2.evt file, extra rows are filled as -1
| Pixel properties | Quadrant properties | ||||||
|---|---|---|---|---|---|---|---|
| Quadrant | DetID | PixID | Counts | Sigma | Mean | Median | Sigma |
| A | 10 | 83 | 538874 | 4476.12 | 591 | 580 | 120.3 |
| A | 13 | 248 | 35763 | 292.56 | 591 | 580 | 120.3 |
| A | 13 | 254 | 6880 | 52.39 | 591 | 580 | 120.3 |
| B | 0 | 229 | 134349 | 1183.23 | 589 | 574 | 113.1 |
| B | 15 | 85 | 32944 | 286.31 | 589 | 574 | 113.1 |
| B | 0 | 156 | 24744 | 213.78 | 589 | 574 | 113.1 |
| C | 15 | 214 | 206948 | 1562.61 | 573 | 577 | 132.1 |
| C | 0 | 207 | 58667 | 439.85 | 573 | 577 | 132.1 |
| C | 5 | 250 | 27661 | 205.08 | 573 | 577 | 132.1 |
| D | 1 | 47 | 216135 | 1564.88 | 567 | 550 | 137.8 |
| D | 12 | 6 | 67645 | 487.03 | 567 | 550 | 137.8 |
| D | 9 | 19 | 49232 | 353.37 | 567 | 550 | 137.8 |
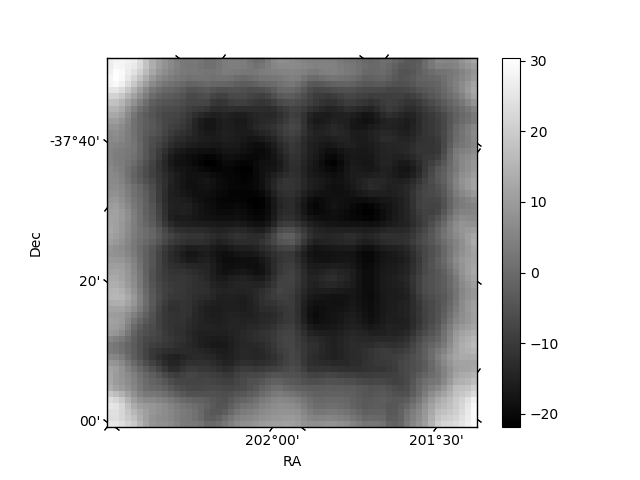
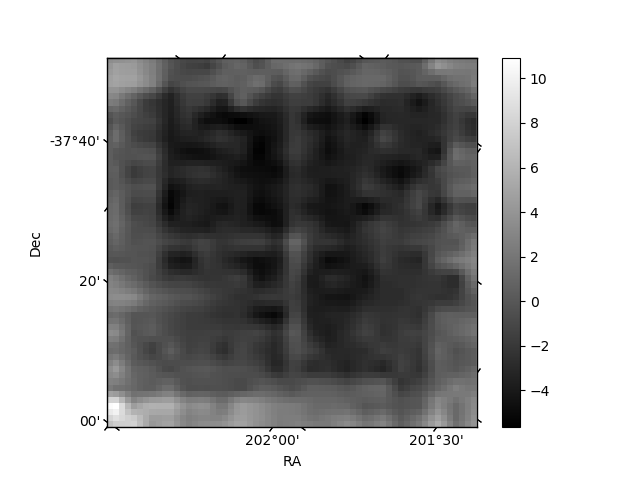
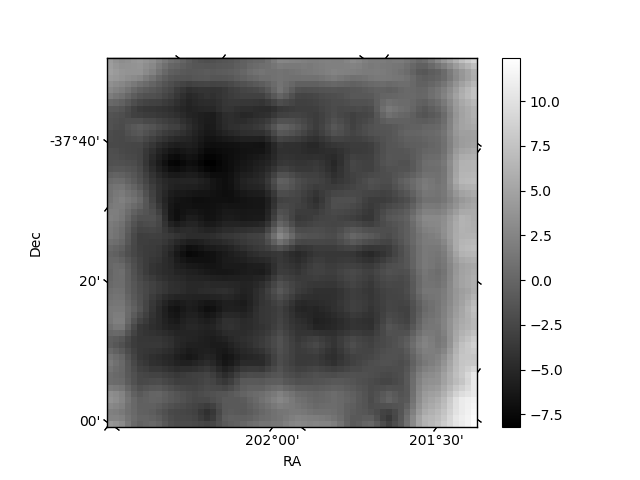
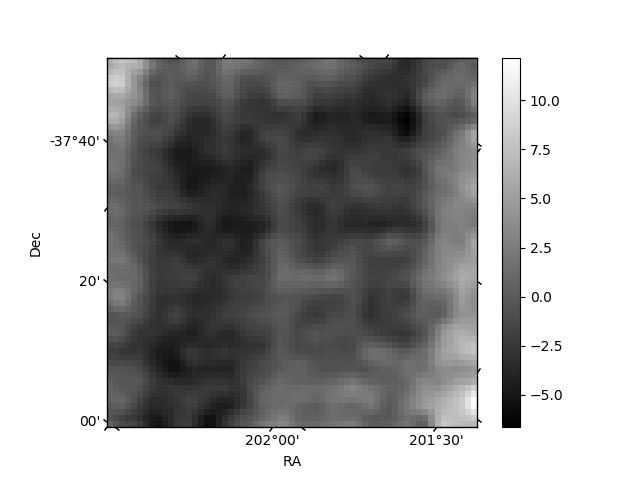
Histogram calculated using DETX and DETY for each event in the final _common_clean file
| Quadrant A | 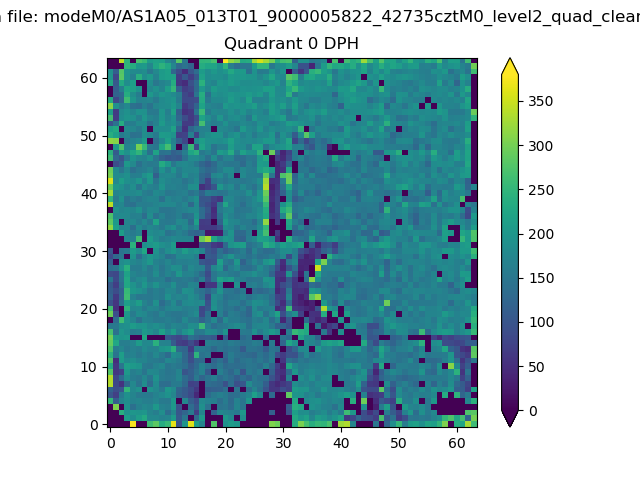 |
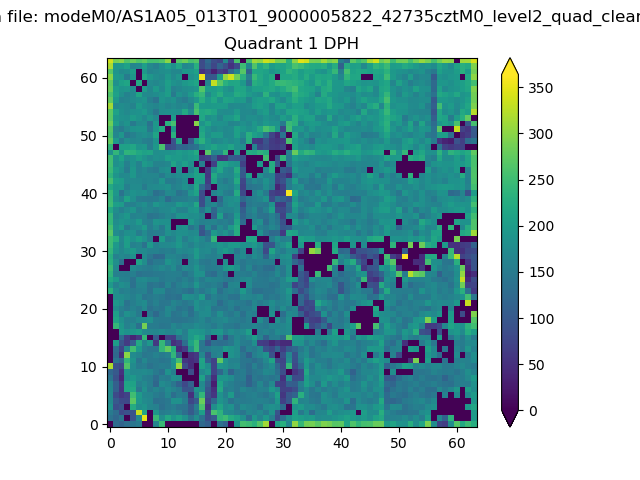 |
Quadrant B |
|---|---|---|---|
| Quadrant D | 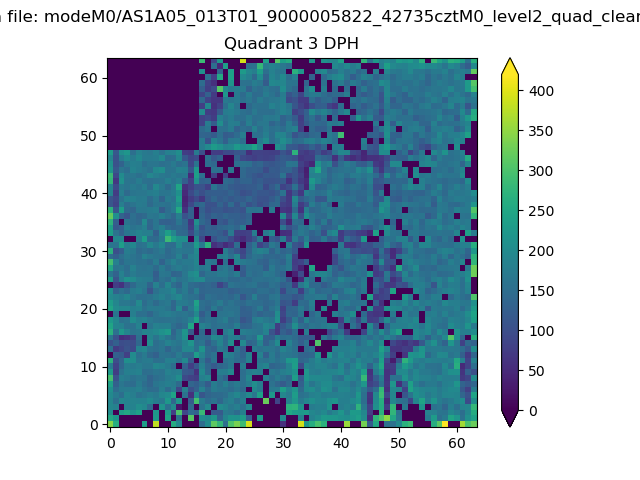 |
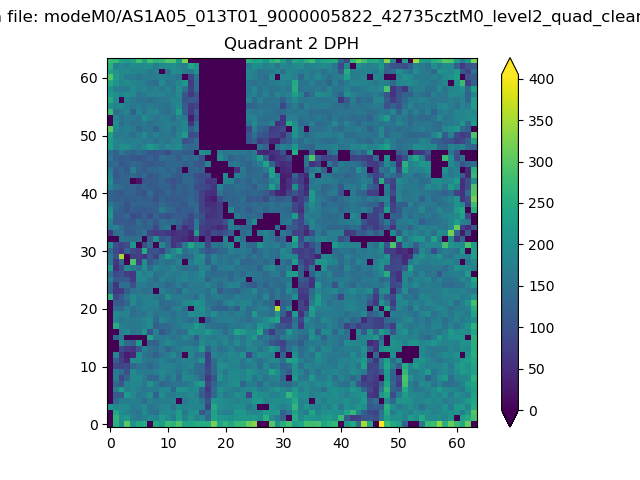 |
Quadrant C |
| Plot type | Count rate plots | Images |
|---|---|---|
| Comparison with Poisson distribution Blue bars denote a histogram of data divided into 1 sec bins. Red curve is a Poisson curve with rate = median count rate of data. |
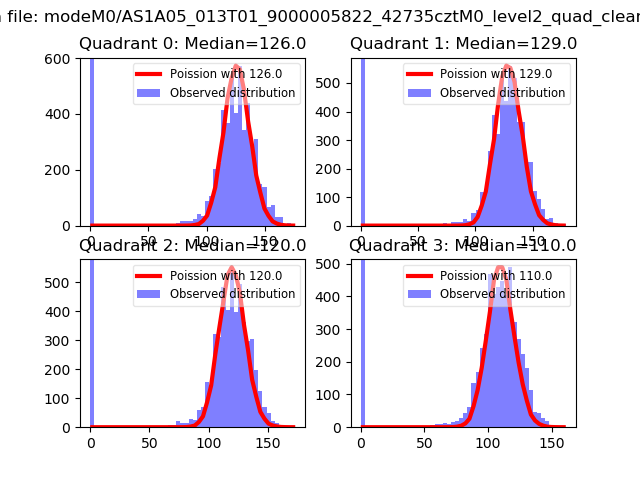 |
 |
| Quadrant-wise count rates Data is divided into 100 sec bins |
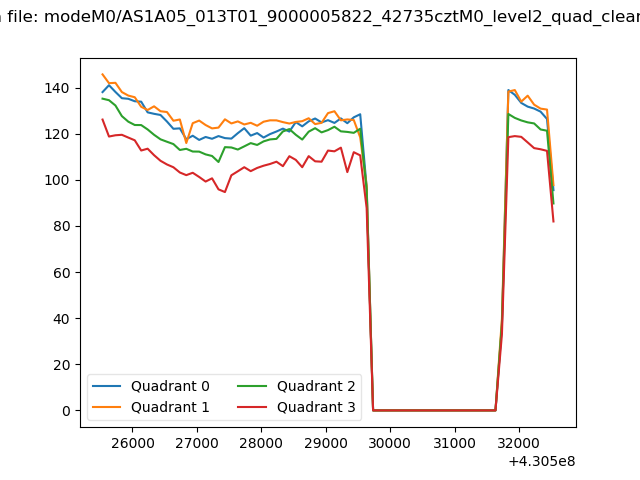 |
|
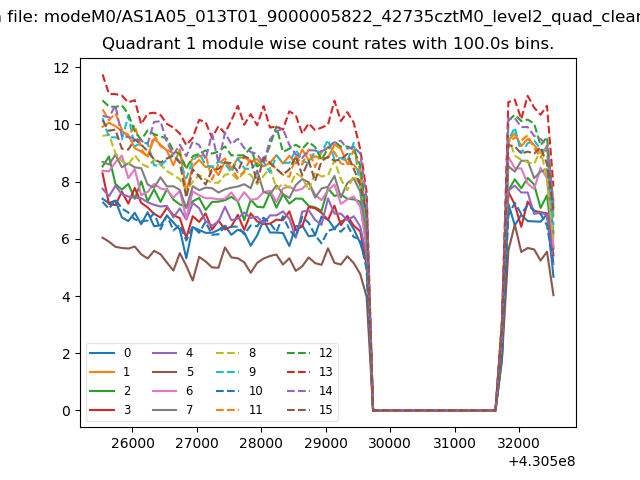
| Module-wise count rates for Quadrant A Data is divided into 100 sec bins |
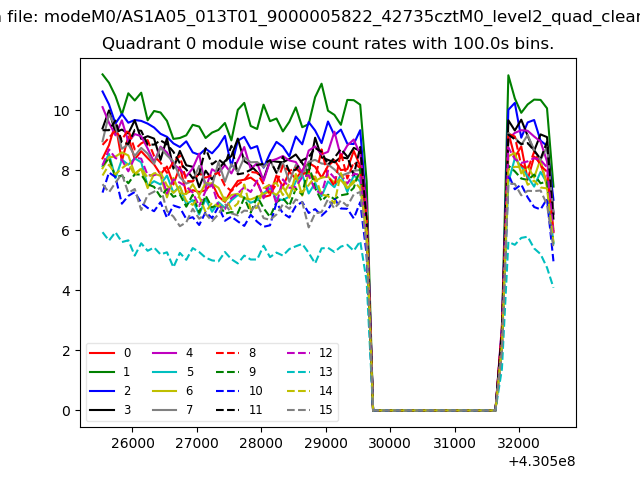 |
 |
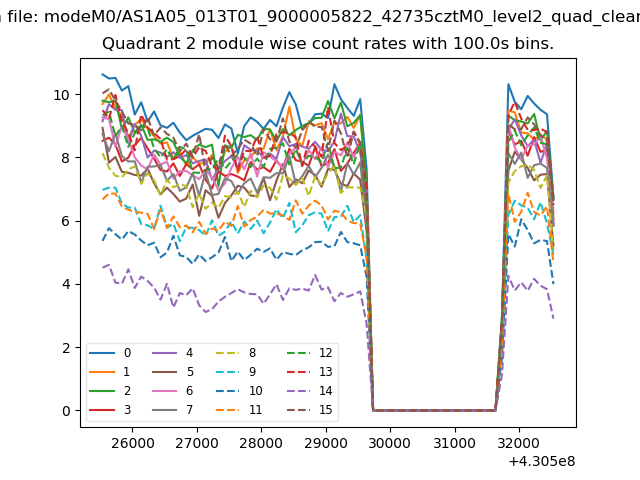
| Module-wise count rates for Quadrant B Data is divided into 100 sec bins |
 |
 |
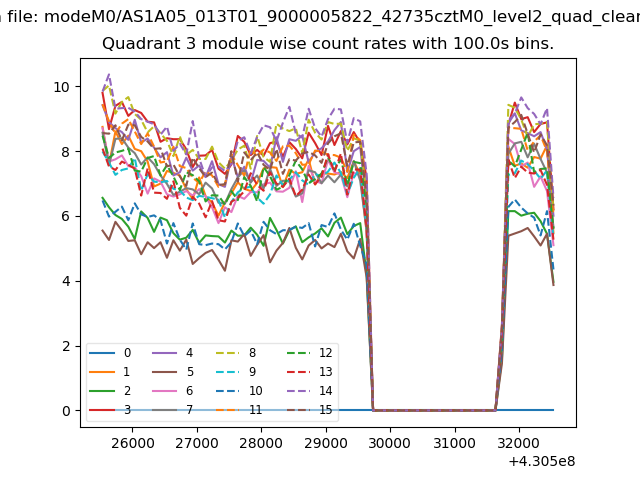
| Module-wise count rates for Quadrant C Data is divided into 100 sec bins |
 |
 |
| Module-wise count rates for Quadrant D Data is divided into 100 sec bins |
 |
 |
| Parameter | Plot |
|---|---|
| CZT HV Monitor | 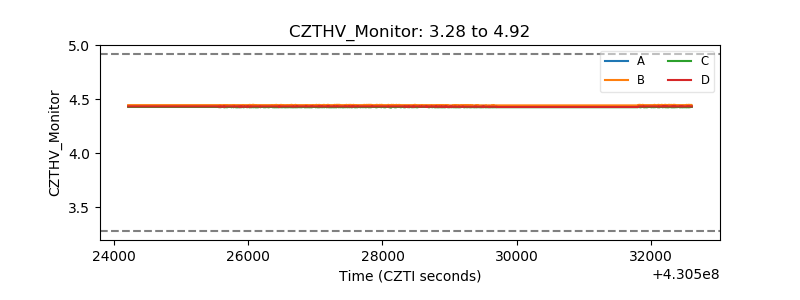 |
| D_VDD | 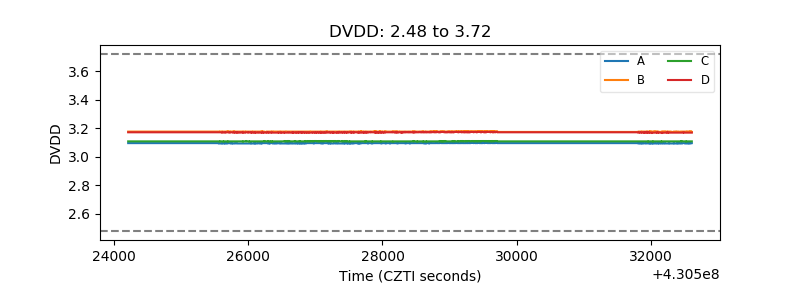 |
| Temperature 1 | 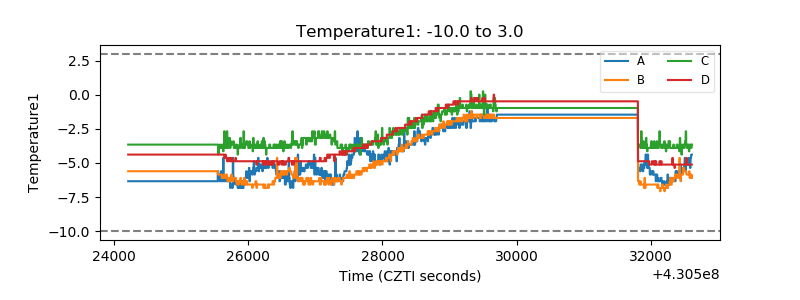 |
| Veto HV Monitor | 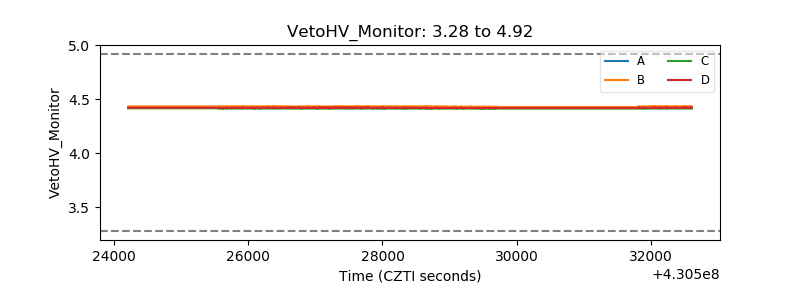 |
| Veto LLD | 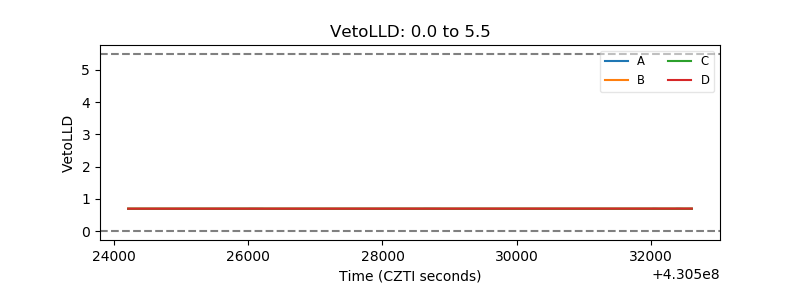 |
| Alpha Counter | 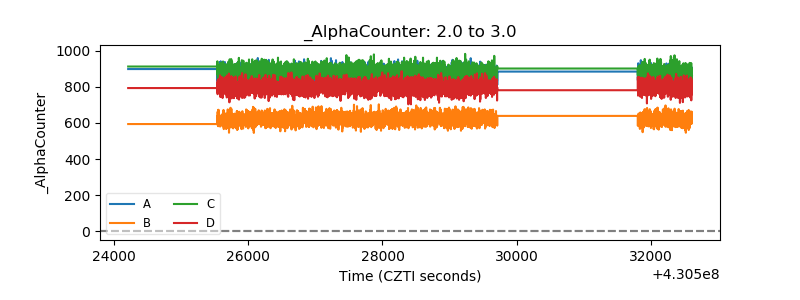 |
| _CPM_Rate | 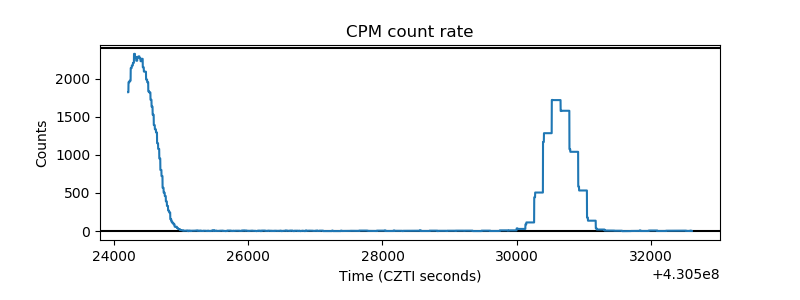 |
| CZT Counter | 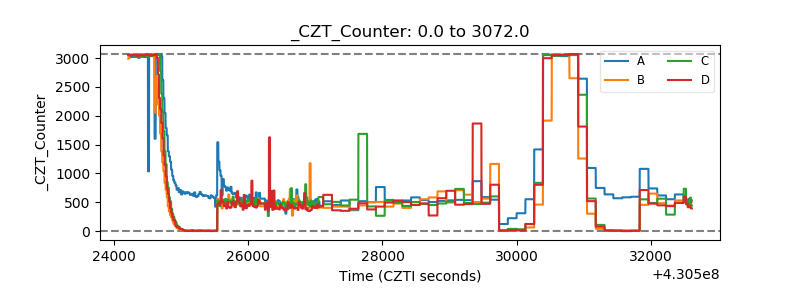 |
| +2.5 Volts monitor | 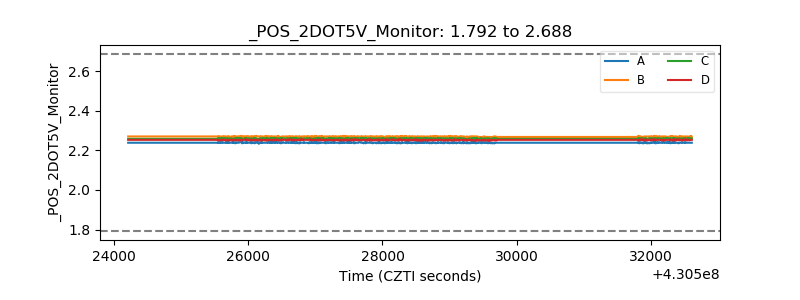 |
| +5 Volts monitor | 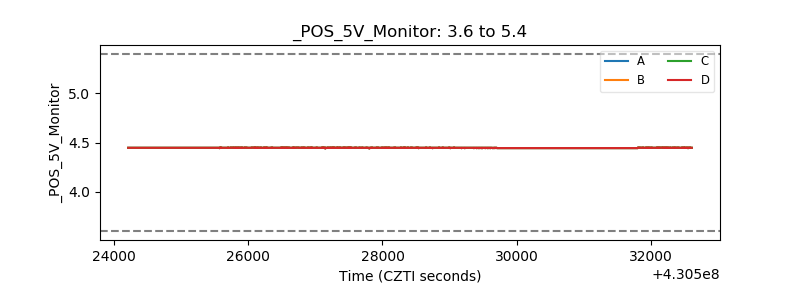 |
| _ROLL_ROT | 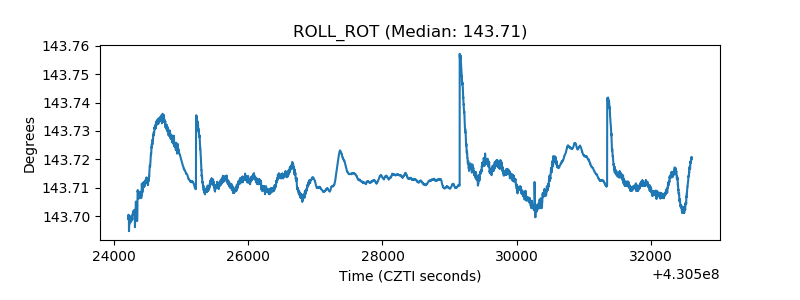 |
| _Roll_DEC | 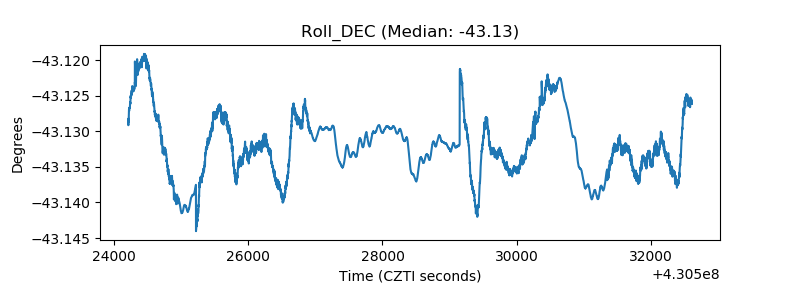 |
| _Roll_RA | 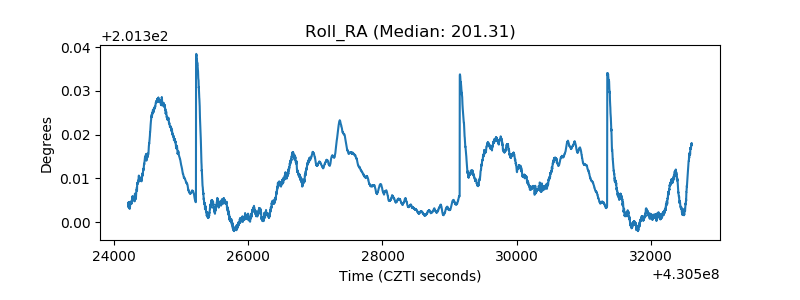 |
| Veto Counter | 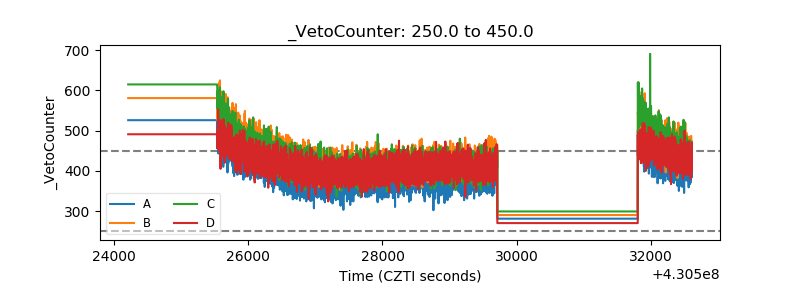 |