| Param | Original file | Final file |
|---|---|---|
| Filename | modeM0/AS1A05_013T01_9000005822_42736cztM0_level2.fits | modeM0/AS1A05_013T01_9000005822_42736cztM0_level2_quad_clean.evt |
| Size (bytes) | 288,979,200 | 87,649,920 |
| Size | 275.6 MB | 83.6 MB |
| Events in quadrant A | 2,750,856 | 600,227 |
| Events in quadrant B | 2,435,069 | 610,639 |
| Events in quadrant C | 2,522,873 | 575,011 |
| Events in quadrant D | 2,610,045 | 527,460 |
| Mode M0 | |||
|---|---|---|---|
| Quadrant | BADHDUFLAG | Total packets | Discarded packets |
| A | 0 | 10917 | 2 |
| B | 0 | 10314 | 2 |
| C | 0 | 10233 | 2 |
| D | 0 | 11047 | 2 |
| Mode M9 | |||
|---|---|---|---|
| Quadrant | BADHDUFLAG | Total packets | Discarded packets |
| A | 0 | 33 | 0 |
| B | 0 | 34 | 0 |
| C | 0 | 34 | 0 |
| D | 0 | 34 | 0 |
| Mode SS | |||
|---|---|---|---|
| Quadrant | BADHDUFLAG | Total packets | Discarded packets |
| A | 0 | 102 | 0 |
| B | 0 | 102 | 0 |
| C | 0 | 102 | 0 |
| D | 0 | 102 | 0 |
| Quadrant | Total seconds | Saturated seconds | Saturation percentage |
|---|---|---|---|
| A | 4850 | 10 | 0.206186% |
| B | 4850 | 47 | 0.969072% |
| C | 4850 | 9 | 0.185567% |
| D | 4850 | 44 | 0.907216% |
Noise dominated data is calculated using 1-second bins in cleaned event files. If a bin has >2000 counts, and if more than 50% of those come from <1% of pixels, then it is considered to be noise-dominated and hence unusable.
| Quadrant | # 1 sec bins | Bins with >0 counts | Bins with >2000 counts | High rate bins dominated by noise | Noise dominated (total time) | Noise dominated (detector-on time) | Marked lightcurve |
|---|---|---|---|---|---|---|---|
| A | 7003 | 4851 | 3 | 3 | 0.04% | 0.06% | 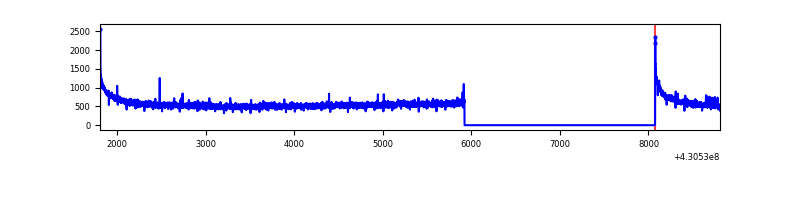 |
| B | 7003 | 4851 | 21 | 21 | 0.30% | 0.43% | 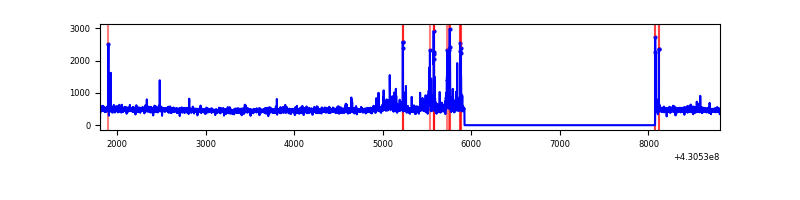 |
| C | 7003 | 4851 | 7 | 7 | 0.10% | 0.14% | 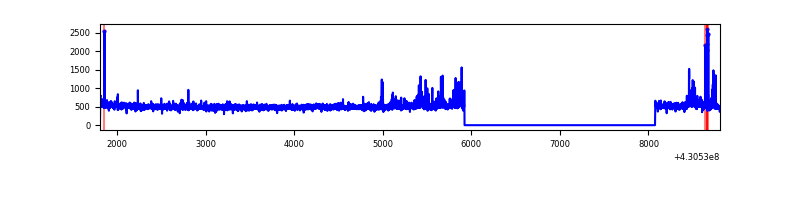 |
| D | 7003 | 4851 | 37 | 37 | 0.53% | 0.76% | 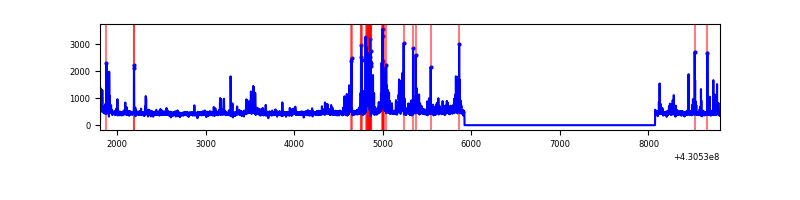 |
Top three noisy pixels from each quadrant. If the there are fewer than three noisy pixels in the level2.evt file, extra rows are filled as -1
| Pixel properties | Quadrant properties | ||||||
|---|---|---|---|---|---|---|---|
| Quadrant | DetID | PixID | Counts | Sigma | Mean | Median | Sigma |
| A | 10 | 83 | 522033 | 4520.04 | 570 | 558 | 115.4 |
| A | 12 | 189 | 11293 | 93.05 | 570 | 558 | 115.4 |
| A | 13 | 6 | 8819 | 71.6 | 570 | 558 | 115.4 |
| B | 5 | 172 | 121255 | 1134.27 | 566 | 552 | 106.4 |
| B | 15 | 35 | 20555 | 187.97 | 566 | 552 | 106.4 |
| B | 15 | 32 | 19907 | 181.88 | 566 | 552 | 106.4 |
| C | 15 | 214 | 202211 | 1555.36 | 557 | 561 | 129.6 |
| C | 0 | 239 | 71664 | 548.43 | 557 | 561 | 129.6 |
| C | 14 | 254 | 40007 | 304.25 | 557 | 561 | 129.6 |
| D | 2 | 249 | 306310 | 2276.81 | 552 | 536 | 134.3 |
| D | 13 | 249 | 51741 | 381.28 | 552 | 536 | 134.3 |
| D | 5 | 70 | 44507 | 327.41 | 552 | 536 | 134.3 |
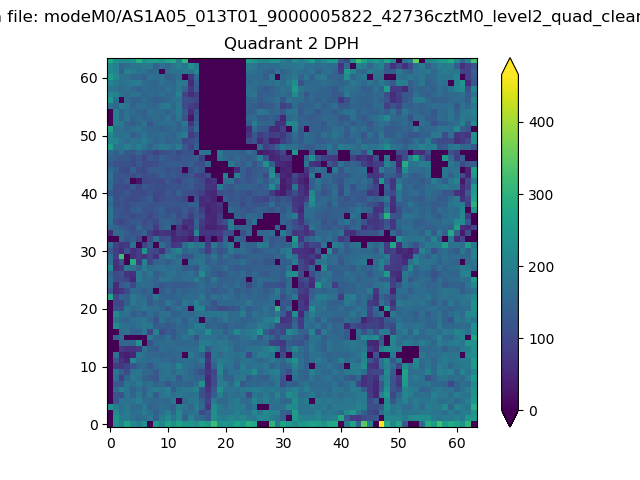
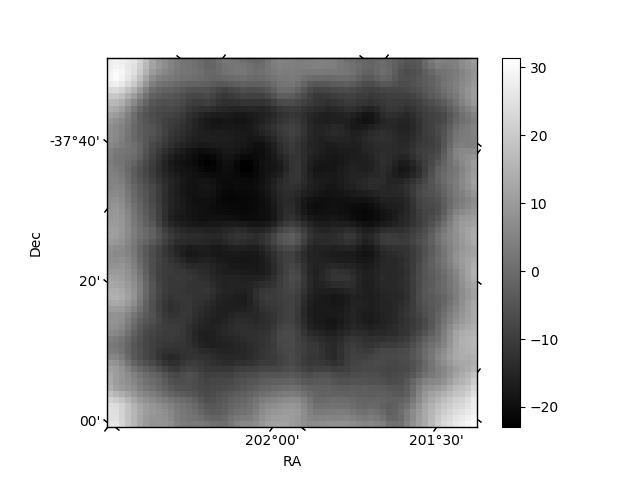
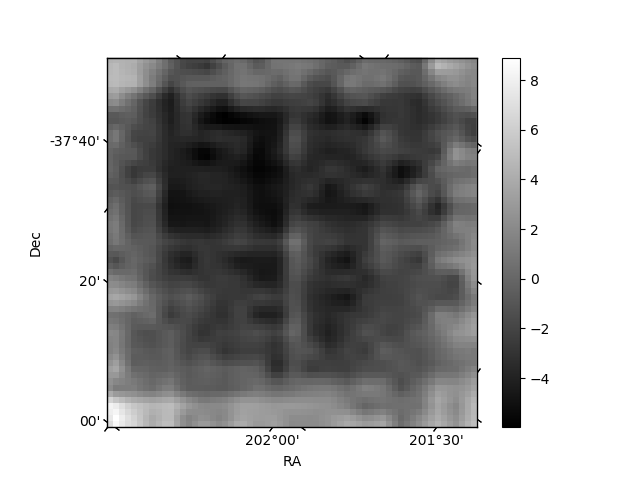
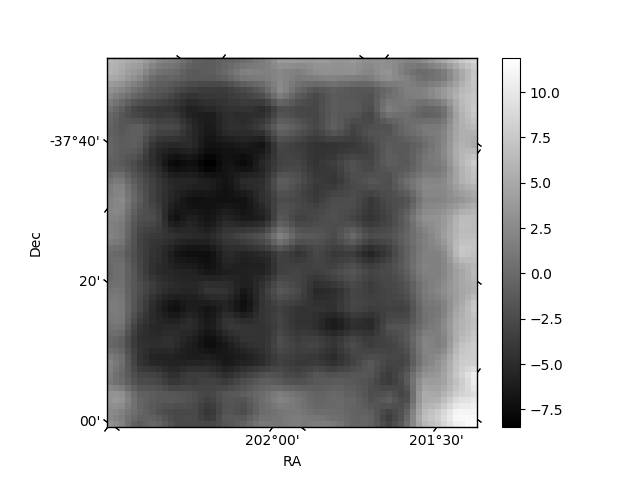
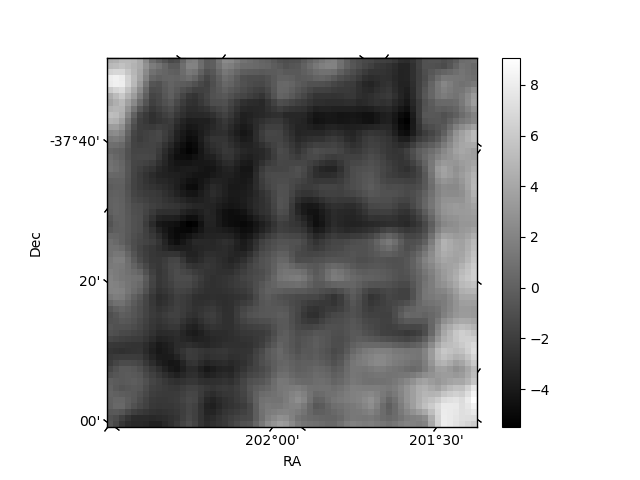
Histogram calculated using DETX and DETY for each event in the final _common_clean file
| Quadrant A | 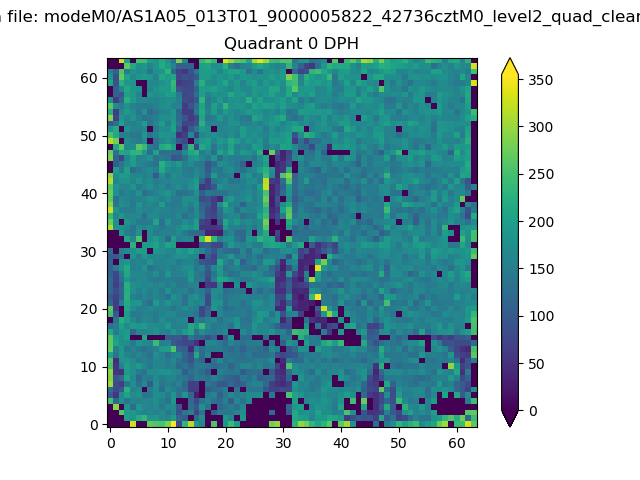 |
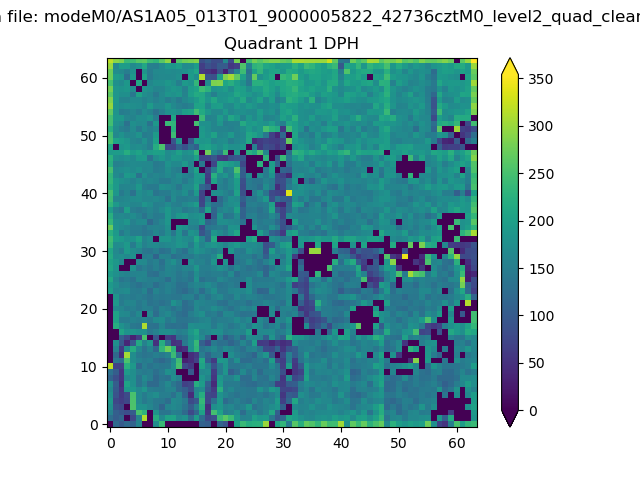 |
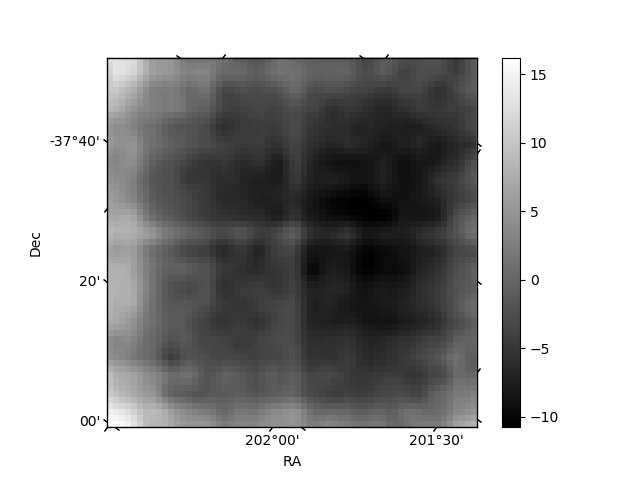
Quadrant B |
|---|---|---|---|
| Quadrant D | 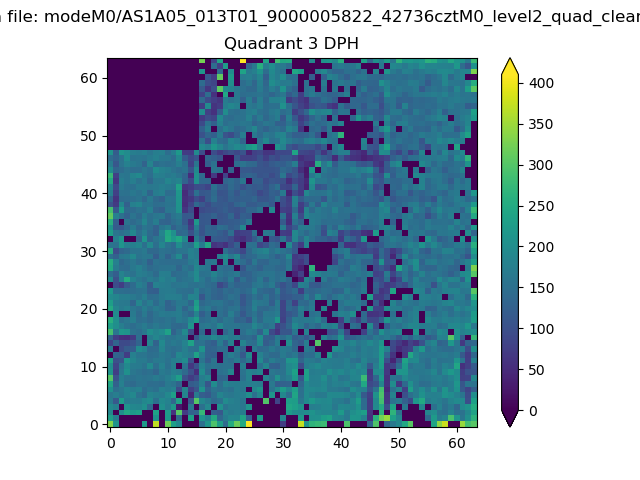 |
 |
Quadrant C |
| Plot type | Count rate plots | Images |
|---|---|---|
| Comparison with Poisson distribution Blue bars denote a histogram of data divided into 1 sec bins. Red curve is a Poisson curve with rate = median count rate of data. |
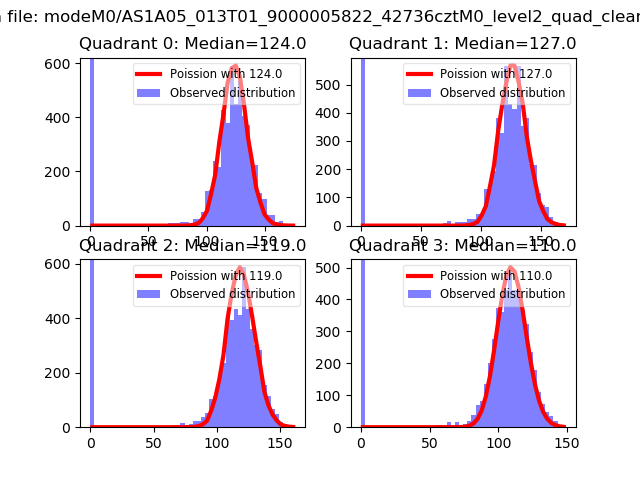 |
 |
| Quadrant-wise count rates Data is divided into 100 sec bins |
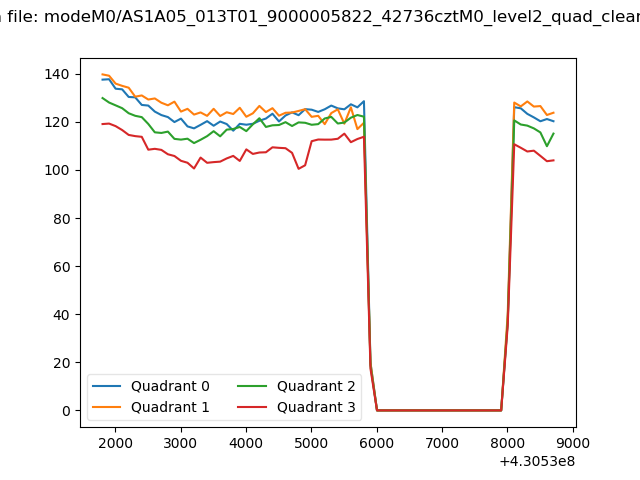 |
|
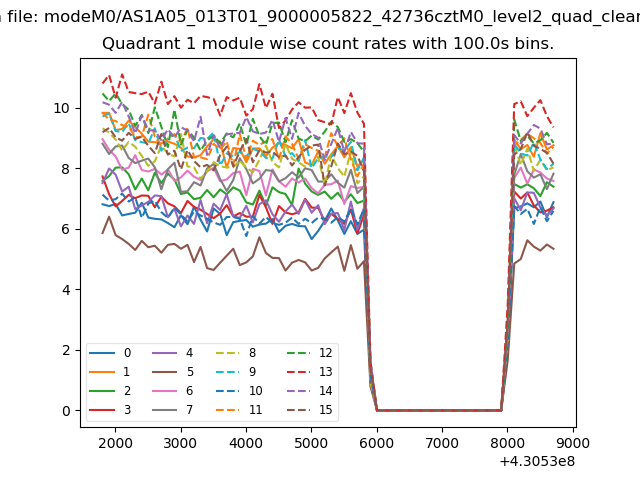
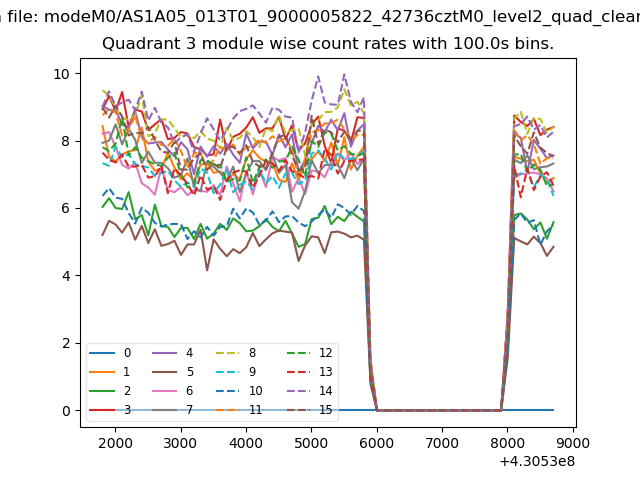
| Module-wise count rates for Quadrant A Data is divided into 100 sec bins |
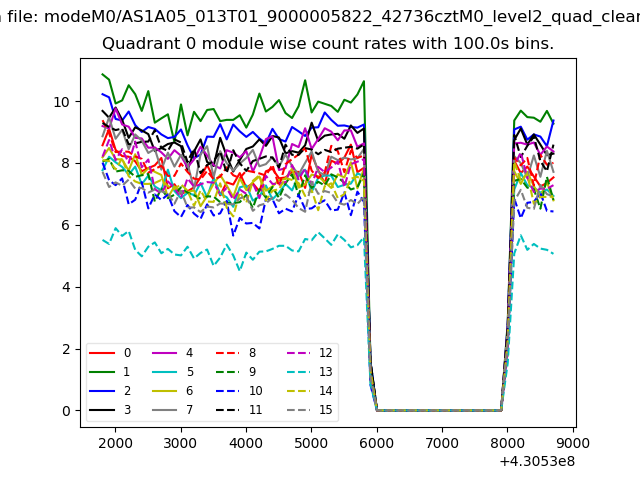 |
 |
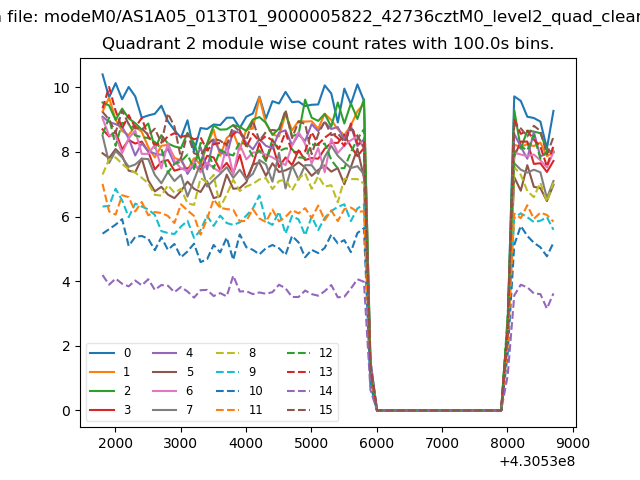
| Module-wise count rates for Quadrant B Data is divided into 100 sec bins |
 |
 |
| Module-wise count rates for Quadrant C Data is divided into 100 sec bins |
 |
 |
| Module-wise count rates for Quadrant D Data is divided into 100 sec bins |
 |
 |
| Parameter | Plot |
|---|---|
| CZT HV Monitor | 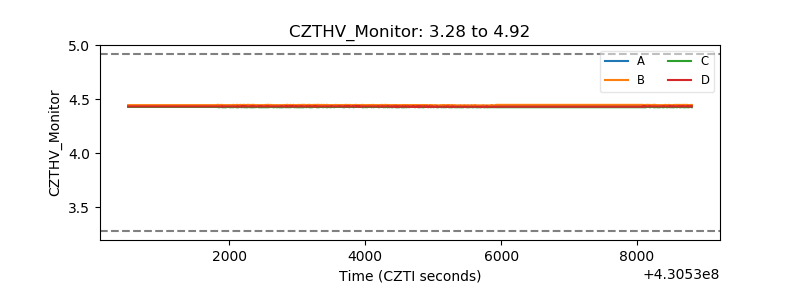 |
| D_VDD | 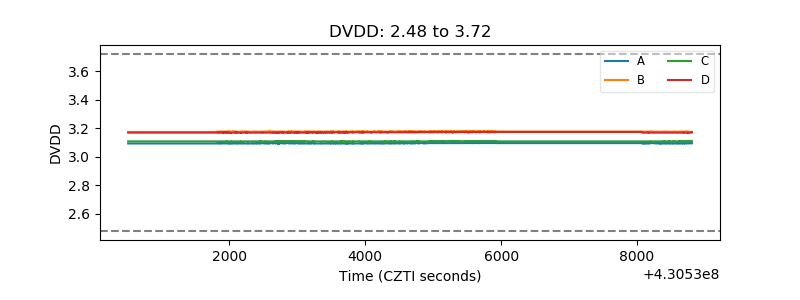 |
| Temperature 1 | 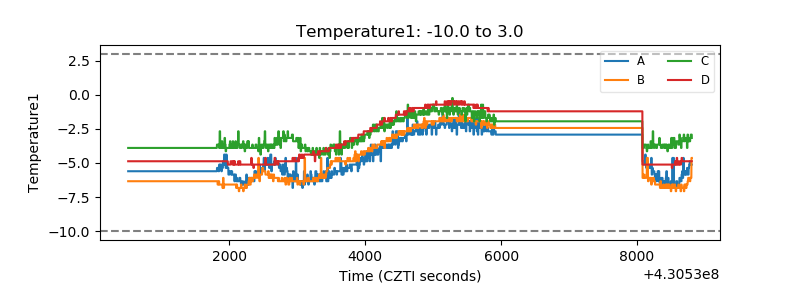 |
| Veto HV Monitor | 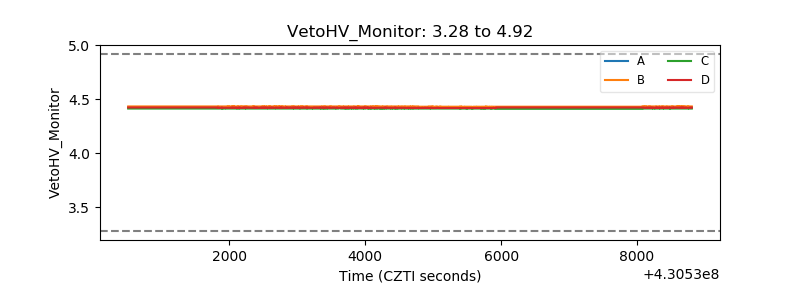 |
| Veto LLD | 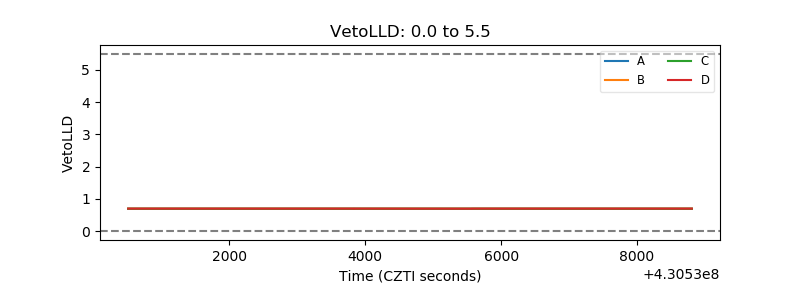 |
| Alpha Counter | 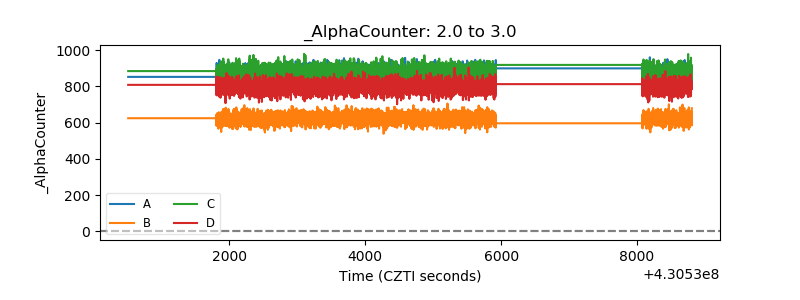 |
| _CPM_Rate | 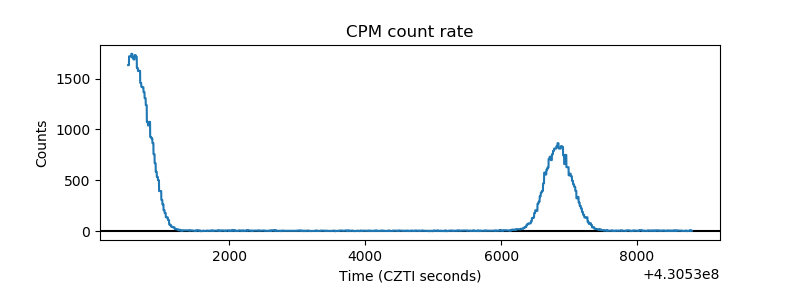 |
| CZT Counter | 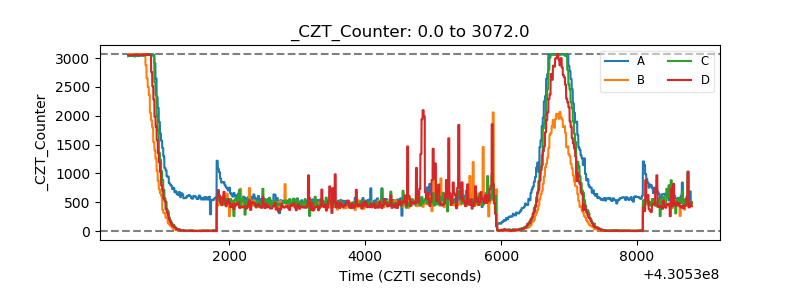 |
| +2.5 Volts monitor | 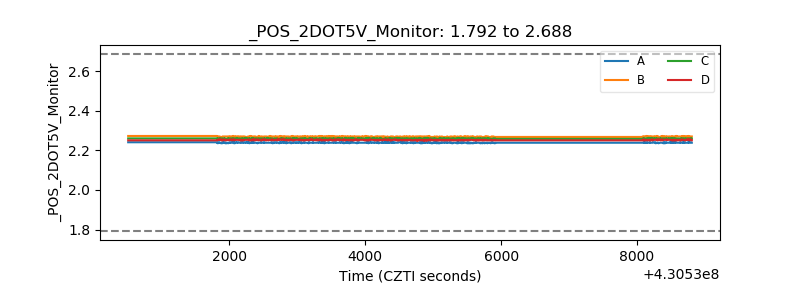 |
| +5 Volts monitor | 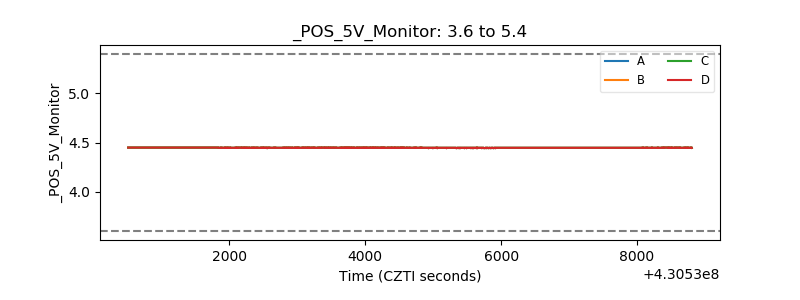 |
| _ROLL_ROT | 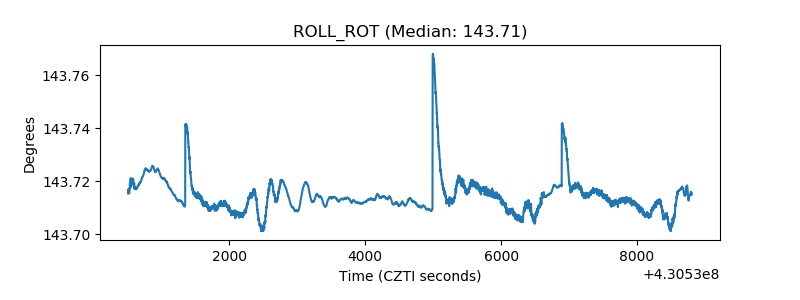 |
| _Roll_DEC | 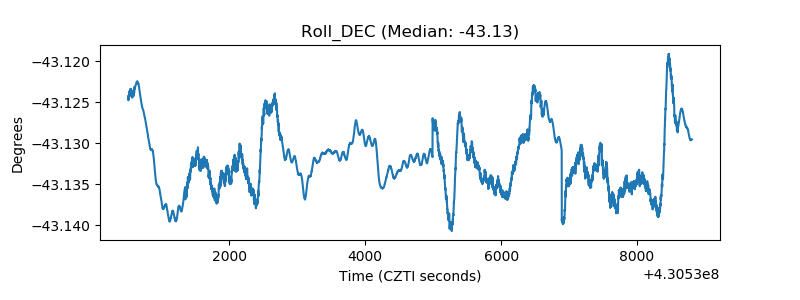 |
| _Roll_RA | 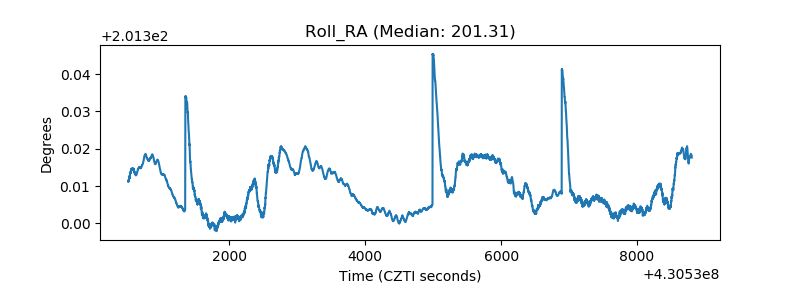 |
| Veto Counter | 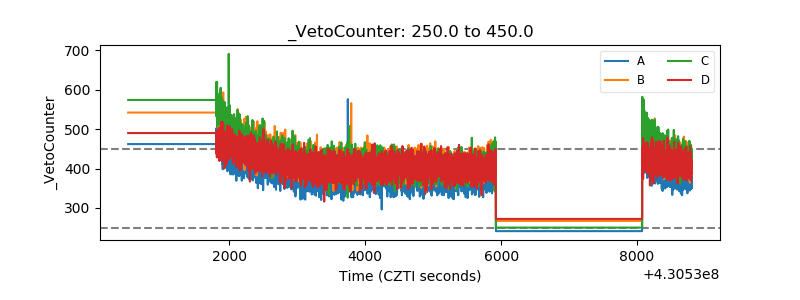 |