| Param | Original file | Final file |
|---|---|---|
| Filename | modeM0/AS1A05_013T01_9000005822_42737cztM0_level2.fits | modeM0/AS1A05_013T01_9000005822_42737cztM0_level2_quad_clean.evt |
| Size (bytes) | 313,248,960 | 90,961,920 |
| Size | 298.7 MB | 86.7 MB |
| Events in quadrant A | 2,942,402 | 619,055 |
| Events in quadrant B | 2,725,563 | 630,298 |
| Events in quadrant C | 2,745,155 | 597,800 |
| Events in quadrant D | 2,772,866 | 539,768 |
| Mode M0 | |||
|---|---|---|---|
| Quadrant | BADHDUFLAG | Total packets | Discarded packets |
| A | 0 | 11695 | 2 |
| B | 0 | 11582 | 2 |
| C | 0 | 11249 | 2 |
| D | 0 | 11930 | 2 |
| Mode M9 | |||
|---|---|---|---|
| Quadrant | BADHDUFLAG | Total packets | Discarded packets |
| A | 0 | 33 | 0 |
| B | 0 | 34 | 0 |
| C | 0 | 34 | 0 |
| D | 0 | 34 | 0 |
| Mode SS | |||
|---|---|---|---|
| Quadrant | BADHDUFLAG | Total packets | Discarded packets |
| A | 0 | 106 | 0 |
| B | 0 | 106 | 0 |
| C | 0 | 106 | 0 |
| D | 0 | 106 | 0 |
| Quadrant | Total seconds | Saturated seconds | Saturation percentage |
|---|---|---|---|
| A | 5253 | 9 | 0.171331% |
| B | 5253 | 79 | 1.503903% |
| C | 5253 | 19 | 0.361698% |
| D | 5253 | 126 | 2.398629% |
Noise dominated data is calculated using 1-second bins in cleaned event files. If a bin has >2000 counts, and if more than 50% of those come from <1% of pixels, then it is considered to be noise-dominated and hence unusable.
| Quadrant | # 1 sec bins | Bins with >0 counts | Bins with >2000 counts | High rate bins dominated by noise | Noise dominated (total time) | Noise dominated (detector-on time) | Marked lightcurve |
|---|---|---|---|---|---|---|---|
| A | 7316 | 5254 | 4 | 4 | 0.05% | 0.08% | 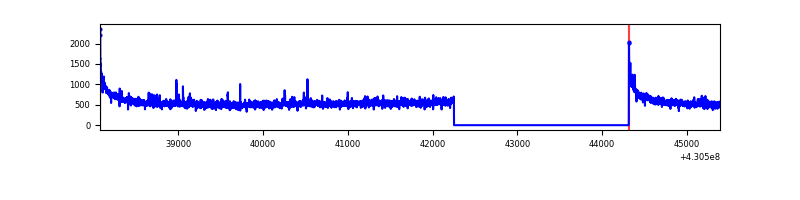 |
| B | 7316 | 5254 | 43 | 43 | 0.59% | 0.82% | 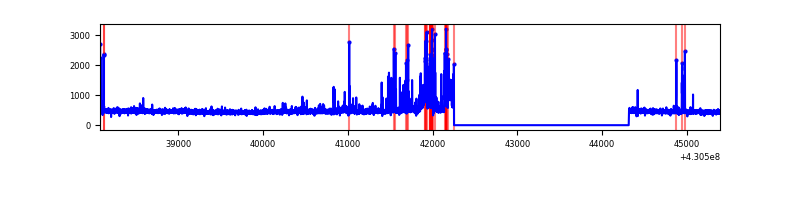 |
| C | 7316 | 5254 | 18 | 18 | 0.25% | 0.34% | 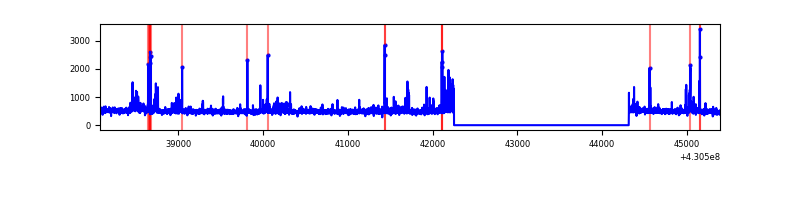 |
| D | 7316 | 5254 | 105 | 105 | 1.44% | 2.00% | 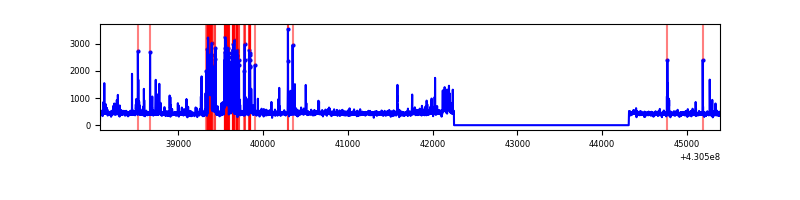 |
Top three noisy pixels from each quadrant. If the there are fewer than three noisy pixels in the level2.evt file, extra rows are filled as -1
| Pixel properties | Quadrant properties | ||||||
|---|---|---|---|---|---|---|---|
| Quadrant | DetID | PixID | Counts | Sigma | Mean | Median | Sigma |
| A | 10 | 83 | 567663 | 4623.0 | 601 | 589 | 122.7 |
| A | 12 | 189 | 46488 | 374.19 | 601 | 589 | 122.7 |
| A | 13 | 254 | 6797 | 50.61 | 601 | 589 | 122.7 |
| B | 5 | 172 | 310535 | 2710.98 | 593 | 577 | 114.3 |
| B | 0 | 245 | 22234 | 189.42 | 593 | 577 | 114.3 |
| B | 0 | 156 | 18343 | 155.39 | 593 | 577 | 114.3 |
| C | 15 | 214 | 220607 | 1596.67 | 587 | 590 | 137.8 |
| C | 0 | 239 | 126620 | 914.6 | 587 | 590 | 137.8 |
| C | 0 | 207 | 52474 | 376.52 | 587 | 590 | 137.8 |
| D | 13 | 249 | 362613 | 2559.29 | 580 | 564 | 141.5 |
| D | 11 | 192 | 58504 | 409.57 | 580 | 564 | 141.5 |
| D | 2 | 249 | 39931 | 278.28 | 580 | 564 | 141.5 |
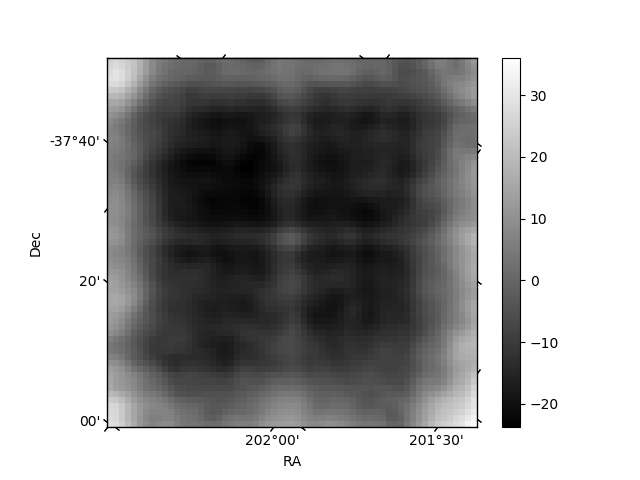
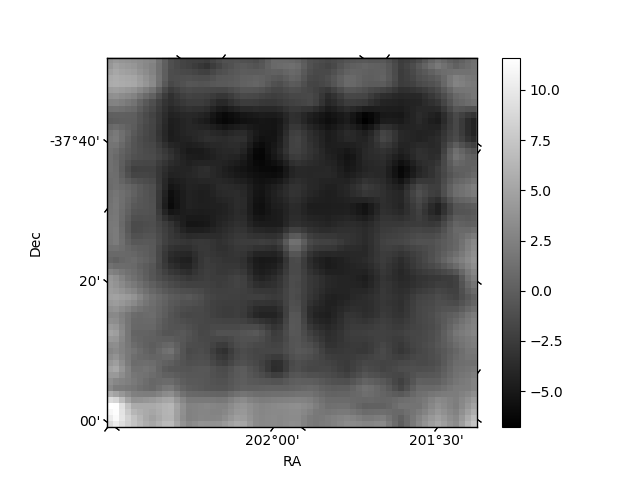
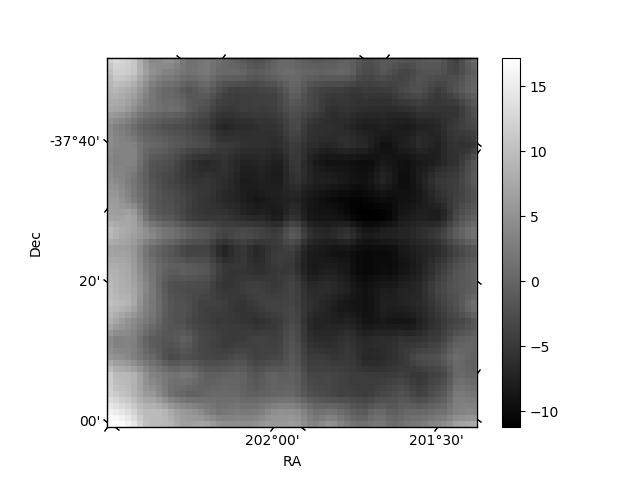
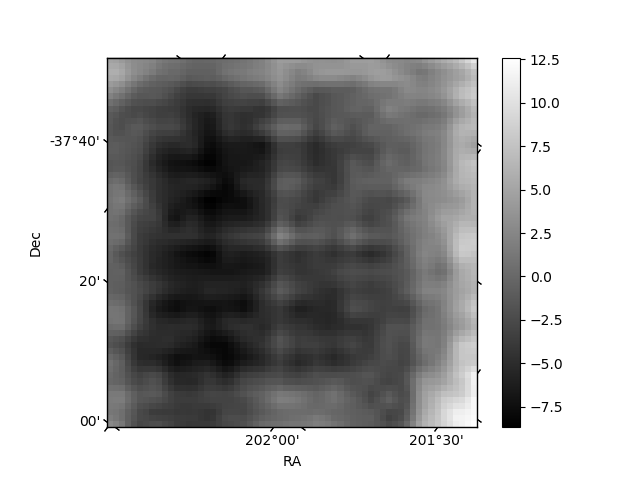
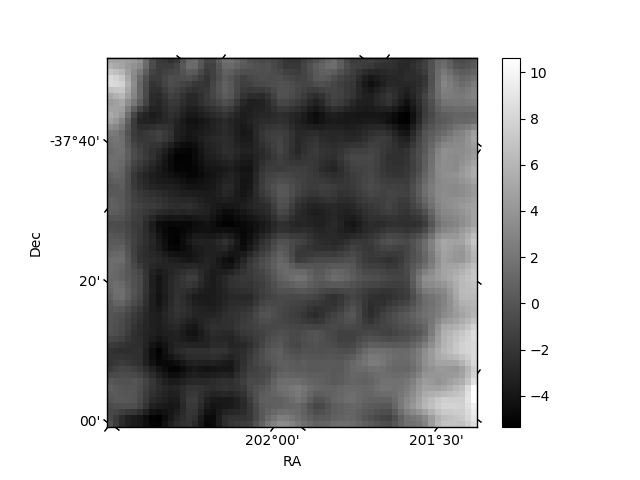
Histogram calculated using DETX and DETY for each event in the final _common_clean file
| Quadrant A | 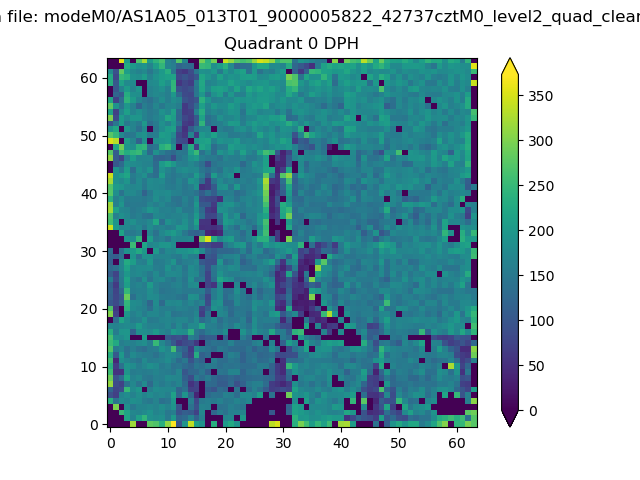 |
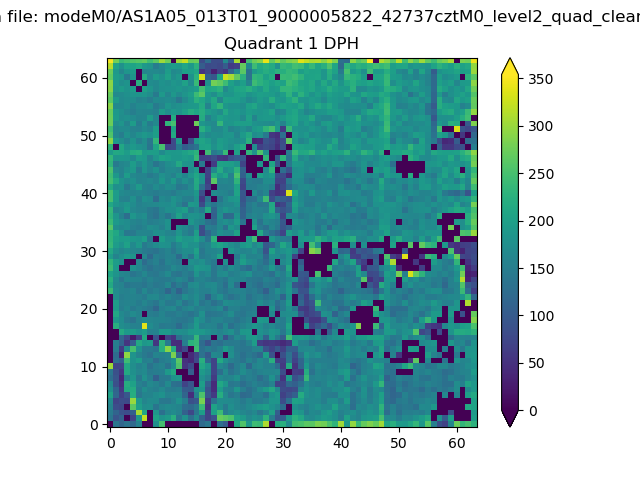 |
Quadrant B |
|---|---|---|---|
| Quadrant D | 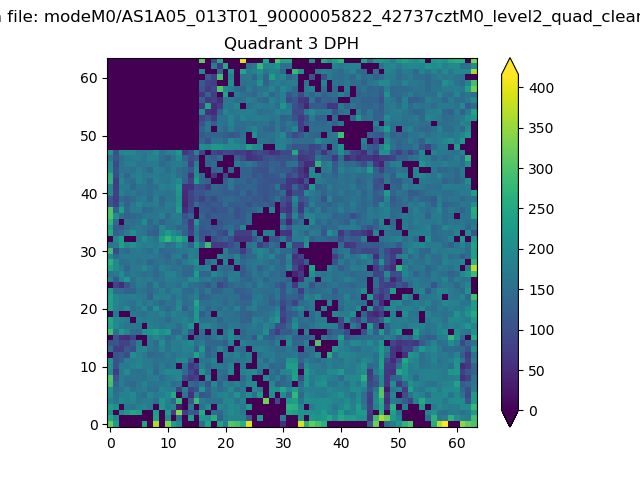 |
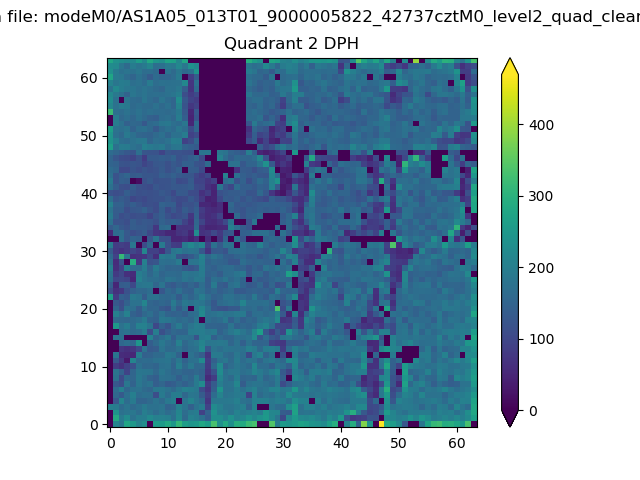 |
Quadrant C |
| Plot type | Count rate plots | Images |
|---|---|---|
| Comparison with Poisson distribution Blue bars denote a histogram of data divided into 1 sec bins. Red curve is a Poisson curve with rate = median count rate of data. |
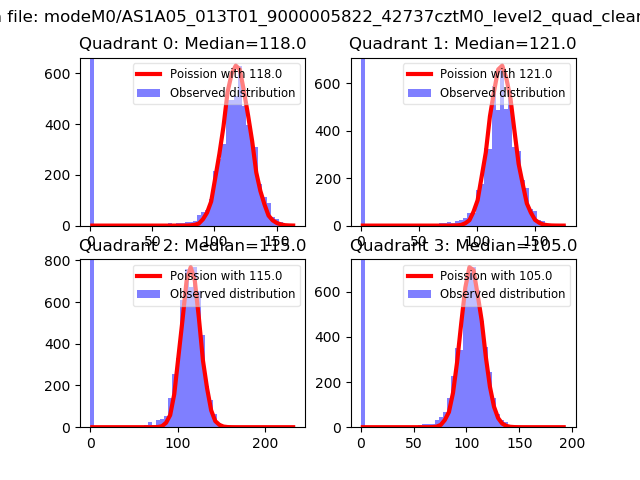 |
 |
| Quadrant-wise count rates Data is divided into 100 sec bins |
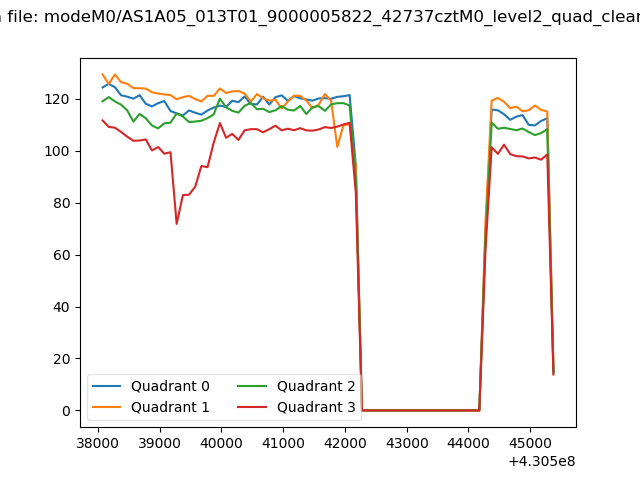 |
|
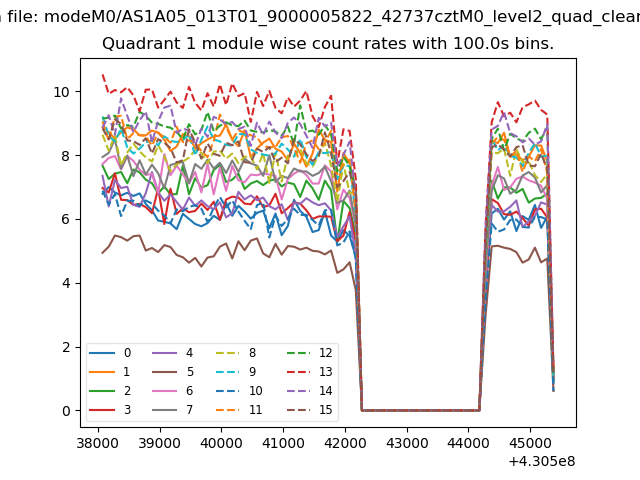
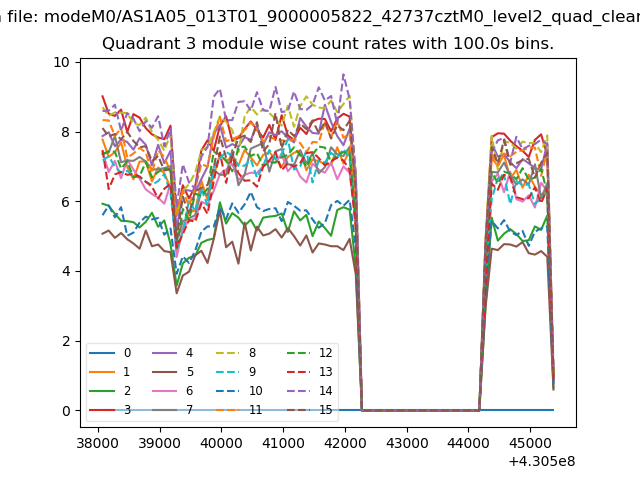
| Module-wise count rates for Quadrant A Data is divided into 100 sec bins |
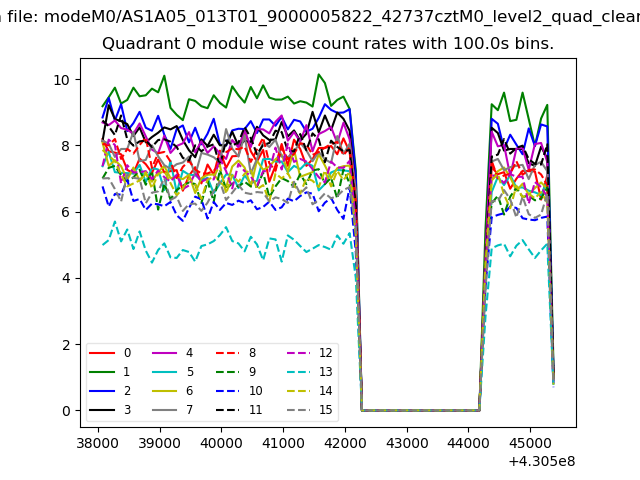 |
 |
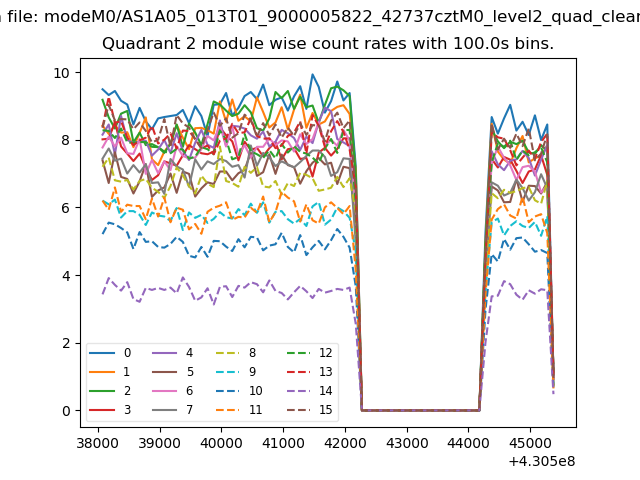
| Module-wise count rates for Quadrant B Data is divided into 100 sec bins |
 |
 |
| Module-wise count rates for Quadrant C Data is divided into 100 sec bins |
 |
 |
| Module-wise count rates for Quadrant D Data is divided into 100 sec bins |
 |
 |
| Parameter | Plot |
|---|---|
| CZT HV Monitor | 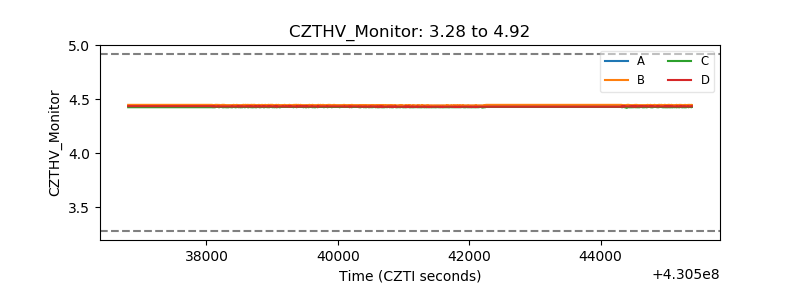 |
| D_VDD | 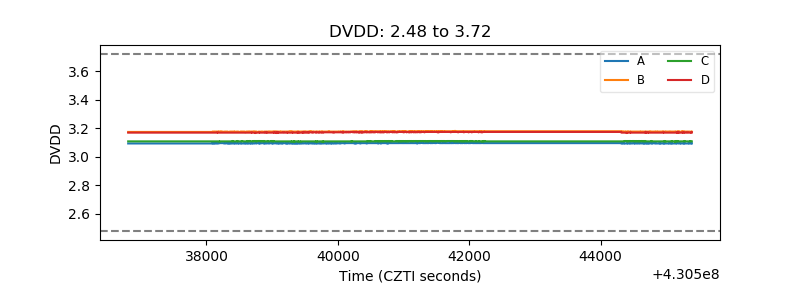 |
| Temperature 1 | 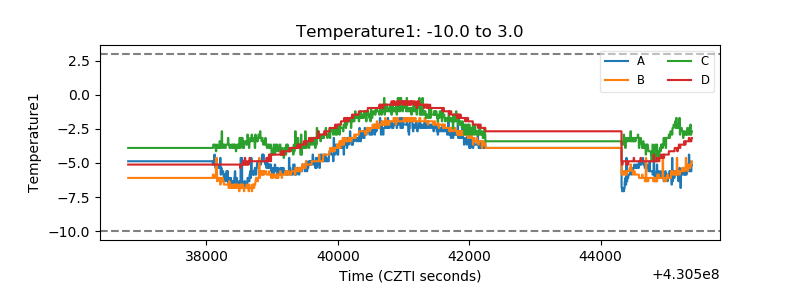 |
| Veto HV Monitor | 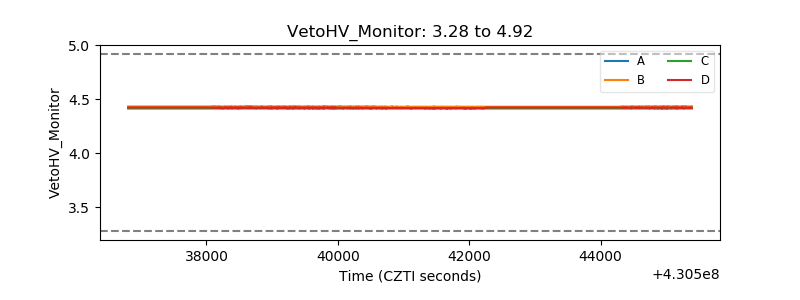 |
| Veto LLD |  |
| Alpha Counter | 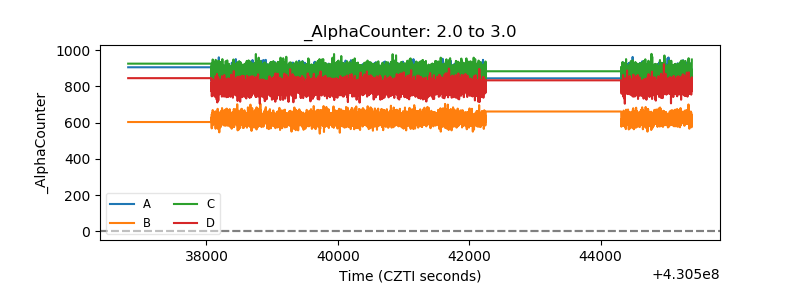 |
| _CPM_Rate | 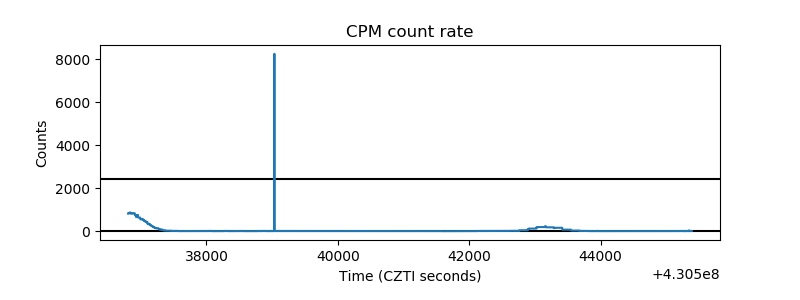 |
| CZT Counter | 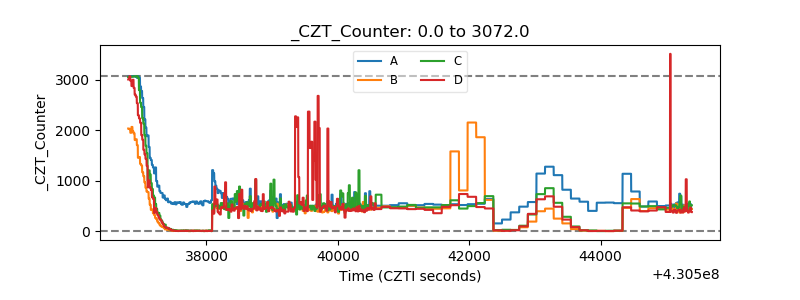 |
| +2.5 Volts monitor | 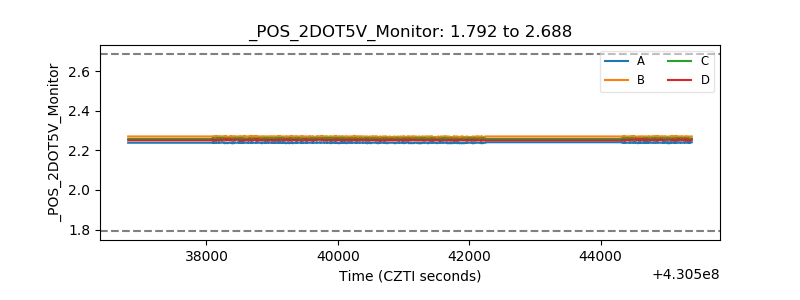 |
| +5 Volts monitor | 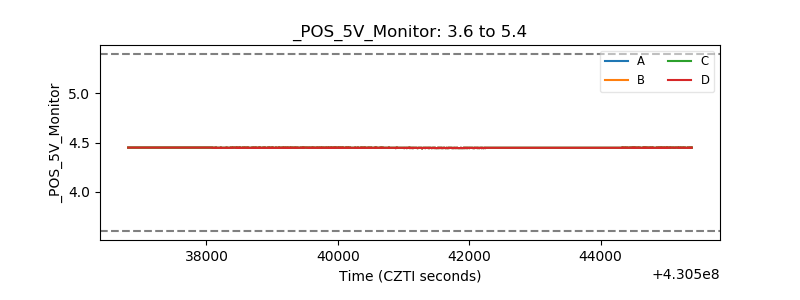 |
| _ROLL_ROT | 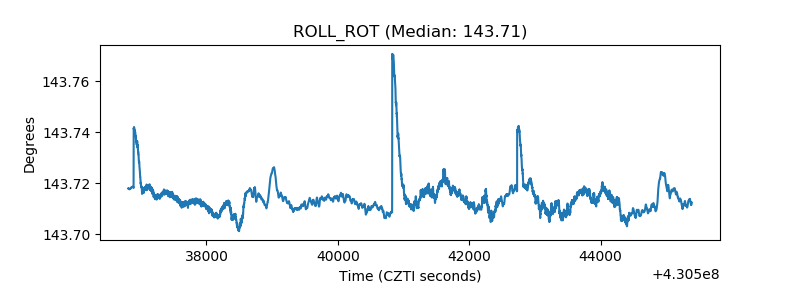 |
| _Roll_DEC | 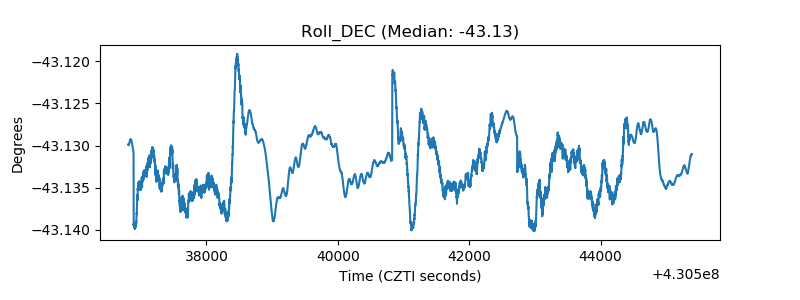 |
| _Roll_RA | 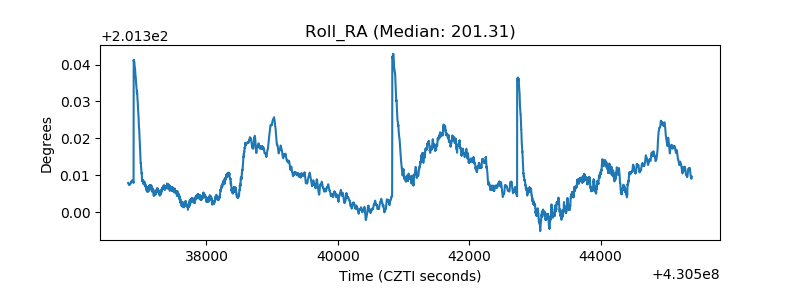 |
| Veto Counter | 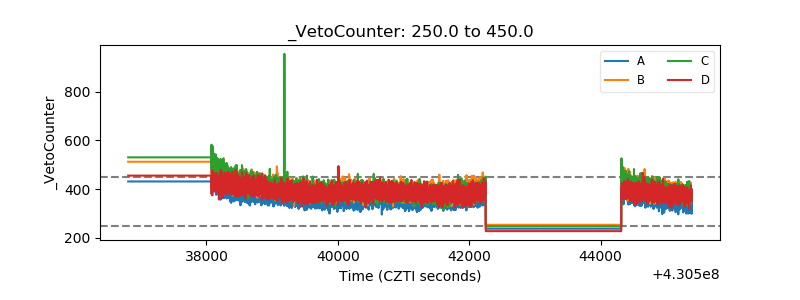 |