| Param | Original file | Final file |
|---|---|---|
| Filename | modeM0/AS1A05_013T01_9000005822_42738cztM0_level2.fits | modeM0/AS1A05_013T01_9000005822_42738cztM0_level2_quad_clean.evt |
| Size (bytes) | 305,233,920 | 89,441,280 |
| Size | 291.1 MB | 85.3 MB |
| Events in quadrant A | 3,005,412 | 601,840 |
| Events in quadrant B | 2,581,299 | 611,572 |
| Events in quadrant C | 2,739,756 | 585,650 |
| Events in quadrant D | 2,557,747 | 536,957 |
| Mode M0 | |||
|---|---|---|---|
| Quadrant | BADHDUFLAG | Total packets | Discarded packets |
| A | 0 | 11972 | 2 |
| B | 0 | 11320 | 2 |
| C | 0 | 11328 | 2 |
| D | 0 | 11433 | 2 |
| Mode M9 | |||
|---|---|---|---|
| Quadrant | BADHDUFLAG | Total packets | Discarded packets |
| A | 0 | 27 | 0 |
| B | 0 | 28 | 0 |
| C | 0 | 28 | 0 |
| D | 0 | 28 | 0 |
| Mode SS | |||
|---|---|---|---|
| Quadrant | BADHDUFLAG | Total packets | Discarded packets |
| A | 0 | 108 | 0 |
| B | 0 | 108 | 0 |
| C | 0 | 108 | 0 |
| D | 0 | 108 | 0 |
| Quadrant | Total seconds | Saturated seconds | Saturation percentage |
|---|---|---|---|
| A | 5319 | 17 | 0.319609% |
| B | 5319 | 56 | 1.052829% |
| C | 5319 | 18 | 0.338409% |
| D | 5319 | 41 | 0.770822% |
Noise dominated data is calculated using 1-second bins in cleaned event files. If a bin has >2000 counts, and if more than 50% of those come from <1% of pixels, then it is considered to be noise-dominated and hence unusable.
| Quadrant | # 1 sec bins | Bins with >0 counts | Bins with >2000 counts | High rate bins dominated by noise | Noise dominated (total time) | Noise dominated (detector-on time) | Marked lightcurve |
|---|---|---|---|---|---|---|---|
| A | 7172 | 5320 | 10 | 10 | 0.14% | 0.19% | 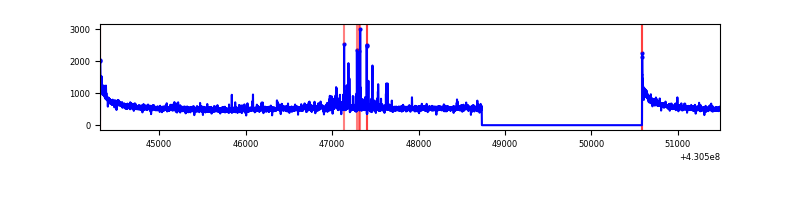 |
| B | 7172 | 5320 | 42 | 42 | 0.59% | 0.79% | 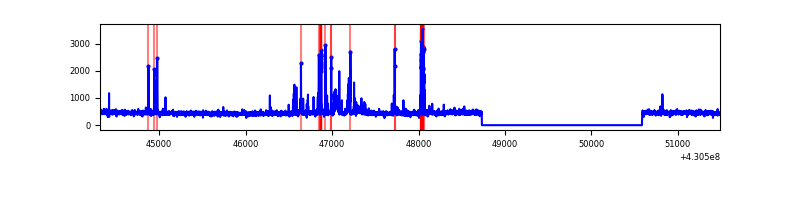 |
| C | 7172 | 5320 | 16 | 16 | 0.22% | 0.30% | 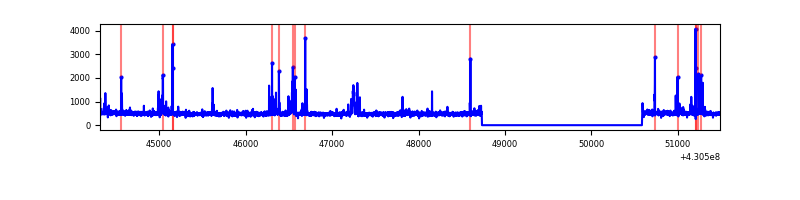 |
| D | 7172 | 5320 | 35 | 35 | 0.49% | 0.66% | 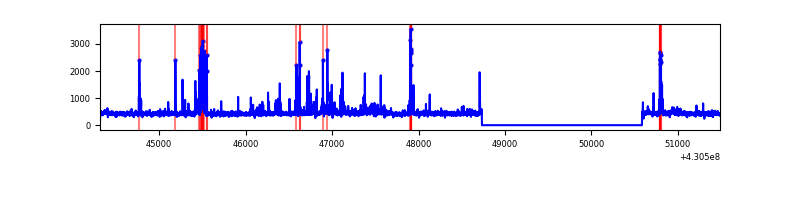 |
Top three noisy pixels from each quadrant. If the there are fewer than three noisy pixels in the level2.evt file, extra rows are filled as -1
| Pixel properties | Quadrant properties | ||||||
|---|---|---|---|---|---|---|---|
| Quadrant | DetID | PixID | Counts | Sigma | Mean | Median | Sigma |
| A | 10 | 83 | 576189 | 4704.91 | 595 | 584 | 122.3 |
| A | 13 | 248 | 79766 | 647.22 | 595 | 584 | 122.3 |
| A | 12 | 189 | 44225 | 356.72 | 595 | 584 | 122.3 |
| B | 5 | 172 | 204865 | 1782.09 | 587 | 571 | 114.6 |
| B | 0 | 230 | 19276 | 163.17 | 587 | 571 | 114.6 |
| B | 0 | 156 | 18189 | 153.69 | 587 | 571 | 114.6 |
| C | 15 | 214 | 225272 | 1659.55 | 579 | 582 | 135.4 |
| C | 14 | 254 | 136503 | 1003.91 | 579 | 582 | 135.4 |
| C | 0 | 239 | 89332 | 655.5 | 579 | 582 | 135.4 |
| D | 13 | 249 | 84475 | 596.78 | 579 | 562 | 140.6 |
| D | 2 | 249 | 74178 | 523.55 | 579 | 562 | 140.6 |
| D | 12 | 6 | 44232 | 310.58 | 579 | 562 | 140.6 |
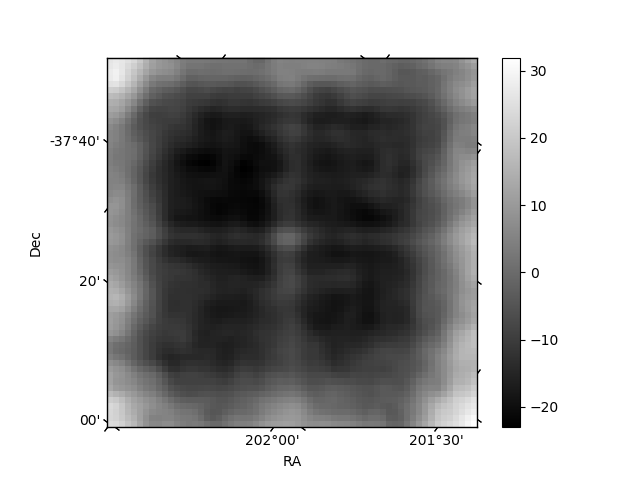
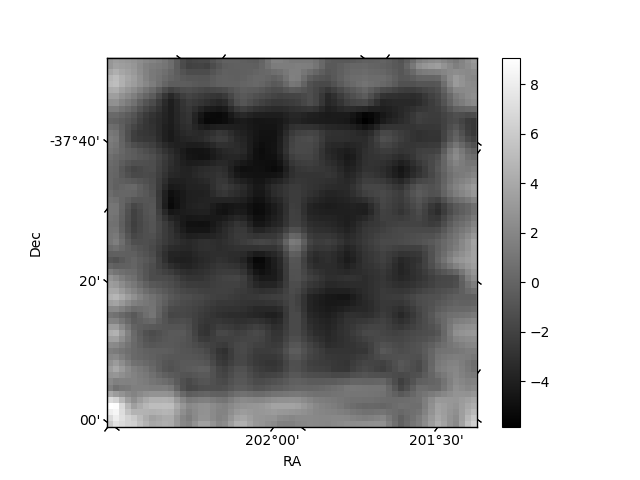
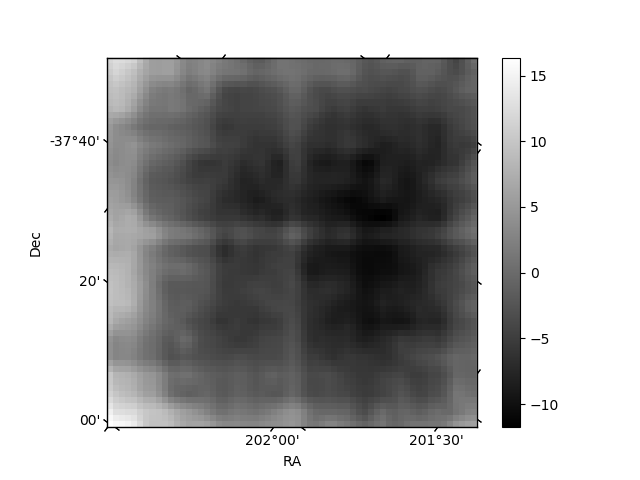
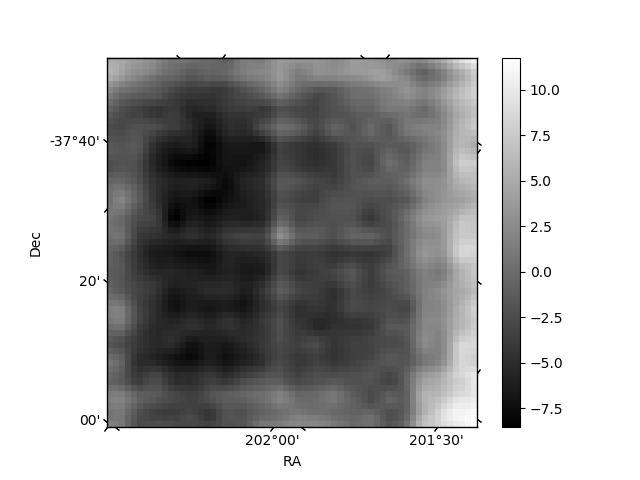
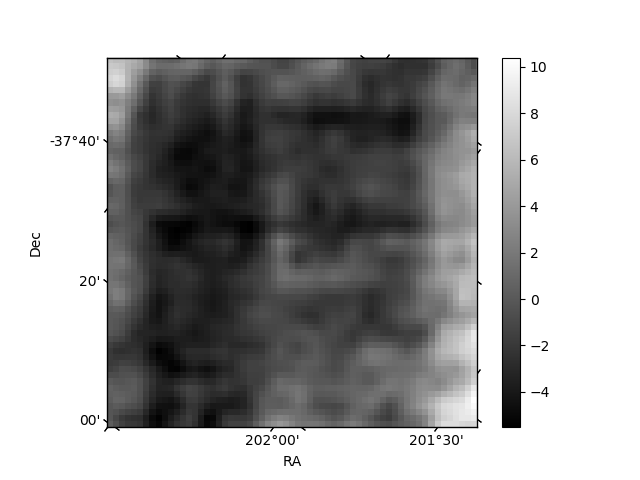
Histogram calculated using DETX and DETY for each event in the final _common_clean file
| Quadrant A | 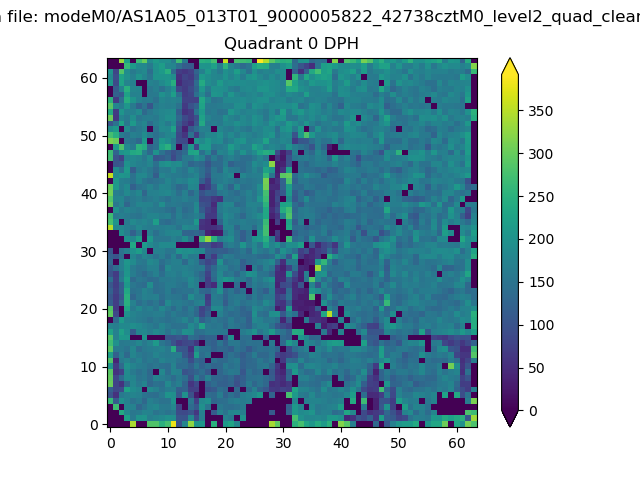 |
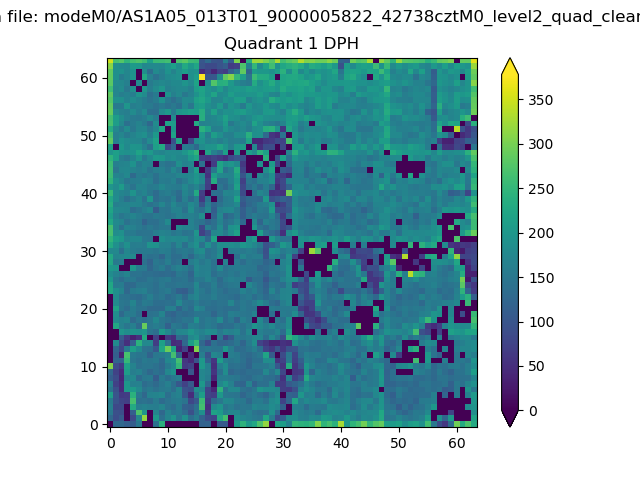 |
Quadrant B |
|---|---|---|---|
| Quadrant D | 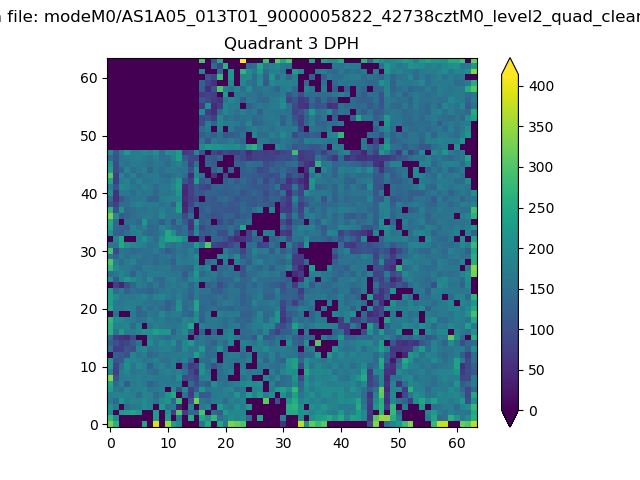 |
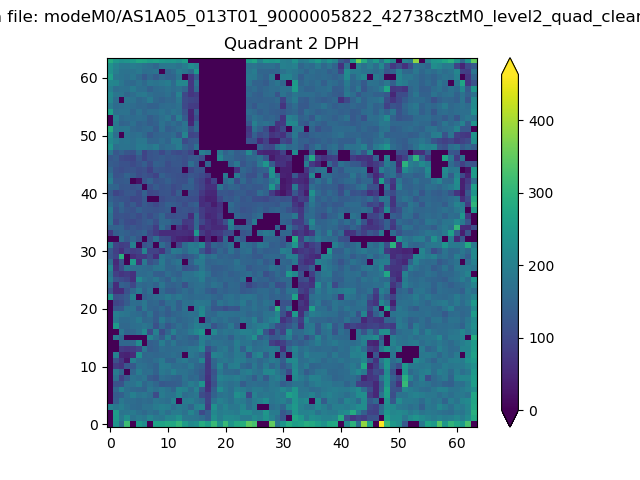 |
Quadrant C |
| Plot type | Count rate plots | Images |
|---|---|---|
| Comparison with Poisson distribution Blue bars denote a histogram of data divided into 1 sec bins. Red curve is a Poisson curve with rate = median count rate of data. |
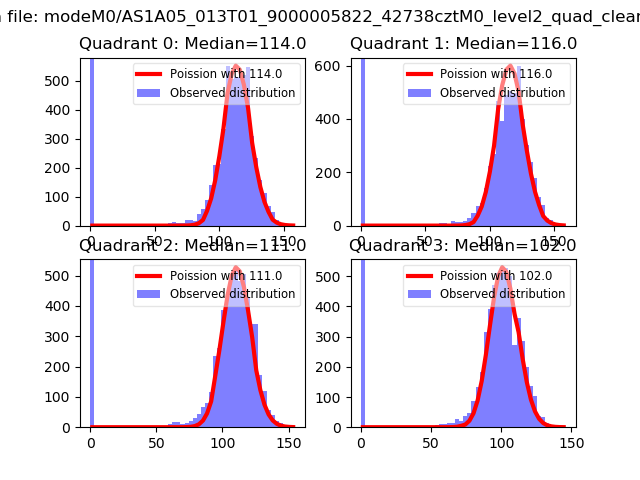 |
 |
| Quadrant-wise count rates Data is divided into 100 sec bins |
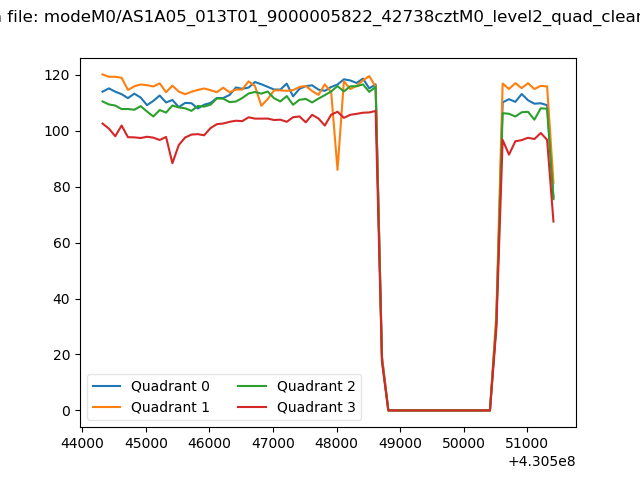 |
|
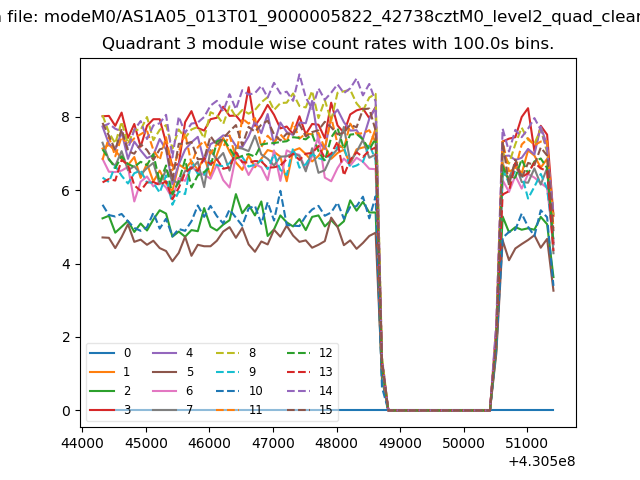
| Module-wise count rates for Quadrant A Data is divided into 100 sec bins |
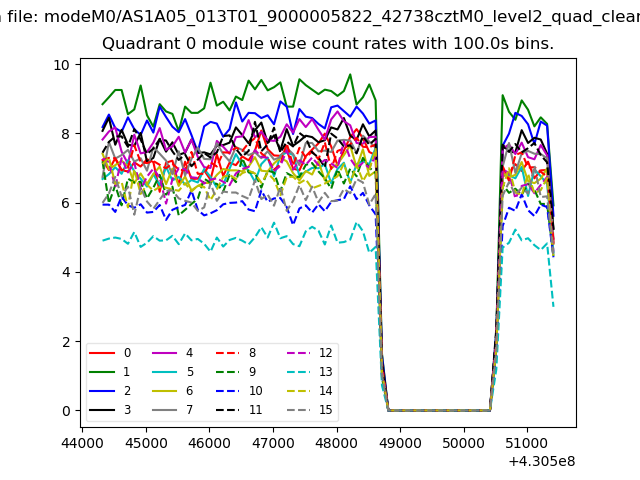 |
 |
| Module-wise count rates for Quadrant B Data is divided into 100 sec bins |
 |
 |
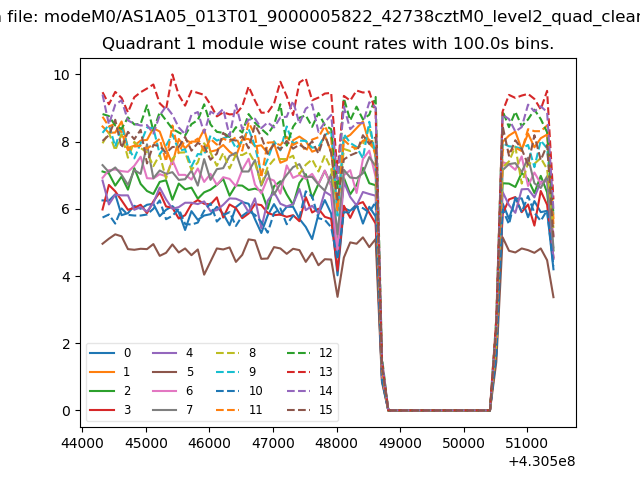
| Module-wise count rates for Quadrant C Data is divided into 100 sec bins |
 |
 |
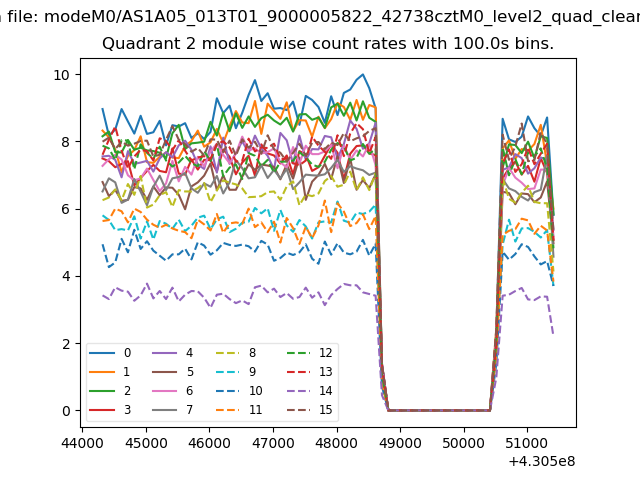
| Module-wise count rates for Quadrant D Data is divided into 100 sec bins |
 |
 |
| Parameter | Plot |
|---|---|
| CZT HV Monitor | 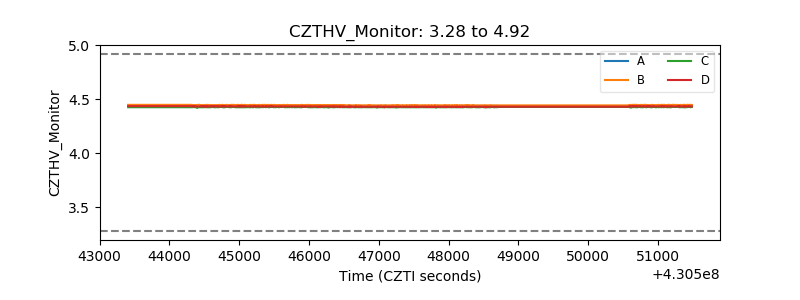 |
| D_VDD | 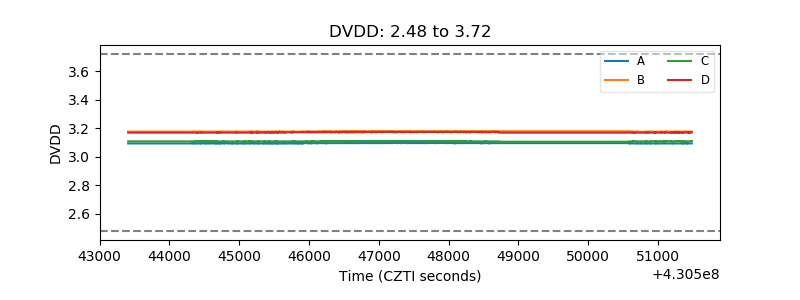 |
| Temperature 1 |  |
| Veto HV Monitor | 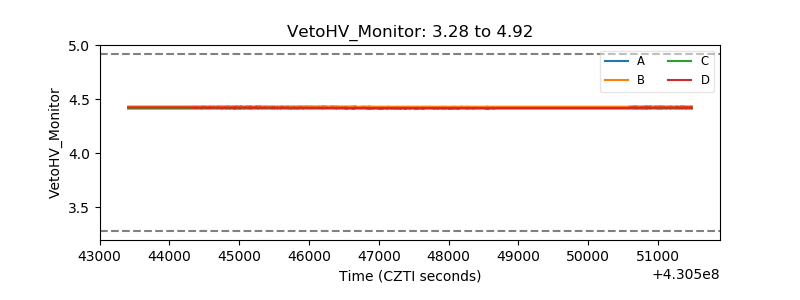 |
| Veto LLD | 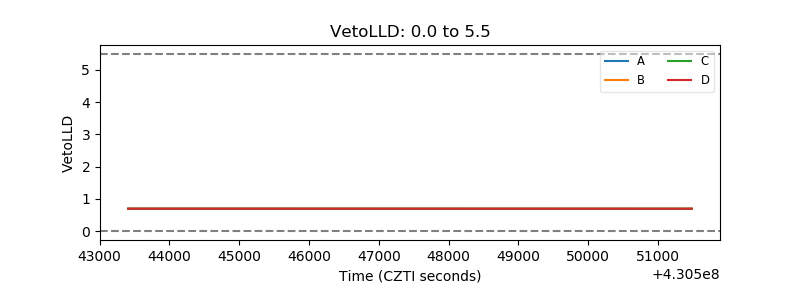 |
| Alpha Counter | 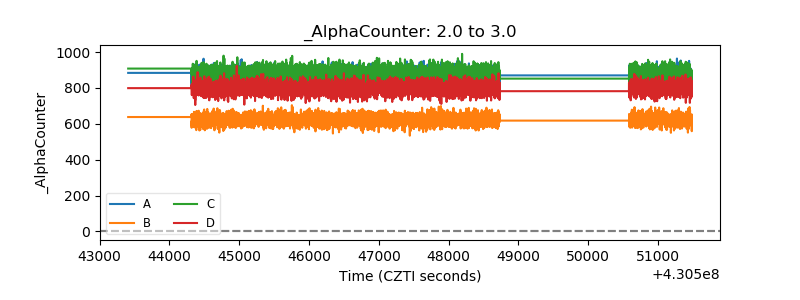 |
| _CPM_Rate | 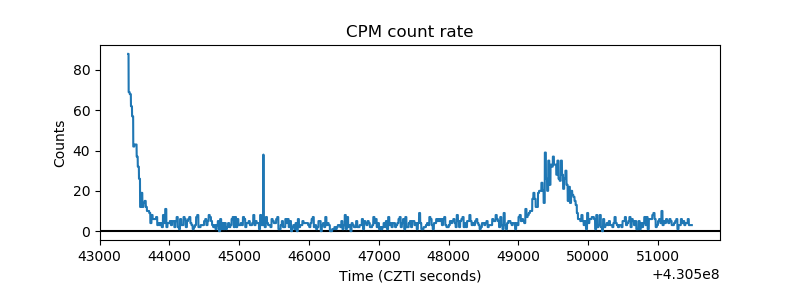 |
| CZT Counter | 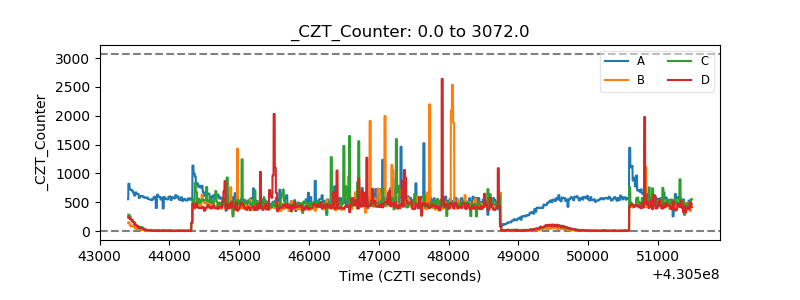 |
| +2.5 Volts monitor | 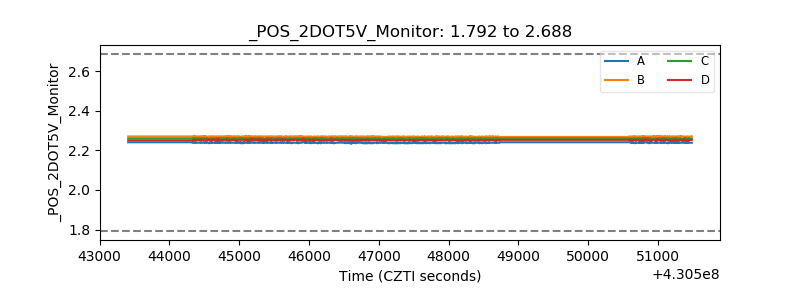 |
| +5 Volts monitor | 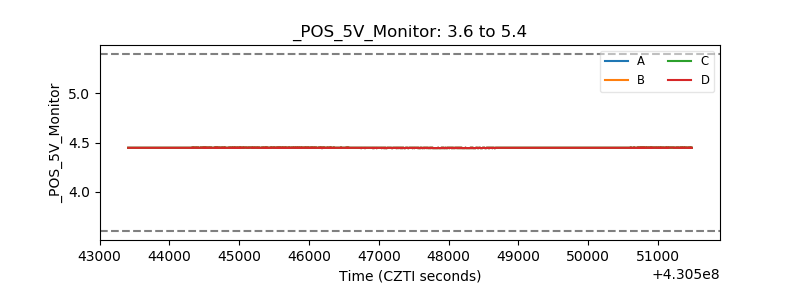 |
| _ROLL_ROT | 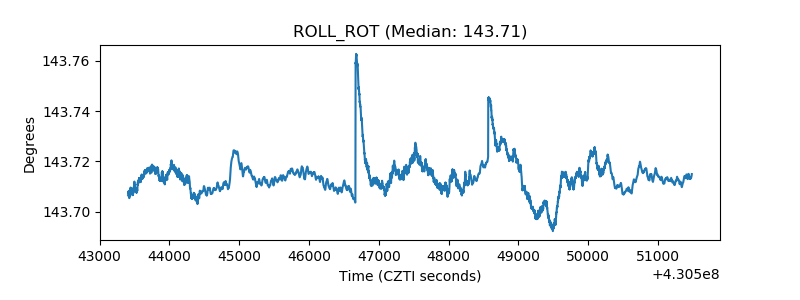 |
| _Roll_DEC | 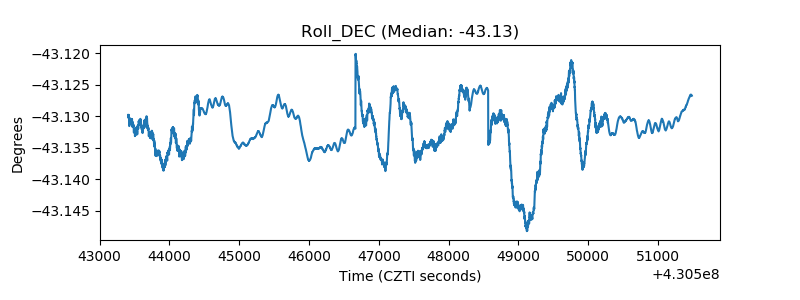 |
| _Roll_RA | 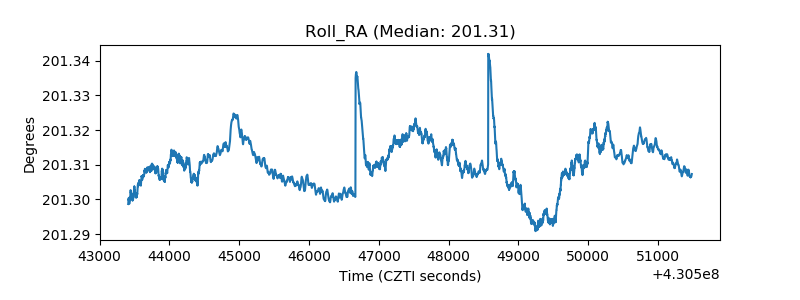 |
| Veto Counter | 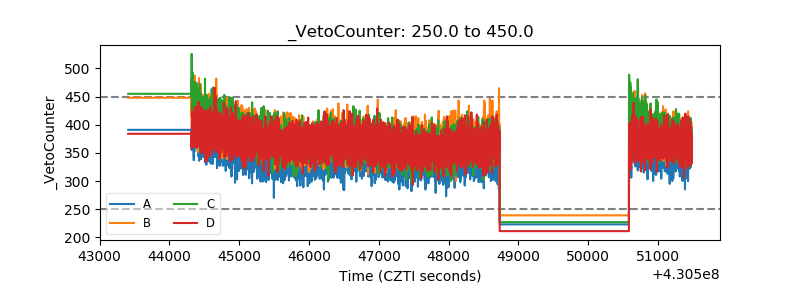 |