| Param | Original file | Final file |
|---|---|---|
| Filename | modeM0/AS1A05_013T01_9000005822_42739cztM0_level2.fits | modeM0/AS1A05_013T01_9000005822_42739cztM0_level2_quad_clean.evt |
| Size (bytes) | 354,657,600 | 91,353,600 |
| Size | 338.2 MB | 87.1 MB |
| Events in quadrant A | 3,123,575 | 623,878 |
| Events in quadrant B | 2,737,314 | 628,643 |
| Events in quadrant C | 4,259,437 | 556,648 |
| Events in quadrant D | 2,570,607 | 564,027 |
| Mode M0 | |||
|---|---|---|---|
| Quadrant | BADHDUFLAG | Total packets | Discarded packets |
| A | 0 | 12495 | 2 |
| B | 0 | 12027 | 2 |
| C | 0 | 16135 | 2 |
| D | 0 | 11744 | 2 |
| Mode M9 | |||
|---|---|---|---|
| Quadrant | BADHDUFLAG | Total packets | Discarded packets |
| A | 0 | 17 | 0 |
| B | 0 | 18 | 0 |
| C | 0 | 18 | 0 |
| D | 0 | 18 | 0 |
| Mode SS | |||
|---|---|---|---|
| Quadrant | BADHDUFLAG | Total packets | Discarded packets |
| A | 0 | 116 | 0 |
| B | 0 | 116 | 0 |
| C | 0 | 116 | 0 |
| D | 0 | 116 | 0 |
| Quadrant | Total seconds | Saturated seconds | Saturation percentage |
|---|---|---|---|
| A | 5611 | 25 | 0.445553% |
| B | 5611 | 101 | 1.800036% |
| C | 5611 | 569 | 10.140795% |
| D | 5611 | 19 | 0.338621% |
Noise dominated data is calculated using 1-second bins in cleaned event files. If a bin has >2000 counts, and if more than 50% of those come from <1% of pixels, then it is considered to be noise-dominated and hence unusable.
| Quadrant | # 1 sec bins | Bins with >0 counts | Bins with >2000 counts | High rate bins dominated by noise | Noise dominated (total time) | Noise dominated (detector-on time) | Marked lightcurve |
|---|---|---|---|---|---|---|---|
| A | 7135 | 5612 | 15 | 15 | 0.21% | 0.27% | 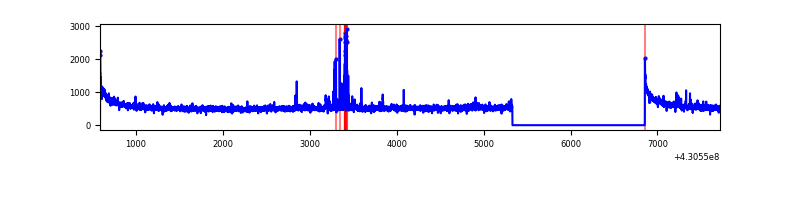 |
| B | 7135 | 5612 | 78 | 78 | 1.09% | 1.39% | 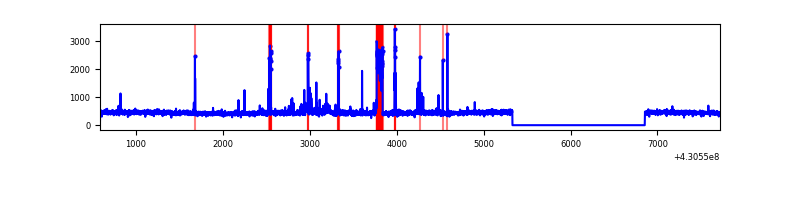 |
| C | 7135 | 5612 | 550 | 550 | 7.71% | 9.80% | 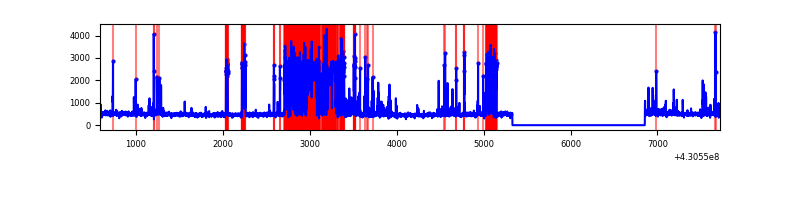 |
| D | 7135 | 5612 | 14 | 14 | 0.20% | 0.25% | 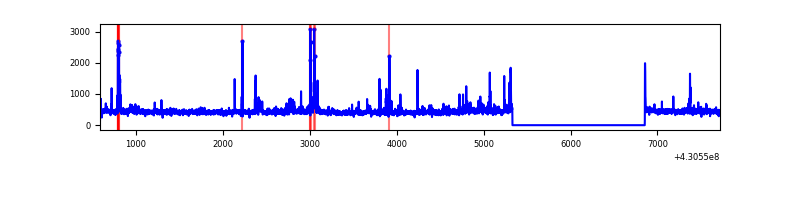 |
Top three noisy pixels from each quadrant. If the there are fewer than three noisy pixels in the level2.evt file, extra rows are filled as -1
| Pixel properties | Quadrant properties | ||||||
|---|---|---|---|---|---|---|---|
| Quadrant | DetID | PixID | Counts | Sigma | Mean | Median | Sigma |
| A | 10 | 83 | 595365 | 4622.6 | 622 | 610 | 128.7 |
| A | 13 | 248 | 73524 | 566.71 | 622 | 610 | 128.7 |
| A | 12 | 189 | 44853 | 343.87 | 622 | 610 | 128.7 |
| B | 5 | 172 | 266243 | 2236.98 | 611 | 594 | 118.8 |
| B | 0 | 230 | 21223 | 173.71 | 611 | 594 | 118.8 |
| B | 12 | 111 | 15087 | 122.04 | 611 | 594 | 118.8 |
| C | 0 | 239 | 1650389 | 12207.78 | 571 | 573 | 135.1 |
| C | 15 | 214 | 225006 | 1660.69 | 571 | 573 | 135.1 |
| C | 14 | 254 | 70918 | 520.52 | 571 | 573 | 135.1 |
| D | 2 | 249 | 45988 | 306.78 | 605 | 588 | 148.0 |
| D | 5 | 171 | 41204 | 274.45 | 605 | 588 | 148.0 |
| D | 12 | 6 | 37555 | 249.79 | 605 | 588 | 148.0 |
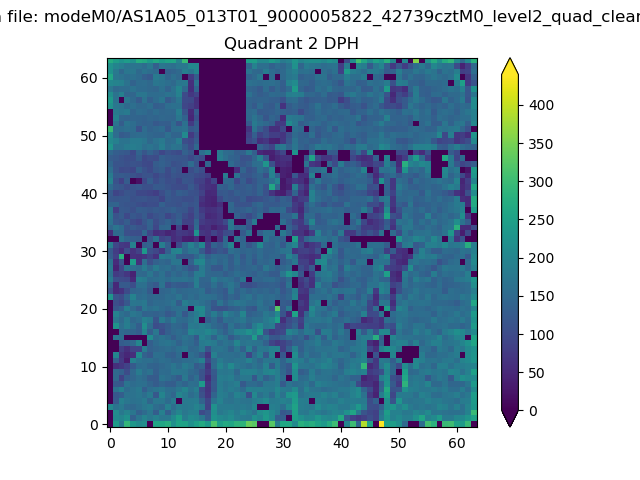
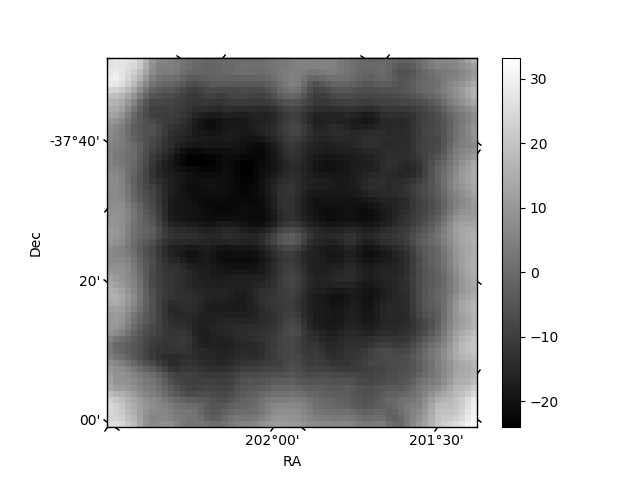
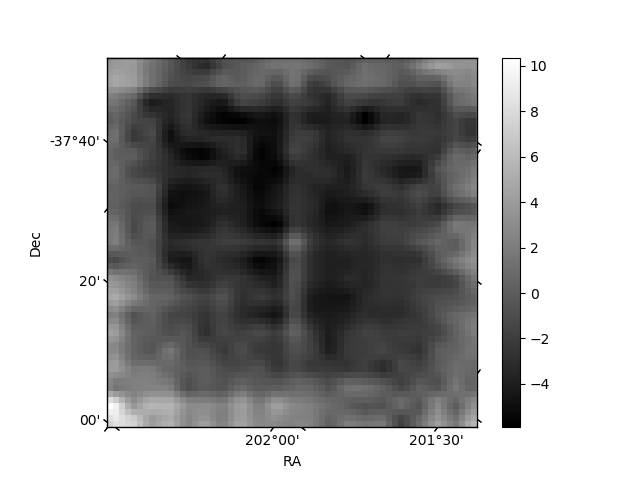
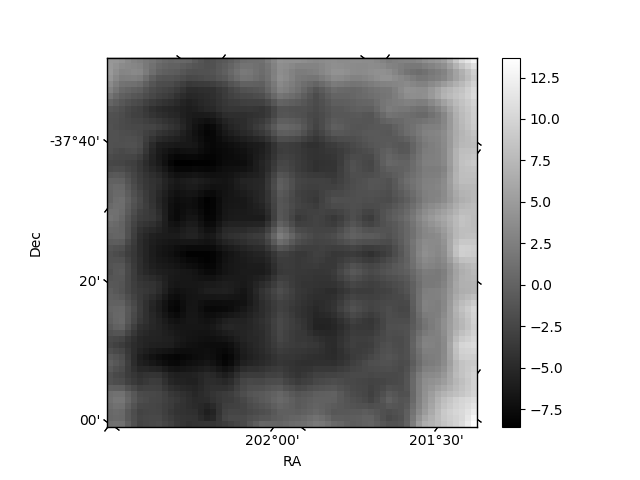
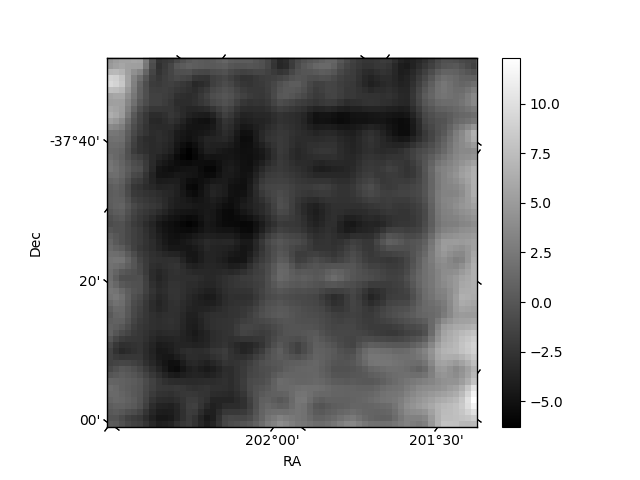
Histogram calculated using DETX and DETY for each event in the final _common_clean file
| Quadrant A | 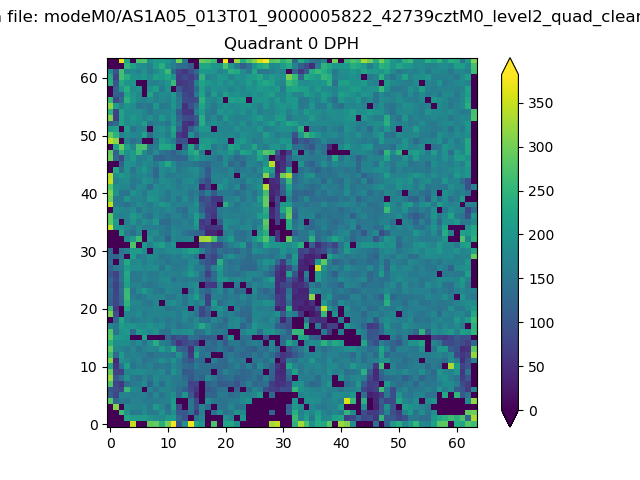 |
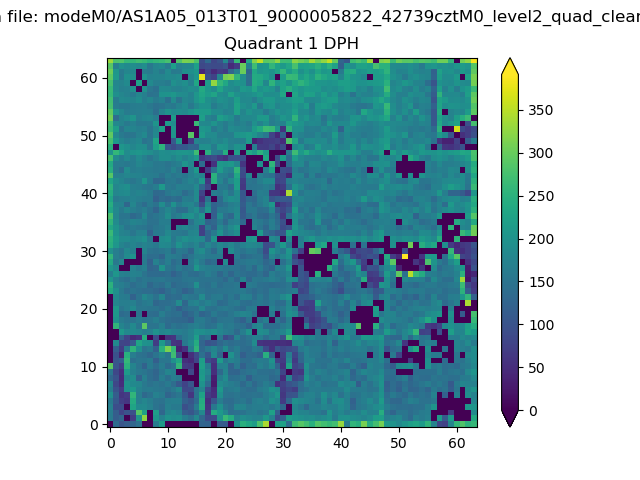 |
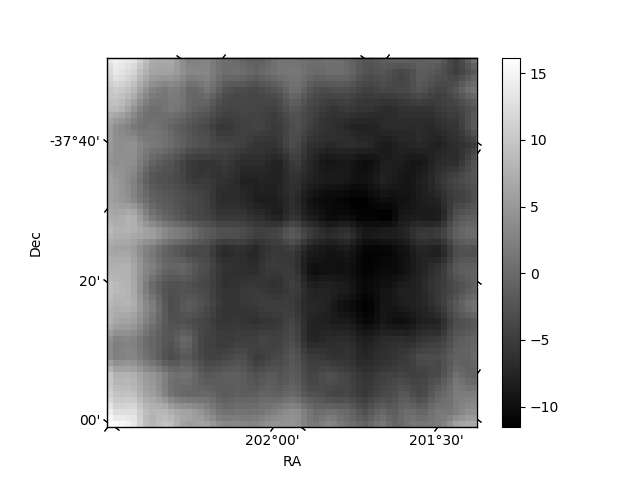
Quadrant B |
|---|---|---|---|
| Quadrant D | 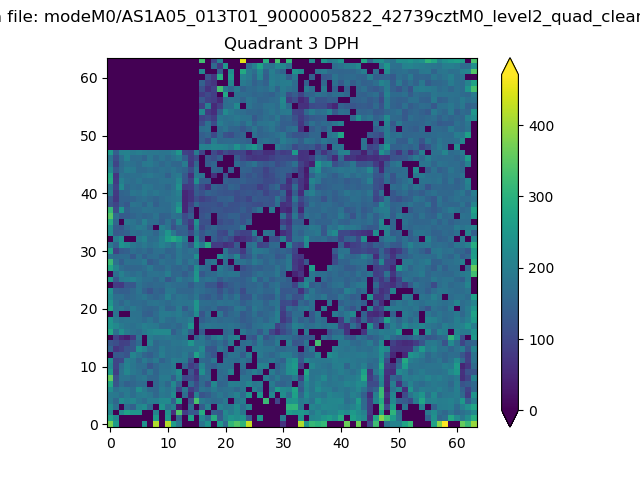 |
 |
Quadrant C |
| Plot type | Count rate plots | Images |
|---|---|---|
| Comparison with Poisson distribution Blue bars denote a histogram of data divided into 1 sec bins. Red curve is a Poisson curve with rate = median count rate of data. |
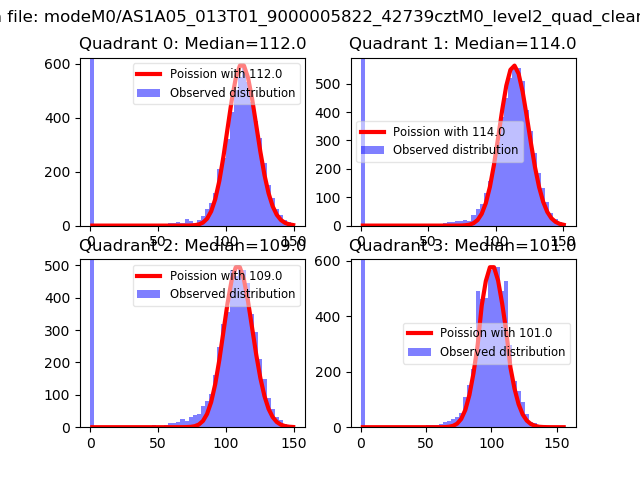 |
 |
| Quadrant-wise count rates Data is divided into 100 sec bins |
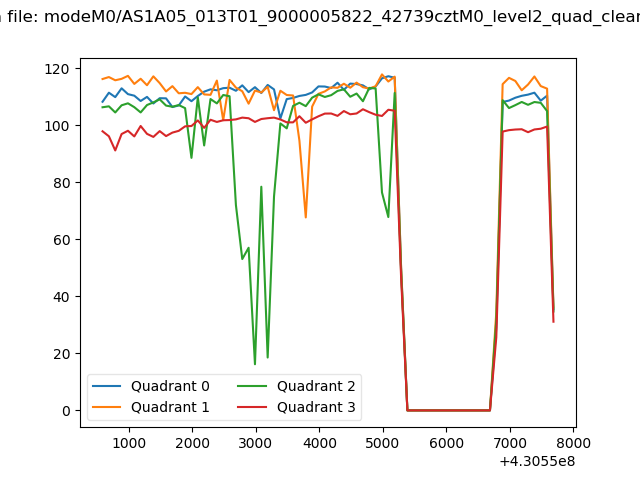 |
|
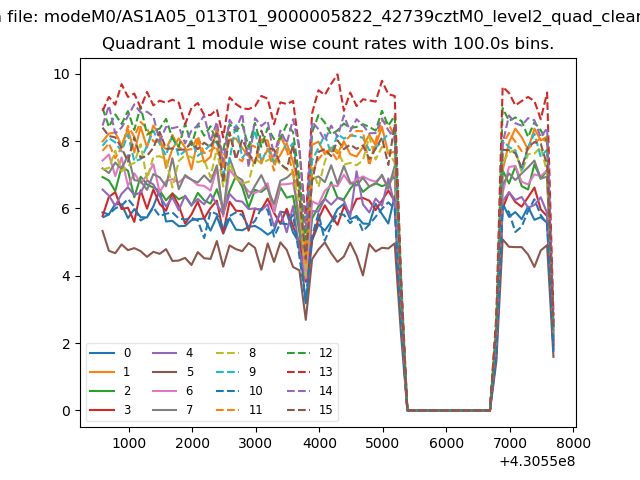
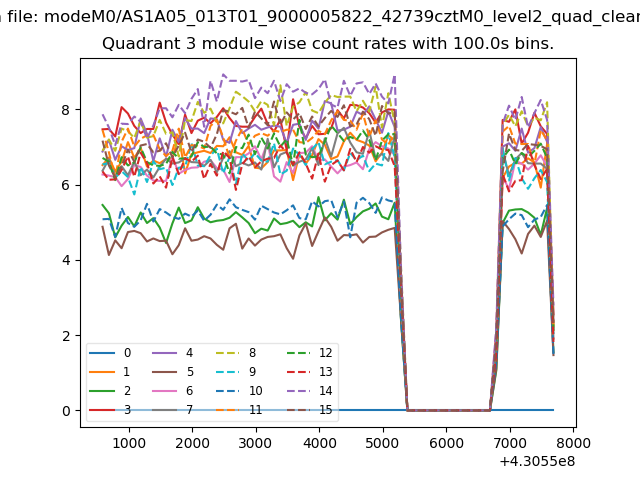
| Module-wise count rates for Quadrant A Data is divided into 100 sec bins |
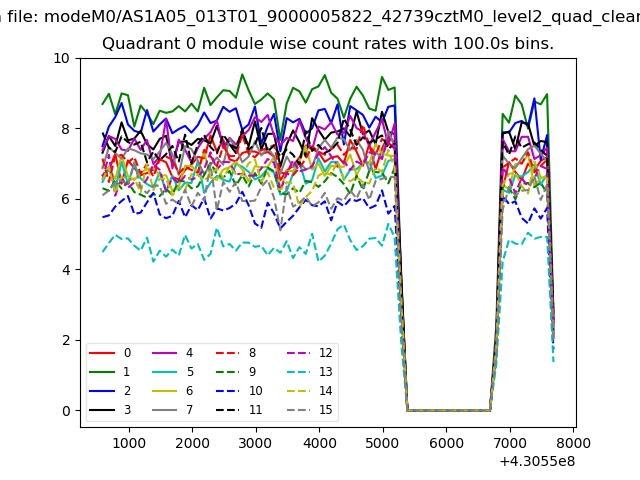 |
 |
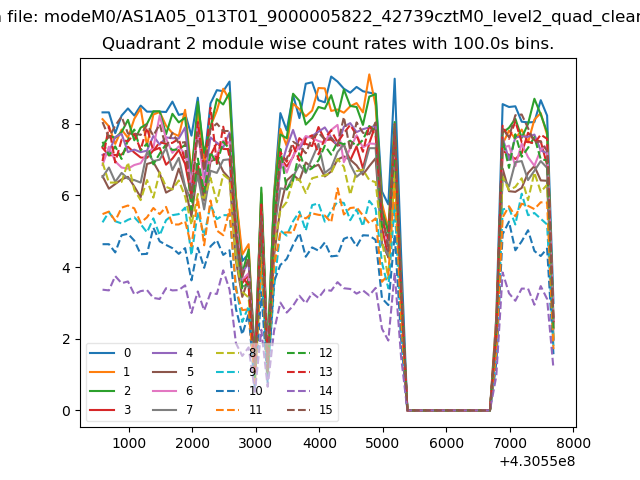
| Module-wise count rates for Quadrant B Data is divided into 100 sec bins |
 |
 |
| Module-wise count rates for Quadrant C Data is divided into 100 sec bins |
 |
 |
| Module-wise count rates for Quadrant D Data is divided into 100 sec bins |
 |
 |
| Parameter | Plot |
|---|---|
| CZT HV Monitor | 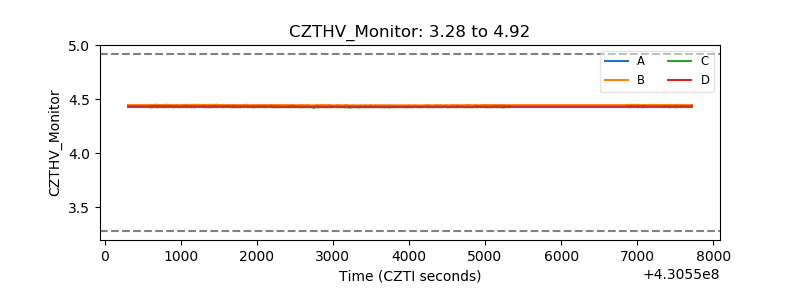 |
| D_VDD | 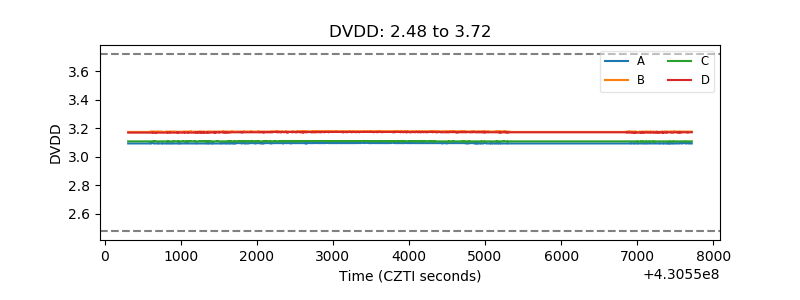 |
| Temperature 1 | 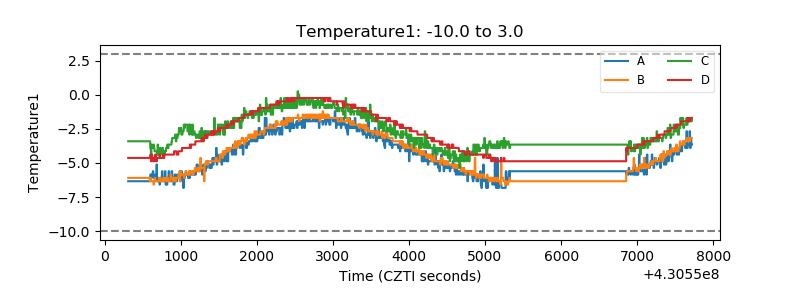 |
| Veto HV Monitor | 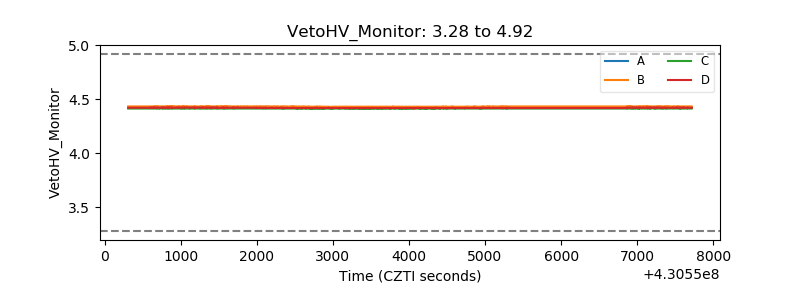 |
| Veto LLD | 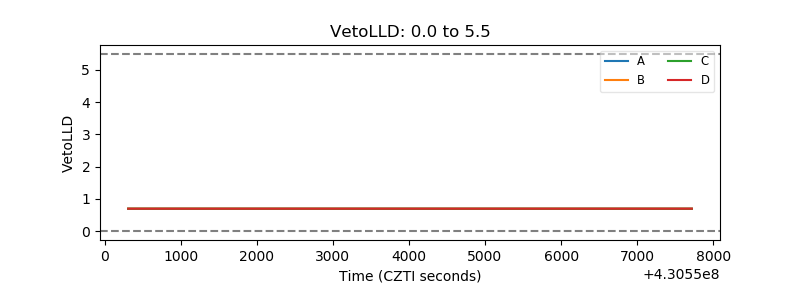 |
| Alpha Counter | 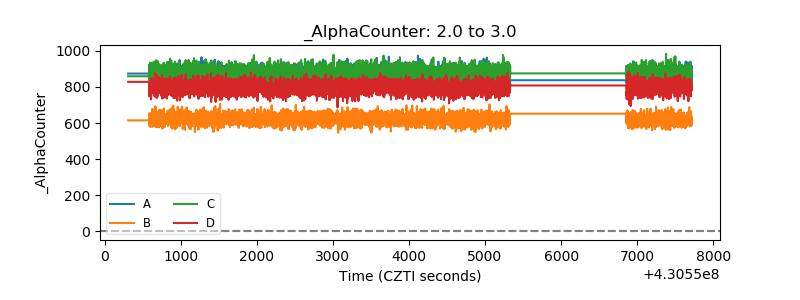 |
| _CPM_Rate | 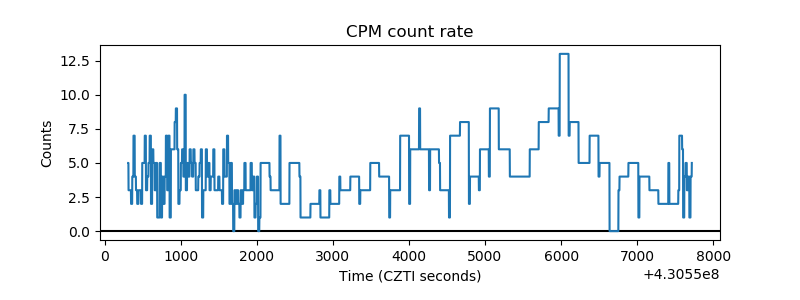 |
| CZT Counter | 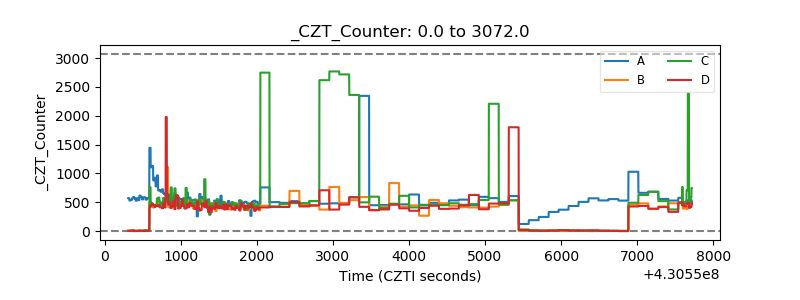 |
| +2.5 Volts monitor | 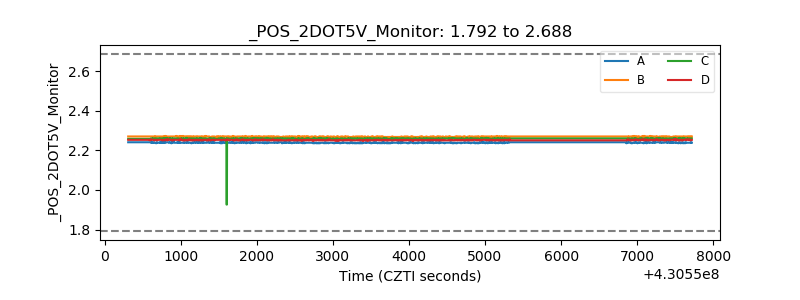 |
| +5 Volts monitor | 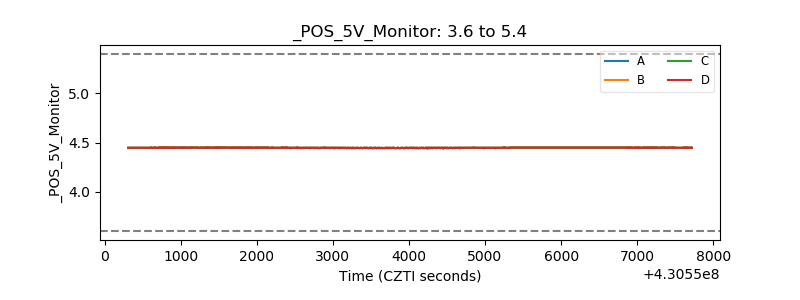 |
| _ROLL_ROT | 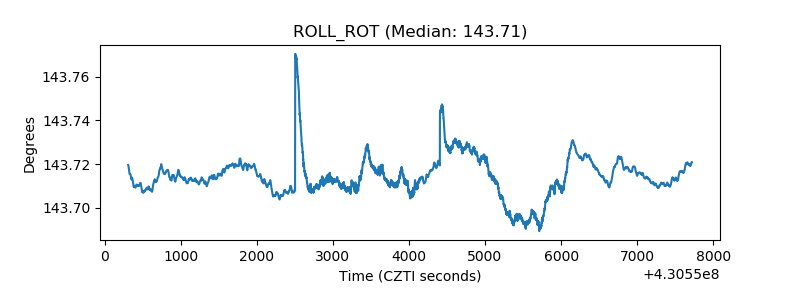 |
| _Roll_DEC |  |
| _Roll_RA | 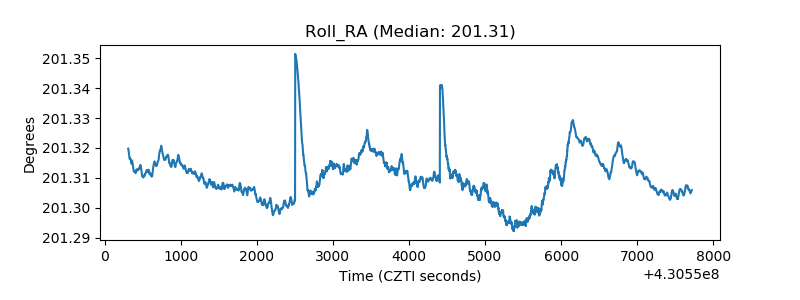 |
| Veto Counter | 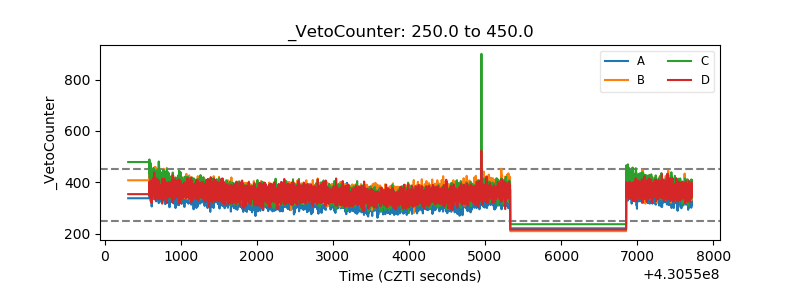 |