| Param | Original file | Final file |
|---|---|---|
| Filename | modeM0/AS1A05_013T01_9000005822_42740cztM0_level2.fits | modeM0/AS1A05_013T01_9000005822_42740cztM0_level2_quad_clean.evt |
| Size (bytes) | 391,786,560 | 95,927,040 |
| Size | 373.6 MB | 91.5 MB |
| Events in quadrant A | 3,290,558 | 654,778 |
| Events in quadrant B | 2,947,533 | 656,959 |
| Events in quadrant C | 5,078,231 | 585,012 |
| Events in quadrant D | 2,725,311 | 593,806 |
| Mode M0 | |||
|---|---|---|---|
| Quadrant | BADHDUFLAG | Total packets | Discarded packets |
| A | 0 | 13125 | 2 |
| B | 0 | 12882 | 2 |
| C | 0 | 18966 | 2 |
| D | 0 | 12397 | 2 |
| Mode M9 | |||
|---|---|---|---|
| Quadrant | BADHDUFLAG | Total packets | Discarded packets |
| A | 0 | 19 | 0 |
| B | 0 | 20 | 0 |
| C | 0 | 20 | 0 |
| D | 0 | 20 | 0 |
| Mode SS | |||
|---|---|---|---|
| Quadrant | BADHDUFLAG | Total packets | Discarded packets |
| A | 0 | 120 | 0 |
| B | 0 | 120 | 0 |
| C | 0 | 120 | 0 |
| D | 0 | 120 | 0 |
| Quadrant | Total seconds | Saturated seconds | Saturation percentage |
|---|---|---|---|
| A | 5925 | 13 | 0.219409% |
| B | 5925 | 79 | 1.333333% |
| C | 5925 | 589 | 9.940928% |
| D | 5924 | 26 | 0.438893% |
Noise dominated data is calculated using 1-second bins in cleaned event files. If a bin has >2000 counts, and if more than 50% of those come from <1% of pixels, then it is considered to be noise-dominated and hence unusable.
| Quadrant | # 1 sec bins | Bins with >0 counts | Bins with >2000 counts | High rate bins dominated by noise | Noise dominated (total time) | Noise dominated (detector-on time) | Marked lightcurve |
|---|---|---|---|---|---|---|---|
| A | 7268 | 5926 | 3 | 3 | 0.04% | 0.05% | 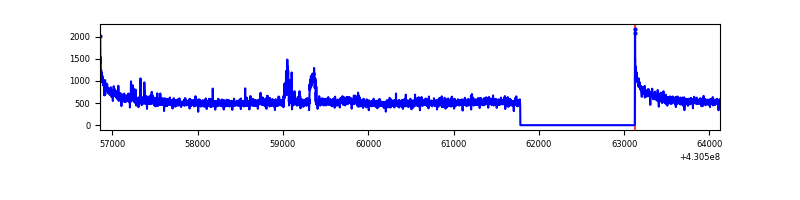 |
| B | 7268 | 5926 | 57 | 57 | 0.78% | 0.96% | 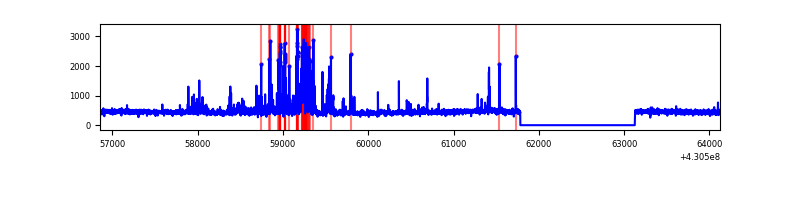 |
| C | 7268 | 5926 | 561 | 561 | 7.72% | 9.47% | 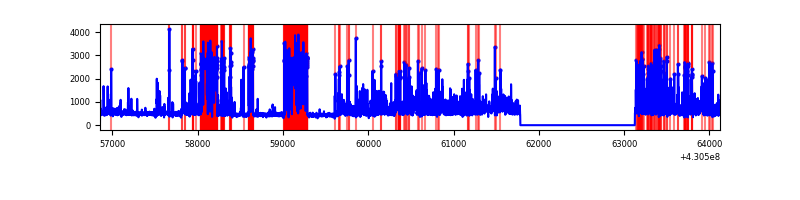 |
| D | 7267 | 5925 | 21 | 21 | 0.29% | 0.35% | 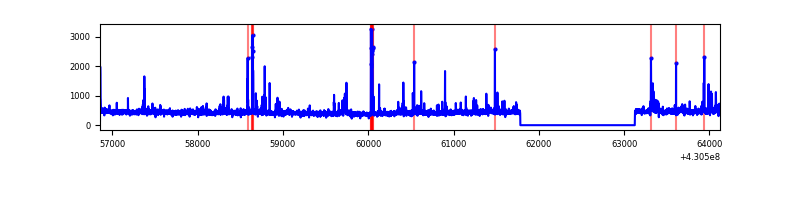 |
Top three noisy pixels from each quadrant. If the there are fewer than three noisy pixels in the level2.evt file, extra rows are filled as -1
| Pixel properties | Quadrant properties | ||||||
|---|---|---|---|---|---|---|---|
| Quadrant | DetID | PixID | Counts | Sigma | Mean | Median | Sigma |
| A | 10 | 83 | 628630 | 4622.29 | 657 | 643 | 135.9 |
| A | 12 | 189 | 85122 | 621.81 | 657 | 643 | 135.9 |
| A | 13 | 6 | 25878 | 185.74 | 657 | 643 | 135.9 |
| B | 5 | 172 | 235405 | 1875.1 | 644 | 625 | 125.2 |
| B | 15 | 85 | 93684 | 743.23 | 644 | 625 | 125.2 |
| B | 12 | 18 | 30223 | 236.39 | 644 | 625 | 125.2 |
| C | 0 | 239 | 2280782 | 15908.9 | 608 | 610 | 143.3 |
| C | 15 | 214 | 239745 | 1668.46 | 608 | 610 | 143.3 |
| C | 4 | 254 | 164685 | 1144.76 | 608 | 610 | 143.3 |
| D | 12 | 233 | 67637 | 424.1 | 643 | 624 | 158.0 |
| D | 1 | 47 | 44271 | 276.22 | 643 | 624 | 158.0 |
| D | 9 | 19 | 35015 | 217.65 | 643 | 624 | 158.0 |
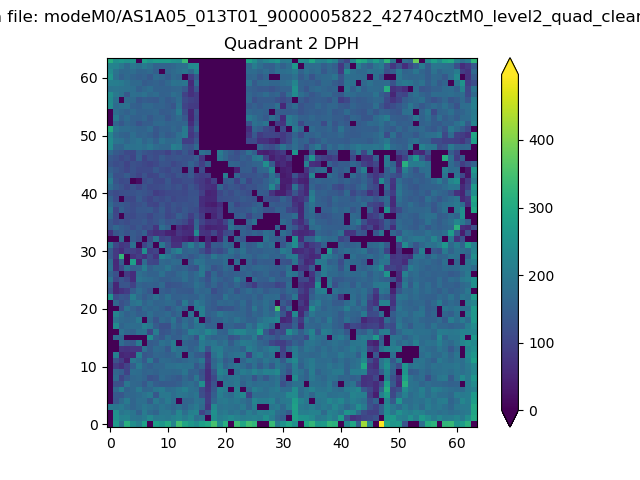
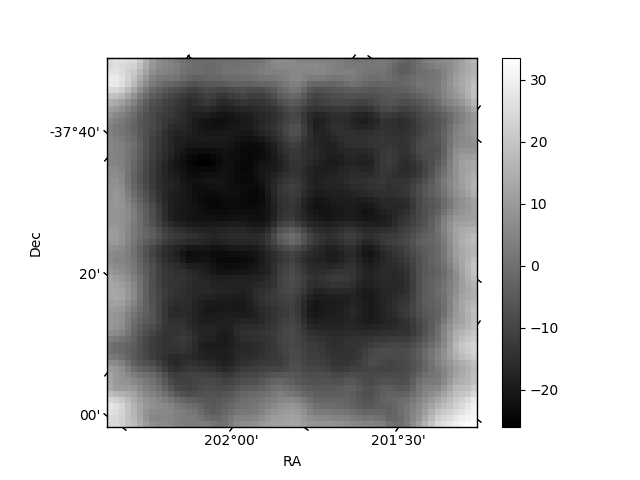
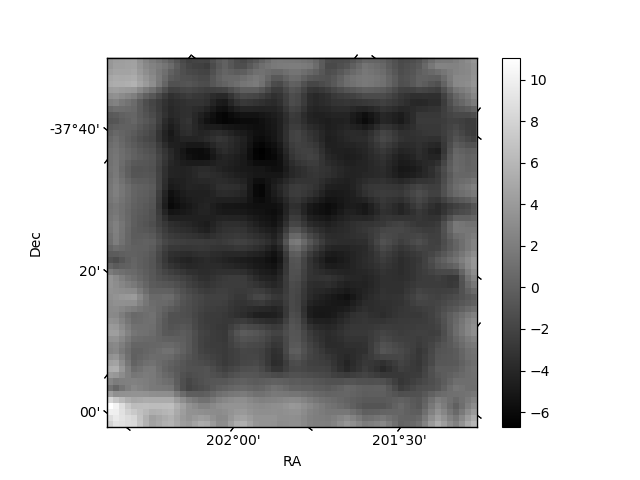
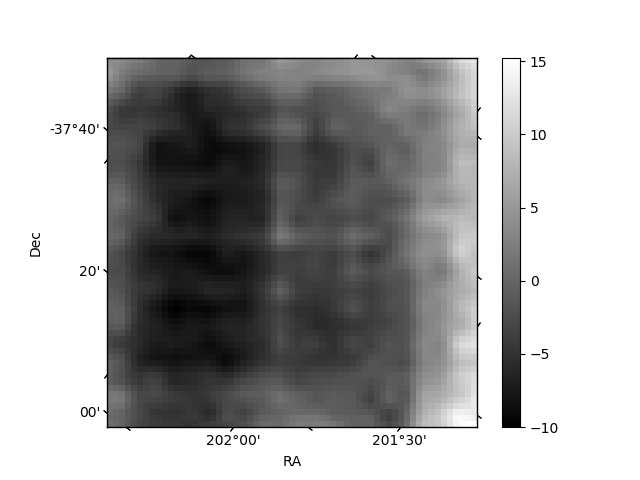
Histogram calculated using DETX and DETY for each event in the final _common_clean file
| Quadrant A | 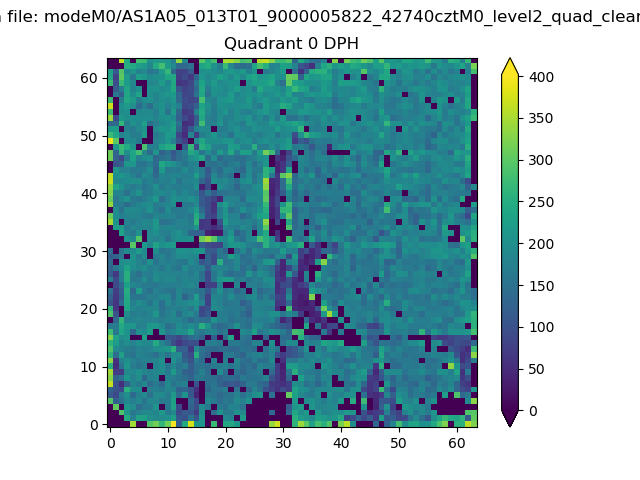 |
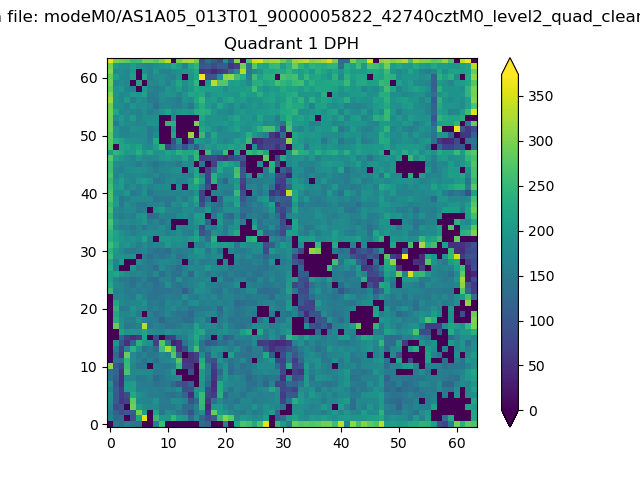 |
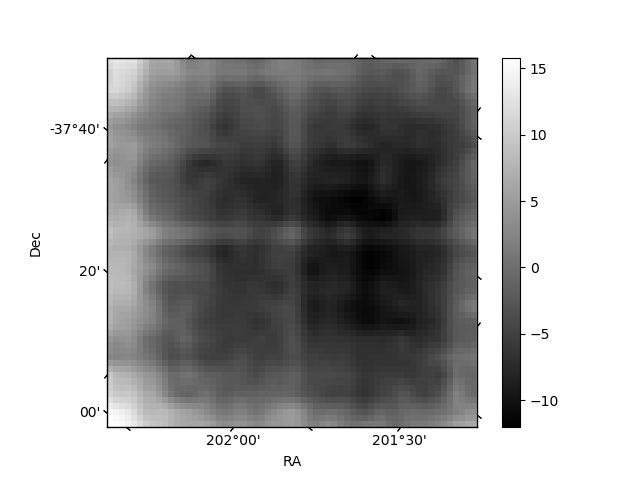
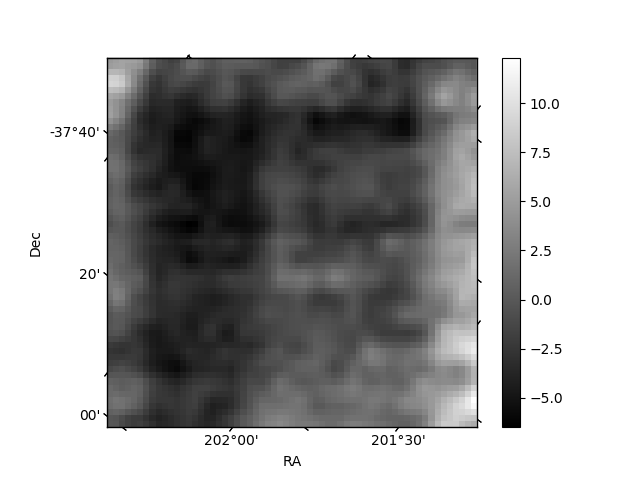
Quadrant B |
|---|---|---|---|
| Quadrant D | 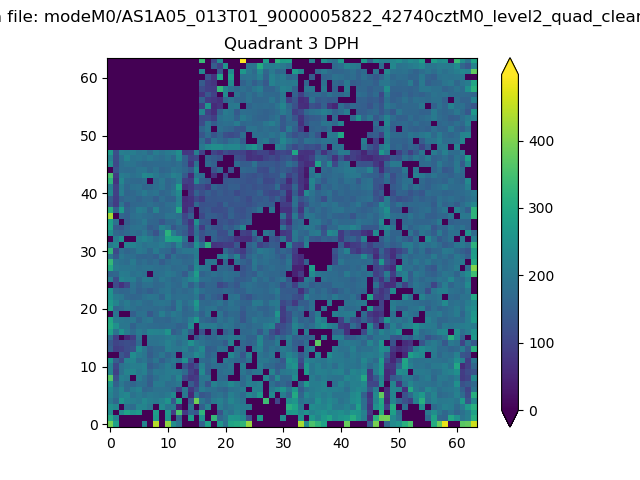 |
 |
Quadrant C |
| Plot type | Count rate plots | Images |
|---|---|---|
| Comparison with Poisson distribution Blue bars denote a histogram of data divided into 1 sec bins. Red curve is a Poisson curve with rate = median count rate of data. |
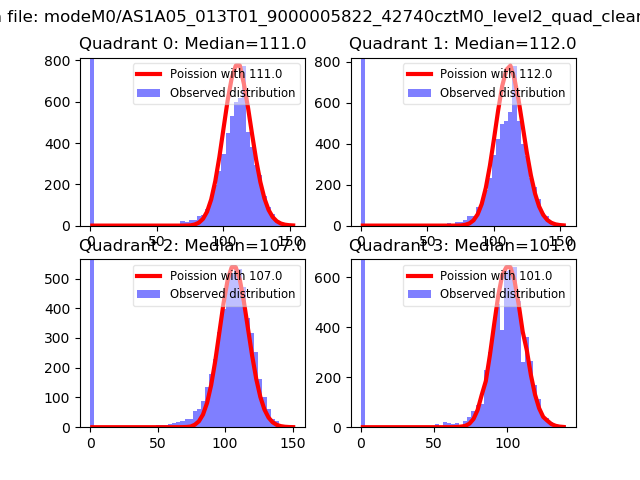 |
 |
| Quadrant-wise count rates Data is divided into 100 sec bins |
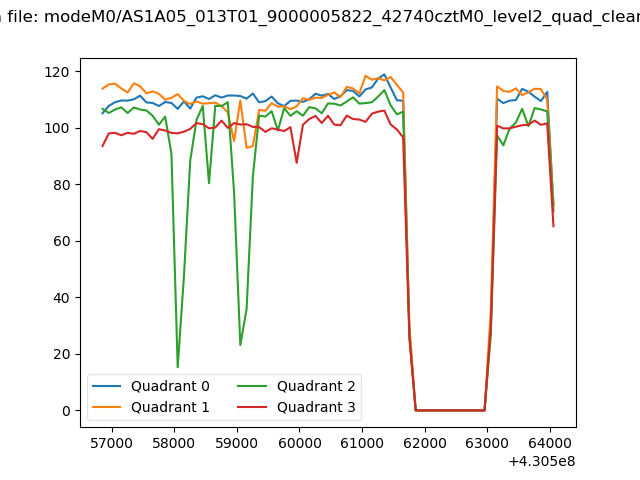 |
|
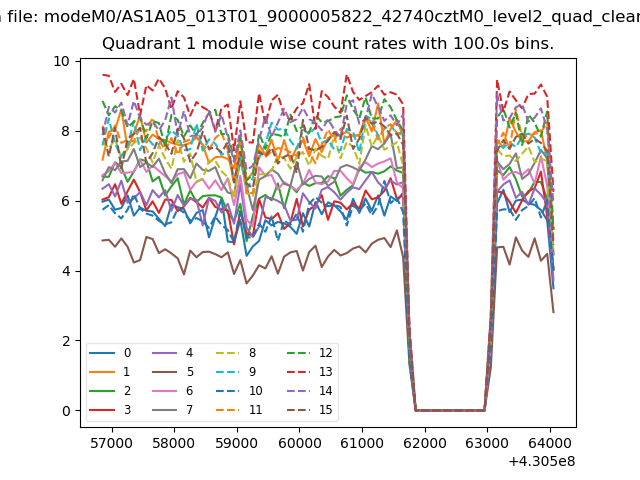
| Module-wise count rates for Quadrant A Data is divided into 100 sec bins |
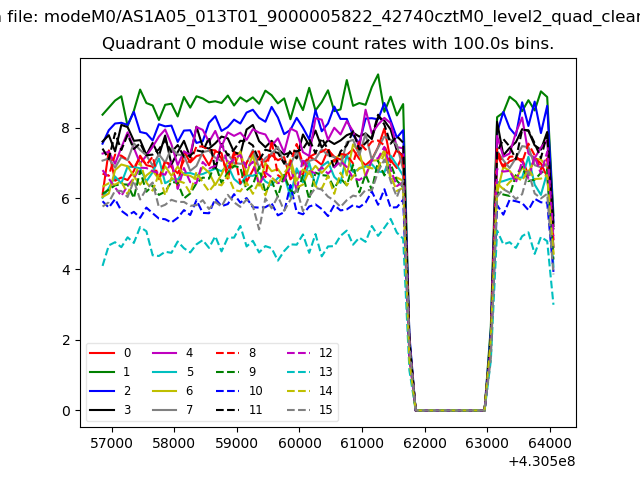 |
 |
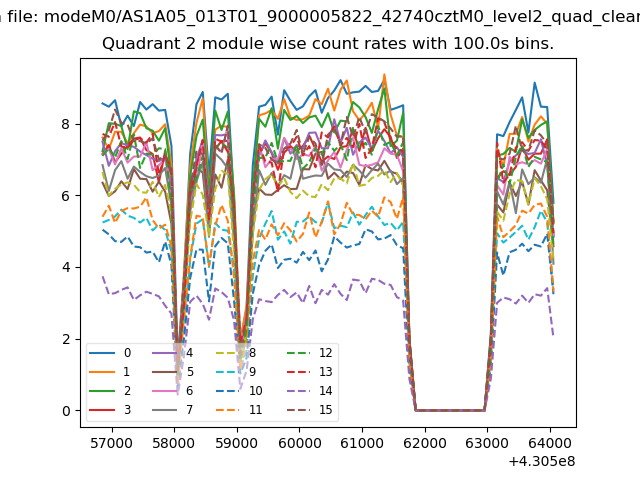
| Module-wise count rates for Quadrant B Data is divided into 100 sec bins |
 |
 |
| Module-wise count rates for Quadrant C Data is divided into 100 sec bins |
 |
 |
| Module-wise count rates for Quadrant D Data is divided into 100 sec bins |
 |
 |
| Parameter | Plot |
|---|---|
| CZT HV Monitor | 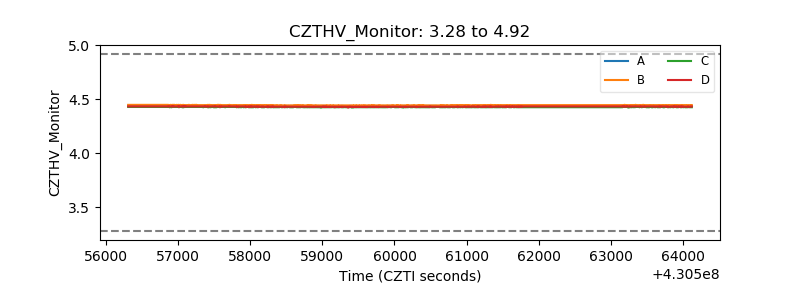 |
| D_VDD | 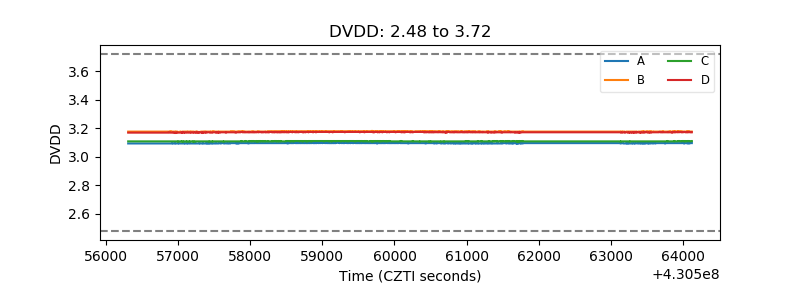 |
| Temperature 1 | 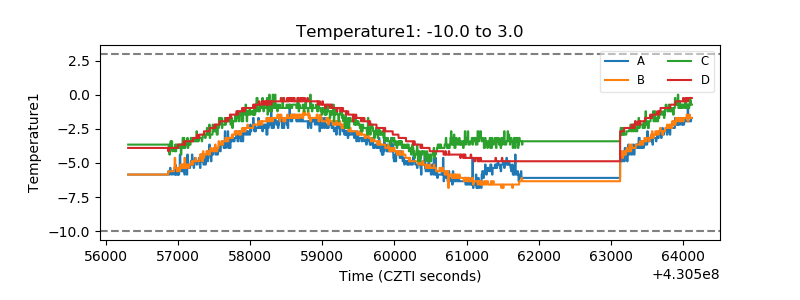 |
| Veto HV Monitor | 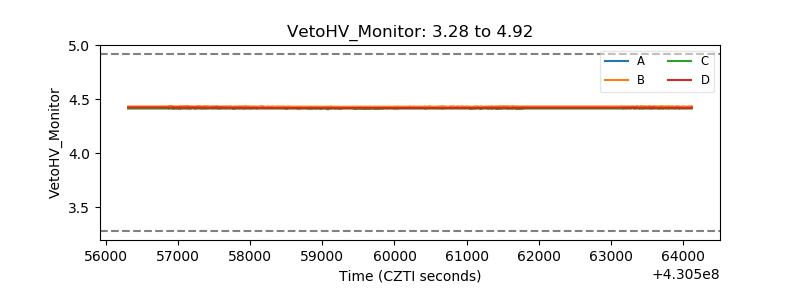 |
| Veto LLD | 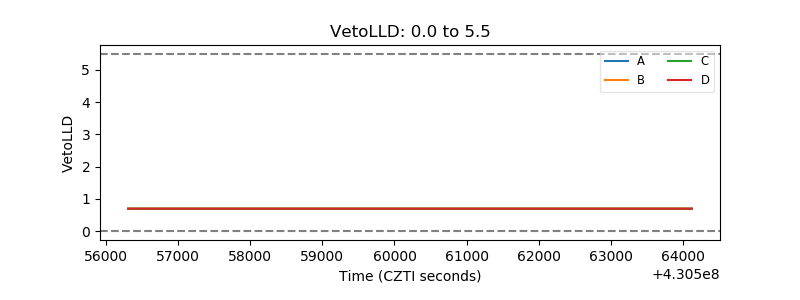 |
| Alpha Counter | 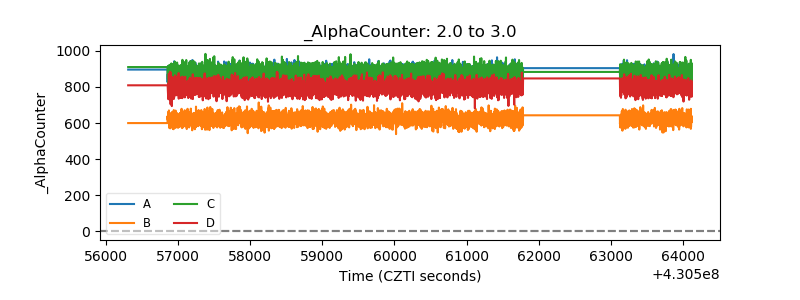 |
| _CPM_Rate | 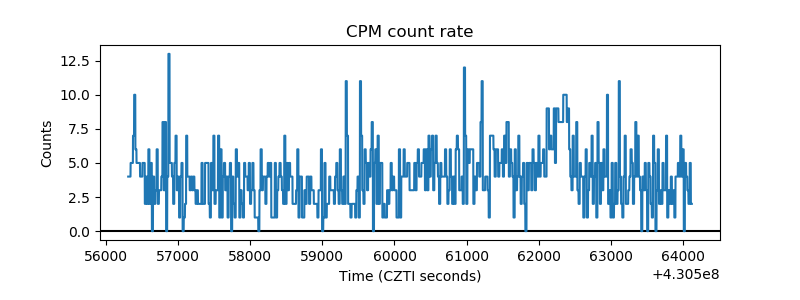 |
| CZT Counter | 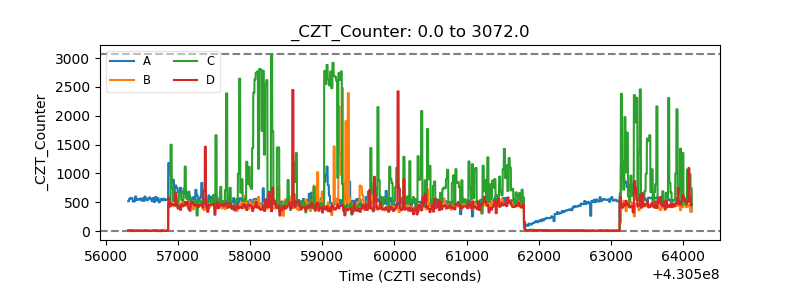 |
| +2.5 Volts monitor | 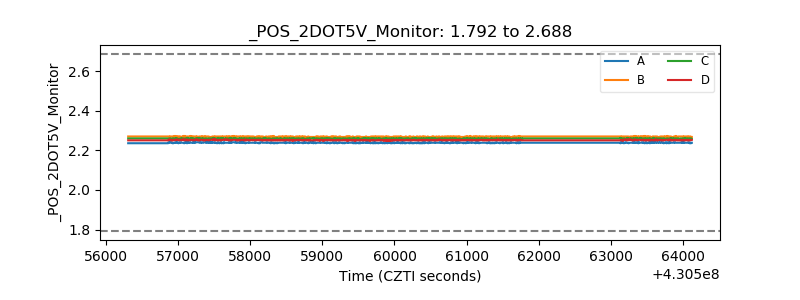 |
| +5 Volts monitor | 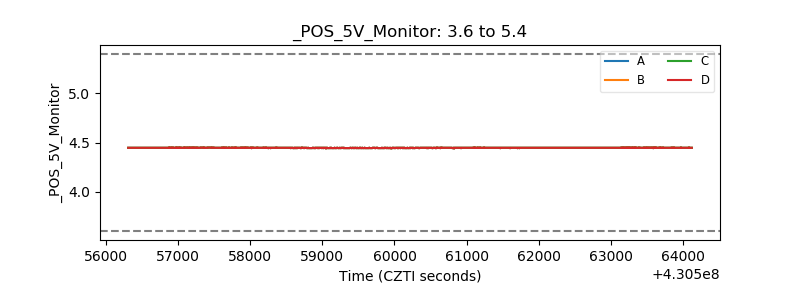 |
| _ROLL_ROT | 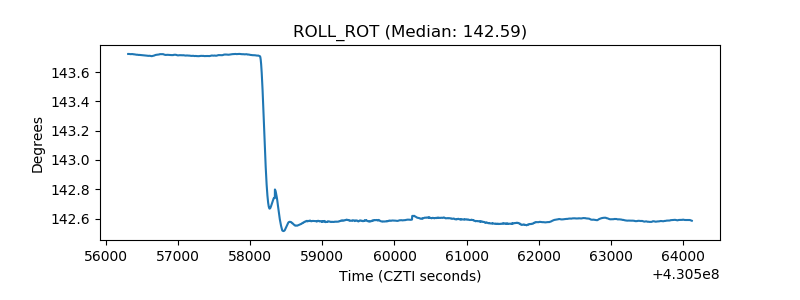 |
| _Roll_DEC | 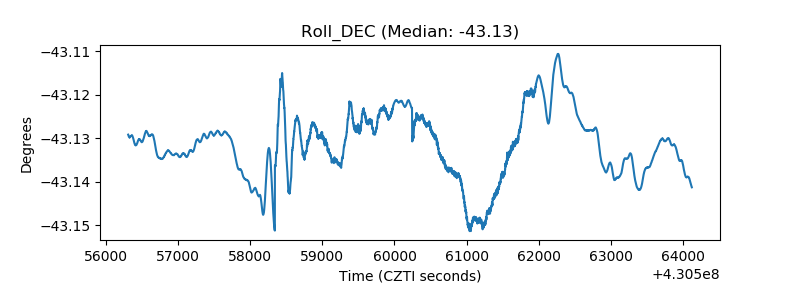 |
| _Roll_RA | 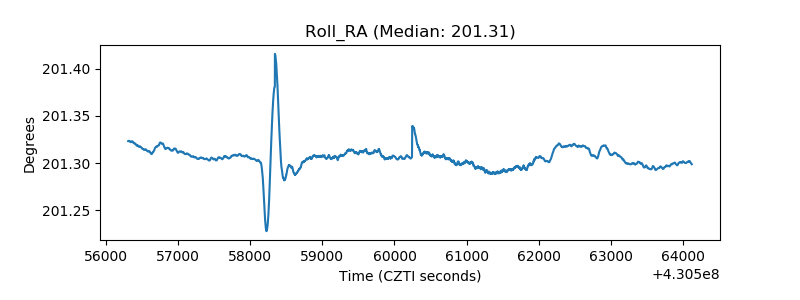 |
| Veto Counter | 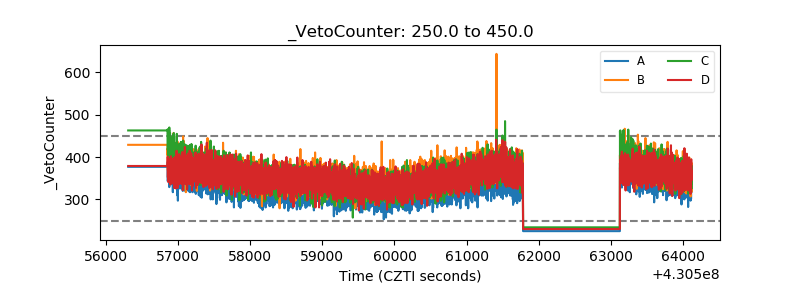 |