| Param | Original file | Final file |
|---|---|---|
| Filename | modeM0/AS1A05_013T01_9000005822_42741cztM0_level2.fits | modeM0/AS1A05_013T01_9000005822_42741cztM0_level2_quad_clean.evt |
| Size (bytes) | 476,795,520 | 93,922,560 |
| Size | 454.7 MB | 89.6 MB |
| Events in quadrant A | 3,649,469 | 660,860 |
| Events in quadrant B | 5,094,332 | 537,844 |
| Events in quadrant C | 4,466,708 | 632,979 |
| Events in quadrant D | 3,971,141 | 592,204 |
| Mode M0 | |||
|---|---|---|---|
| Quadrant | BADHDUFLAG | Total packets | Discarded packets |
| A | 0 | 14350 | 2 |
| B | 0 | 19311 | 9 |
| C | 0 | 17265 | 2 |
| D | 0 | 15942 | 2 |
| Mode M9 | |||
|---|---|---|---|
| Quadrant | BADHDUFLAG | Total packets | Discarded packets |
| A | 0 | 18 | 0 |
| B | 0 | 19 | 0 |
| C | 0 | 19 | 0 |
| D | 0 | 19 | 0 |
| Mode SS | |||
|---|---|---|---|
| Quadrant | BADHDUFLAG | Total packets | Discarded packets |
| A | 0 | 122 | 0 |
| B | 0 | 122 | 0 |
| C | 0 | 122 | 0 |
| D | 0 | 122 | 0 |
| Quadrant | Total seconds | Saturated seconds | Saturation percentage |
|---|---|---|---|
| A | 6015 | 127 | 2.111388% |
| B | 6014 | 1225 | 20.369139% |
| C | 6014 | 315 | 5.237779% |
| D | 6014 | 265 | 4.406385% |
Noise dominated data is calculated using 1-second bins in cleaned event files. If a bin has >2000 counts, and if more than 50% of those come from <1% of pixels, then it is considered to be noise-dominated and hence unusable.
| Quadrant | # 1 sec bins | Bins with >0 counts | Bins with >2000 counts | High rate bins dominated by noise | Noise dominated (total time) | Noise dominated (detector-on time) | Marked lightcurve |
|---|---|---|---|---|---|---|---|
| A | 7298 | 6016 | 103 | 103 | 1.41% | 1.71% | 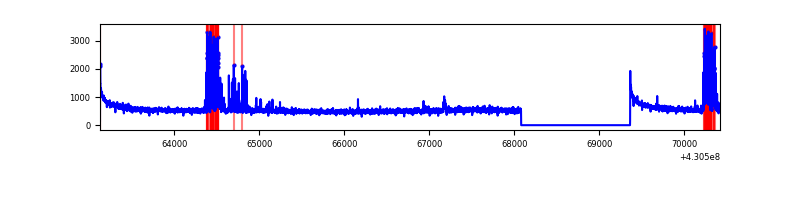 |
| B | 7297 | 6015 | 1044 | 1044 | 14.31% | 17.36% | 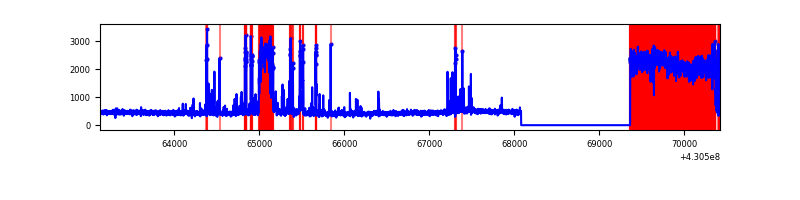 |
| C | 7297 | 6015 | 292 | 292 | 4.00% | 4.85% | 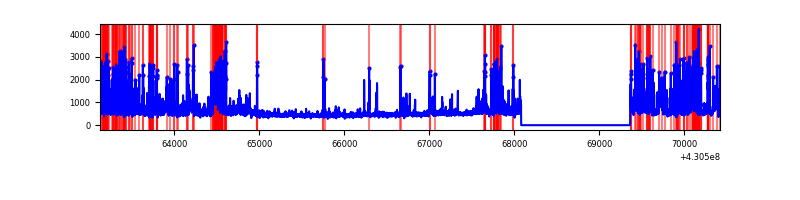 |
| D | 7296 | 6014 | 291 | 291 | 3.99% | 4.84% | 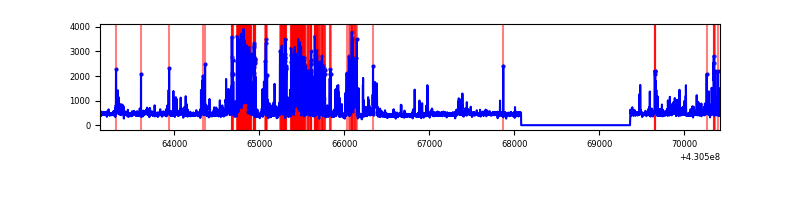 |
Top three noisy pixels from each quadrant. If the there are fewer than three noisy pixels in the level2.evt file, extra rows are filled as -1
| Pixel properties | Quadrant properties | ||||||
|---|---|---|---|---|---|---|---|
| Quadrant | DetID | PixID | Counts | Sigma | Mean | Median | Sigma |
| A | 10 | 83 | 650181 | 4756.32 | 663 | 650 | 136.6 |
| A | 13 | 248 | 416090 | 3042.15 | 663 | 650 | 136.6 |
| A | 13 | 254 | 8728 | 59.15 | 663 | 650 | 136.6 |
| B | 4 | 81 | 2150844 | 19205.08 | 565 | 547 | 112.0 |
| B | 5 | 172 | 600348 | 5357.04 | 565 | 547 | 112.0 |
| B | 0 | 156 | 30027 | 263.3 | 565 | 547 | 112.0 |
| C | 0 | 239 | 1204616 | 8060.85 | 636 | 640 | 149.4 |
| C | 4 | 254 | 422156 | 2822.13 | 636 | 640 | 149.4 |
| C | 15 | 214 | 245242 | 1637.66 | 636 | 640 | 149.4 |
| D | 1 | 47 | 982983 | 6211.74 | 642 | 625 | 158.1 |
| D | 5 | 171 | 135047 | 849.99 | 642 | 625 | 158.1 |
| D | 2 | 249 | 90562 | 568.7 | 642 | 625 | 158.1 |
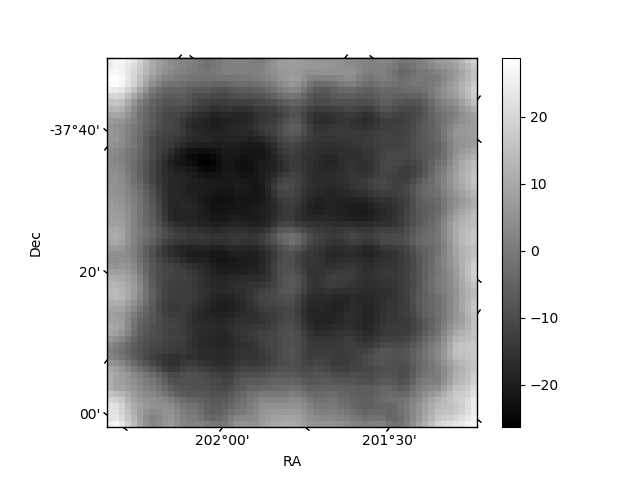
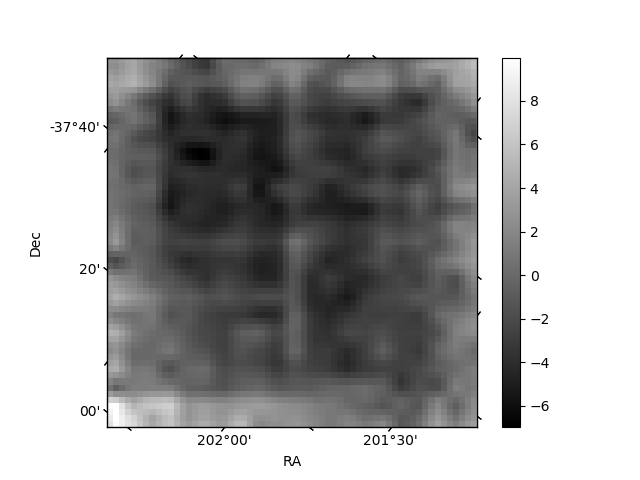
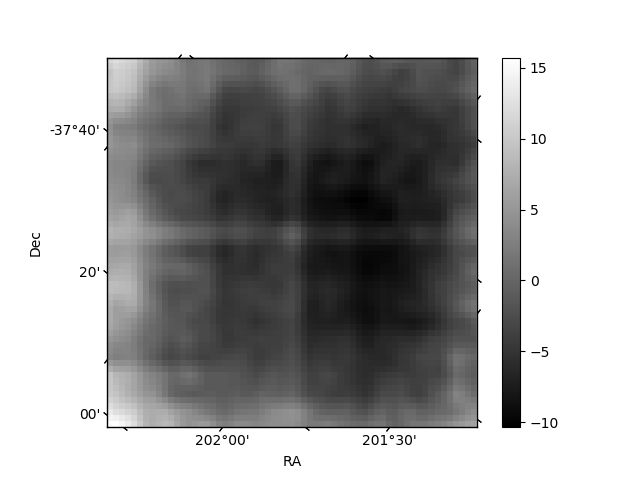
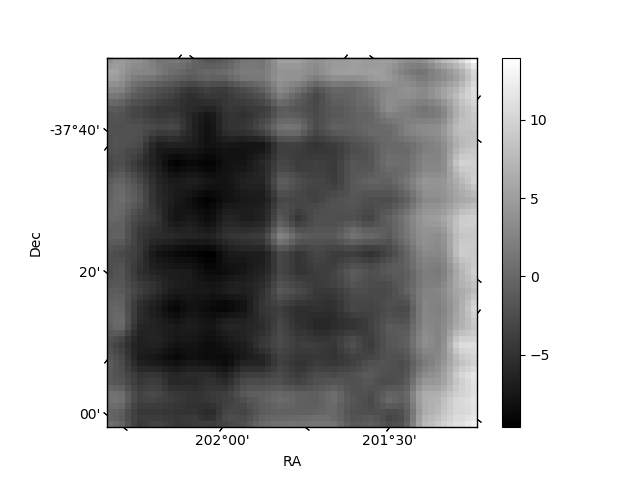
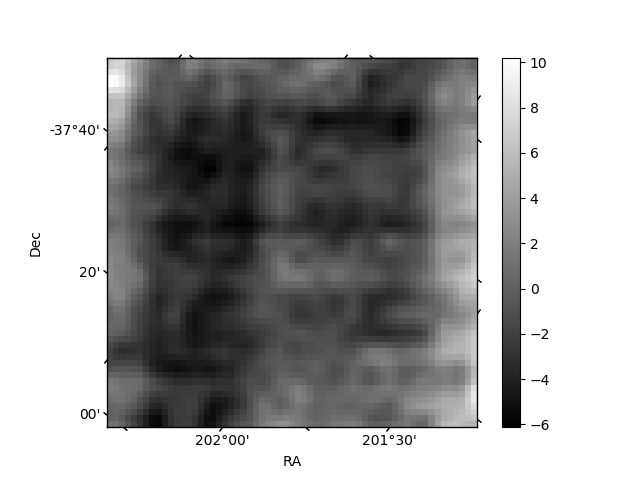
Histogram calculated using DETX and DETY for each event in the final _common_clean file
| Quadrant A | 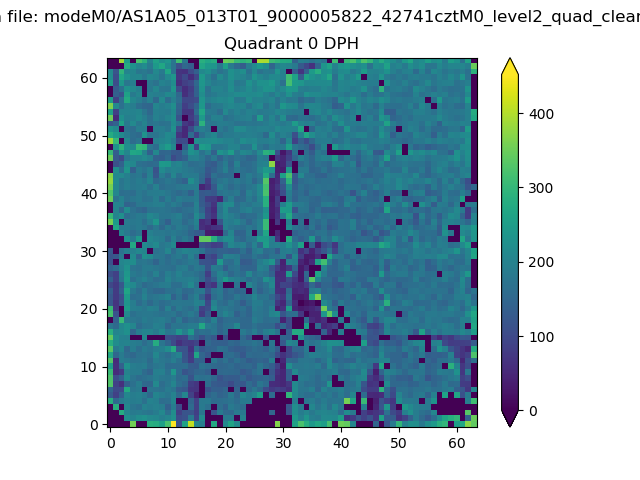 |
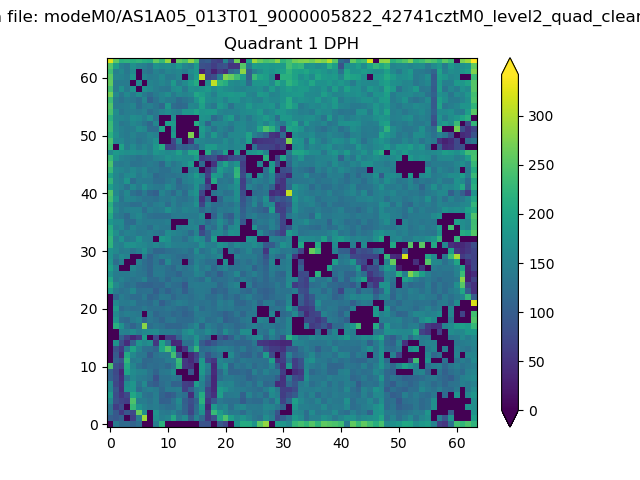 |
Quadrant B |
|---|---|---|---|
| Quadrant D | 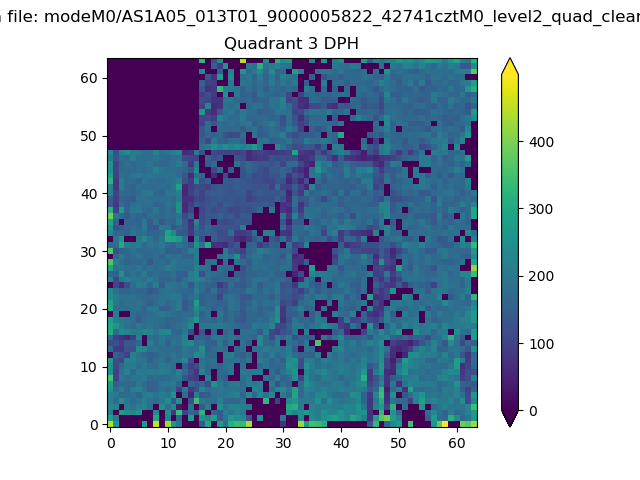 |
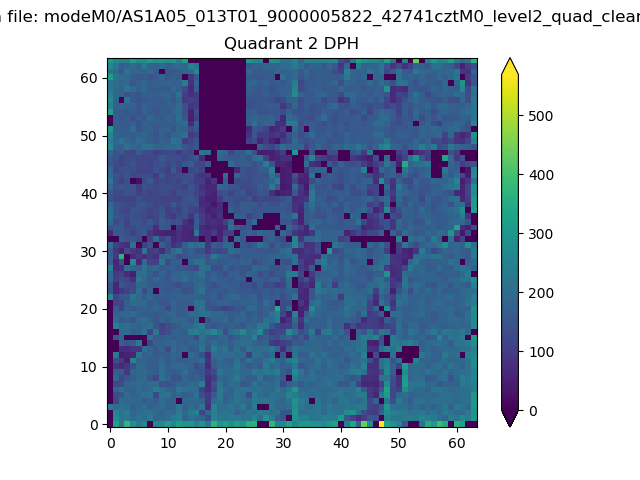 |
Quadrant C |
| Plot type | Count rate plots | Images |
|---|---|---|
| Comparison with Poisson distribution Blue bars denote a histogram of data divided into 1 sec bins. Red curve is a Poisson curve with rate = median count rate of data. |
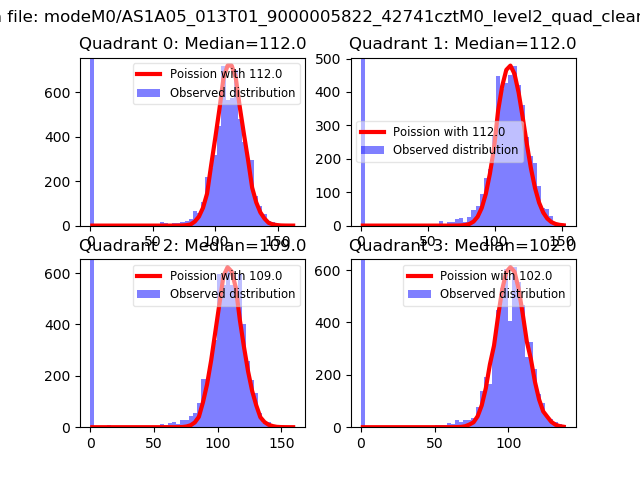 |
 |
| Quadrant-wise count rates Data is divided into 100 sec bins |
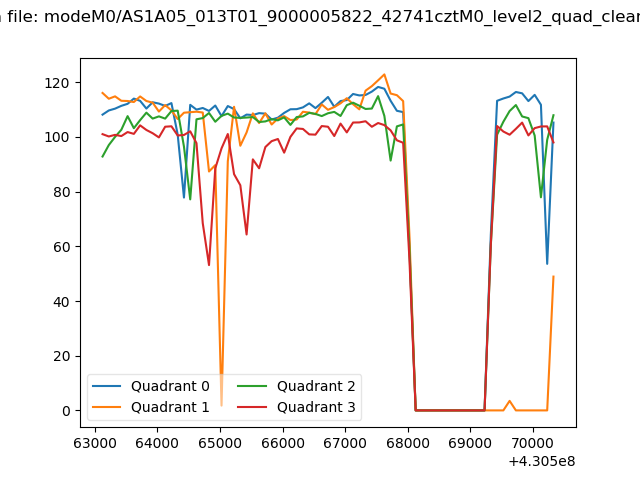 |
|
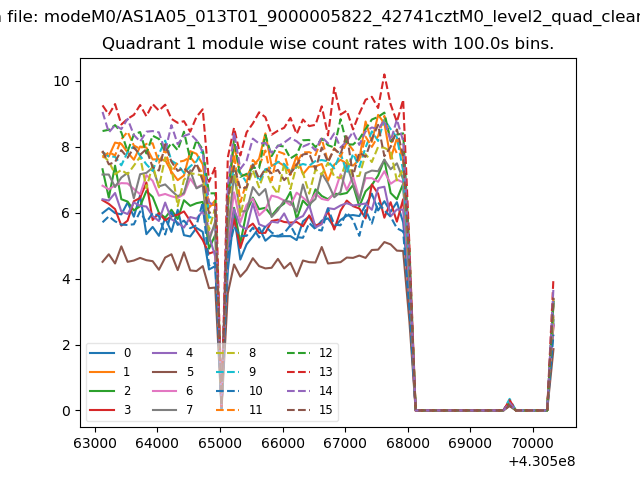
| Module-wise count rates for Quadrant A Data is divided into 100 sec bins |
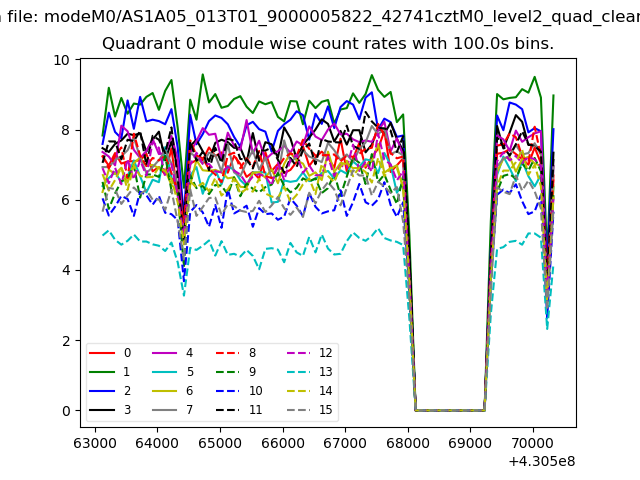 |
 |
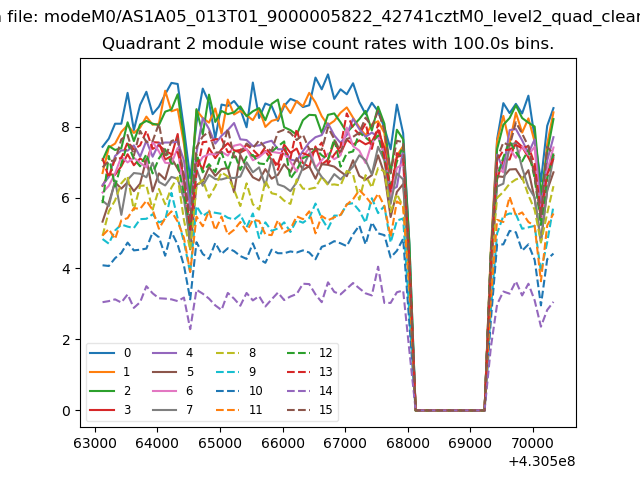
| Module-wise count rates for Quadrant B Data is divided into 100 sec bins |
 |
 |
| Module-wise count rates for Quadrant C Data is divided into 100 sec bins |
 |
 |
| Module-wise count rates for Quadrant D Data is divided into 100 sec bins |
 |
 |
| Parameter | Plot |
|---|---|
| CZT HV Monitor | 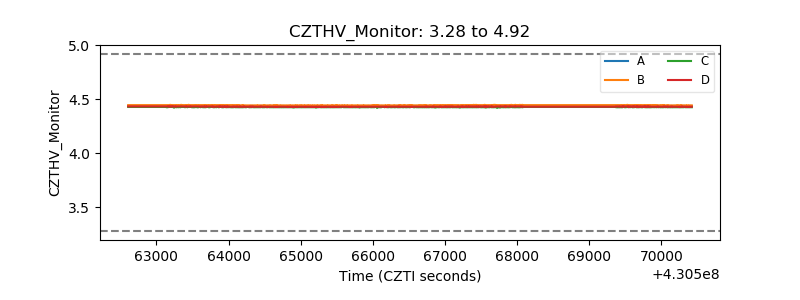 |
| D_VDD | 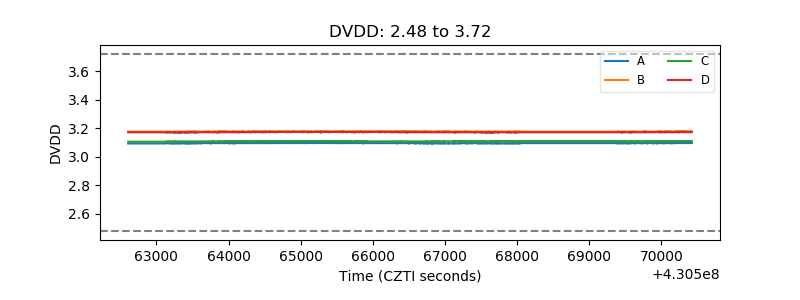 |
| Temperature 1 | 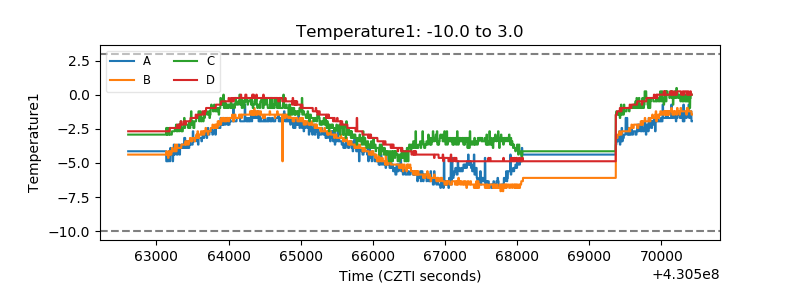 |
| Veto HV Monitor | 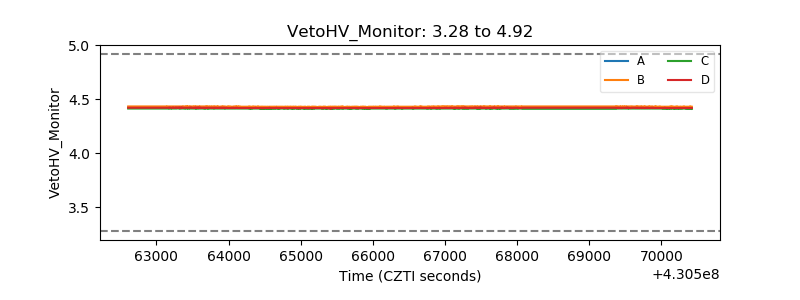 |
| Veto LLD |  |
| Alpha Counter | 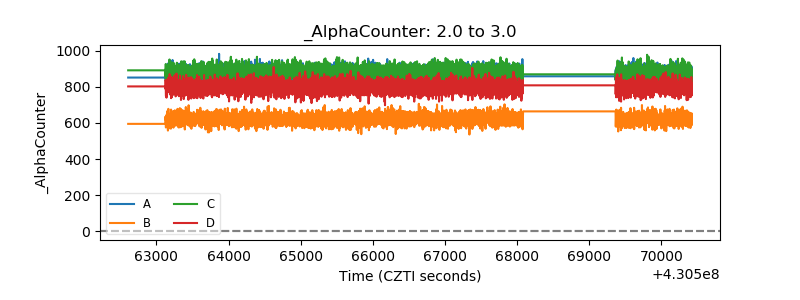 |
| _CPM_Rate | 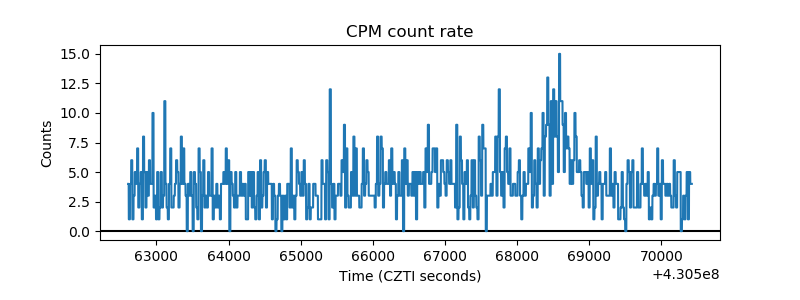 |
| CZT Counter | 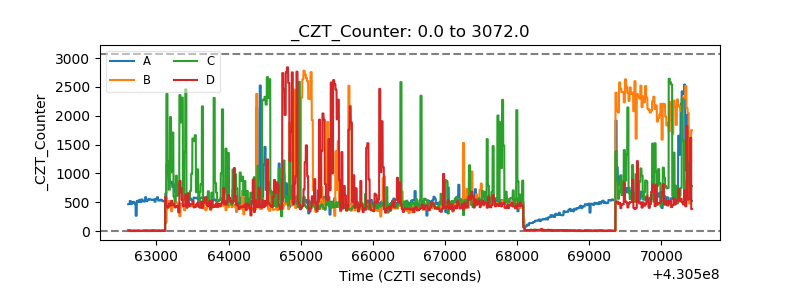 |
| +2.5 Volts monitor | 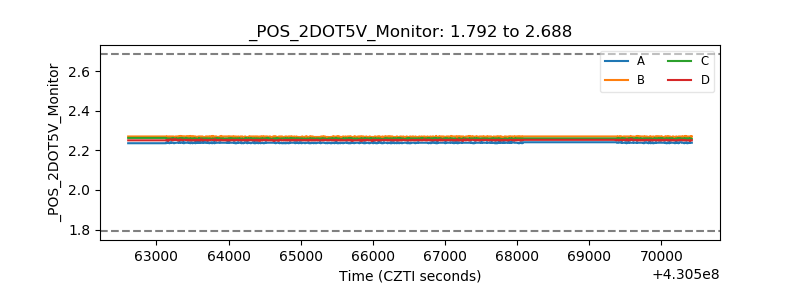 |
| +5 Volts monitor | 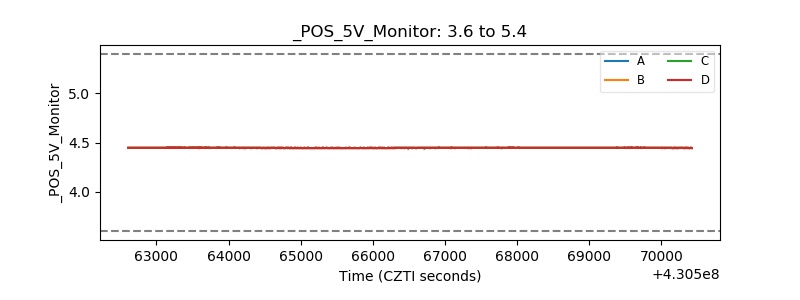 |
| _ROLL_ROT | 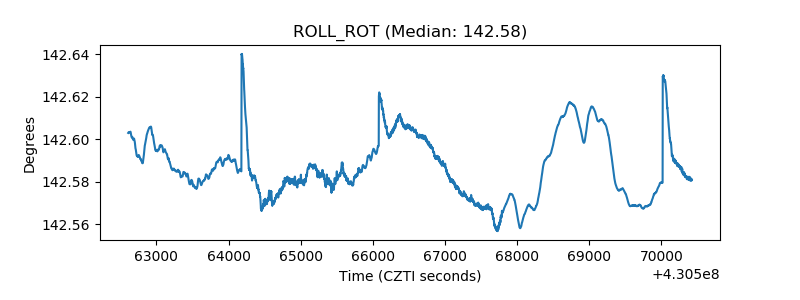 |
| _Roll_DEC | 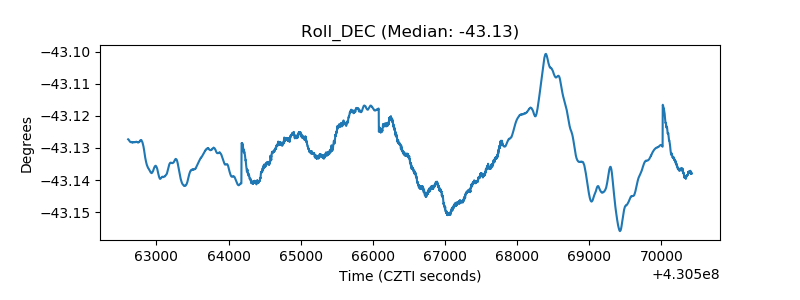 |
| _Roll_RA | 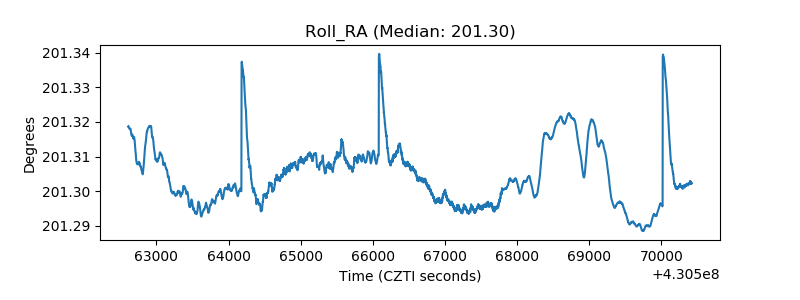 |
| Veto Counter | 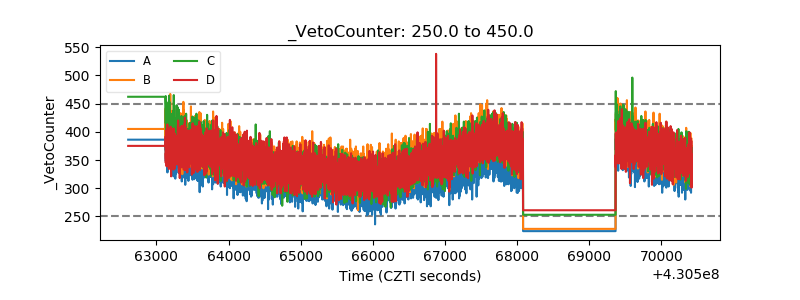 |