| Param | Original file | Final file |
|---|---|---|
| Filename | modeM0/AS1A05_013T01_9000005822_42744cztM0_level2.fits | modeM0/AS1A05_013T01_9000005822_42744cztM0_level2_quad_clean.evt |
| Size (bytes) | 384,808,320 | 85,639,680 |
| Size | 367.0 MB | 81.7 MB |
| Events in quadrant A | 2,987,894 | 595,082 |
| Events in quadrant B | 3,440,029 | 543,714 |
| Events in quadrant C | 4,346,615 | 550,353 |
| Events in quadrant D | 3,051,533 | 527,612 |
| Mode M0 | |||
|---|---|---|---|
| Quadrant | BADHDUFLAG | Total packets | Discarded packets |
| A | 0 | 12104 | 1 |
| B | 0 | 13787 | 1 |
| C | 0 | 16466 | 1 |
| D | 0 | 12944 | 1 |
| Mode M9 | |||
|---|---|---|---|
| Quadrant | BADHDUFLAG | Total packets | Discarded packets |
| A | 0 | 16 | 0 |
| B | 0 | 16 | 0 |
| C | 0 | 16 | 0 |
| D | 0 | 16 | 0 |
| Mode SS | |||
|---|---|---|---|
| Quadrant | BADHDUFLAG | Total packets | Discarded packets |
| A | 0 | 110 | 0 |
| B | 0 | 110 | 0 |
| C | 0 | 110 | 0 |
| D | 0 | 110 | 0 |
| Quadrant | Total seconds | Saturated seconds | Saturation percentage |
|---|---|---|---|
| A | 5369 | 22 | 0.409760% |
| B | 5370 | 496 | 9.236499% |
| C | 5369 | 415 | 7.729559% |
| D | 5369 | 213 | 3.967219% |
Noise dominated data is calculated using 1-second bins in cleaned event files. If a bin has >2000 counts, and if more than 50% of those come from <1% of pixels, then it is considered to be noise-dominated and hence unusable.
| Quadrant | # 1 sec bins | Bins with >0 counts | Bins with >2000 counts | High rate bins dominated by noise | Noise dominated (total time) | Noise dominated (detector-on time) | Marked lightcurve |
|---|---|---|---|---|---|---|---|
| A | 6951 | 5370 | 12 | 12 | 0.17% | 0.22% | 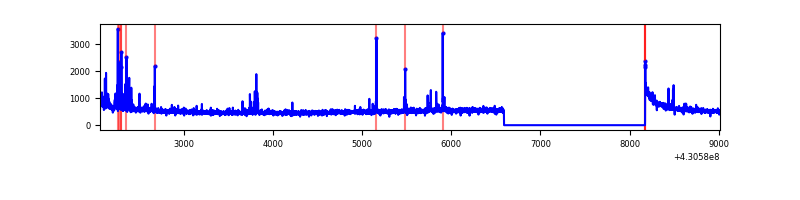 |
| B | 6952 | 5371 | 298 | 298 | 4.29% | 5.55% | 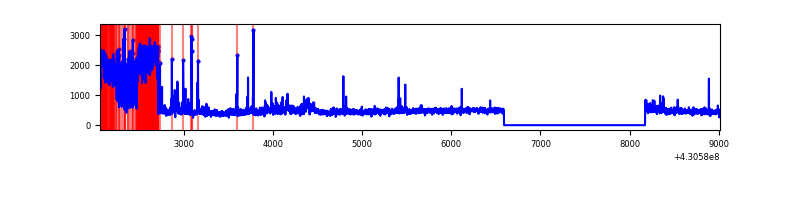 |
| C | 6950 | 5369 | 383 | 383 | 5.51% | 7.13% | 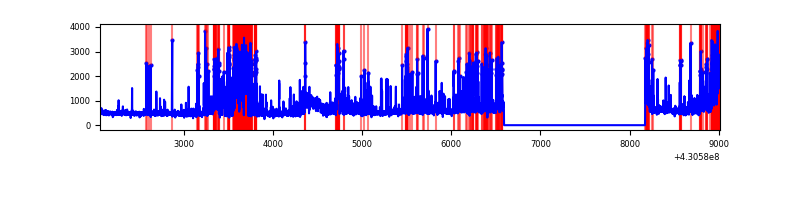 |
| D | 6951 | 5370 | 212 | 212 | 3.05% | 3.95% | 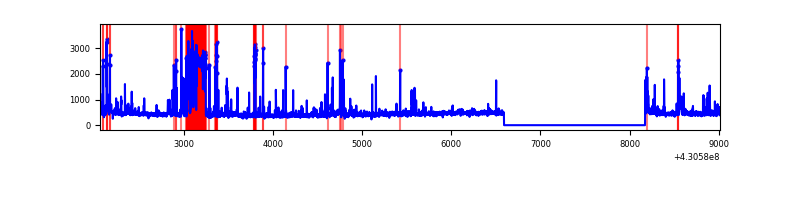 |
Top three noisy pixels from each quadrant. If the there are fewer than three noisy pixels in the level2.evt file, extra rows are filled as -1
| Pixel properties | Quadrant properties | ||||||
|---|---|---|---|---|---|---|---|
| Quadrant | DetID | PixID | Counts | Sigma | Mean | Median | Sigma |
| A | 10 | 83 | 538559 | 4406.87 | 591 | 578 | 122.1 |
| A | 13 | 248 | 86792 | 706.22 | 591 | 578 | 122.1 |
| A | 15 | 237 | 31807 | 255.81 | 591 | 578 | 122.1 |
| B | 4 | 81 | 1190630 | 11130.69 | 543 | 527 | 106.9 |
| B | 5 | 172 | 43188 | 399.0 | 543 | 527 | 106.9 |
| B | 0 | 230 | 31559 | 290.23 | 543 | 527 | 106.9 |
| C | 0 | 239 | 1026871 | 7884.19 | 556 | 560 | 130.2 |
| C | 4 | 254 | 844257 | 6481.33 | 556 | 560 | 130.2 |
| C | 15 | 214 | 216788 | 1661.08 | 556 | 560 | 130.2 |
| D | 13 | 249 | 523559 | 3818.41 | 560 | 544 | 137.0 |
| D | 12 | 233 | 91086 | 661.03 | 560 | 544 | 137.0 |
| D | 5 | 70 | 75684 | 548.58 | 560 | 544 | 137.0 |
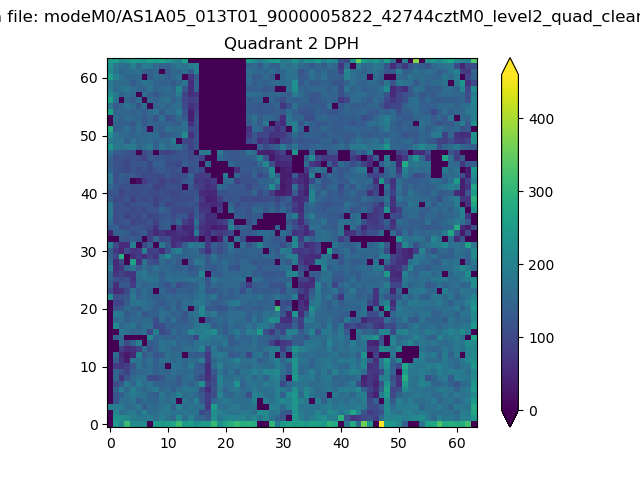
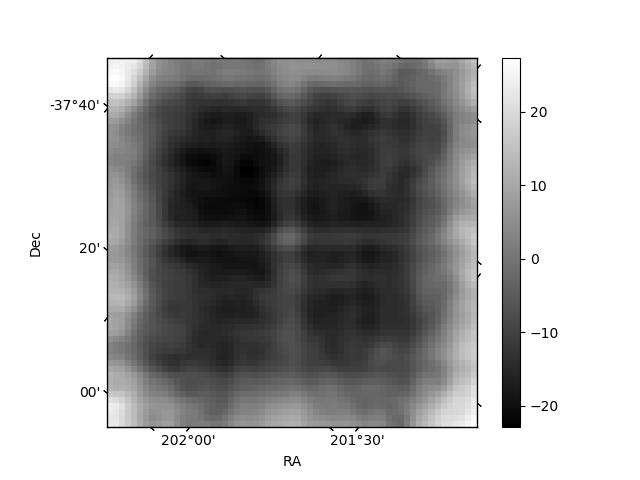
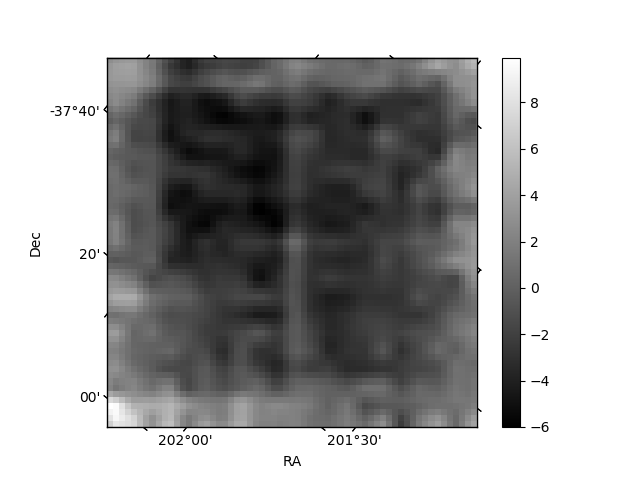
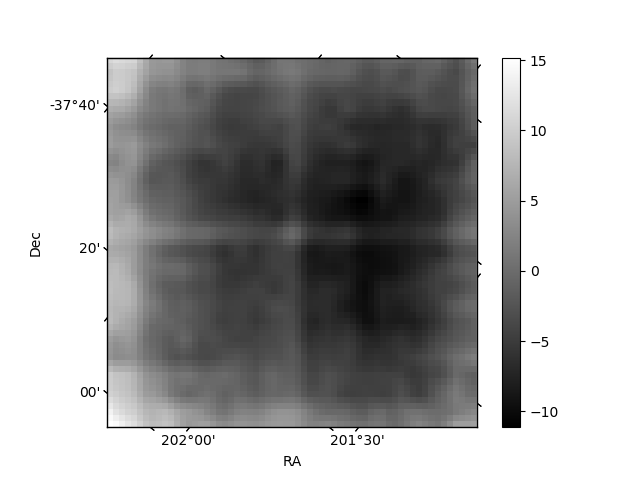
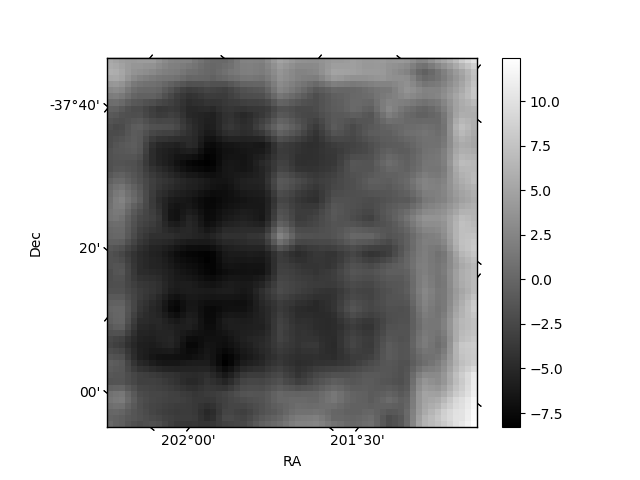
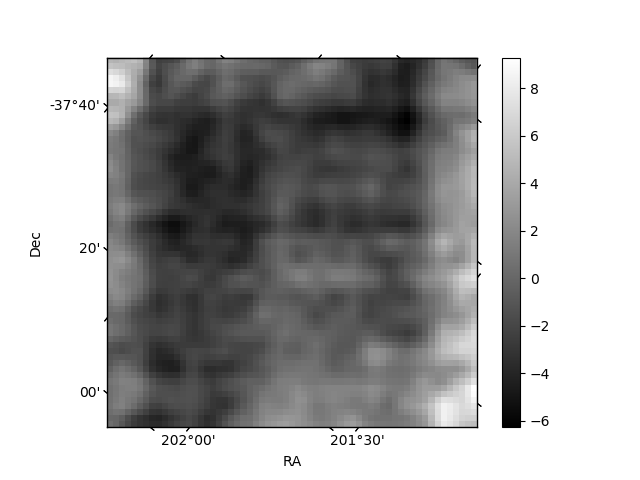
Histogram calculated using DETX and DETY for each event in the final _common_clean file
| Quadrant A | 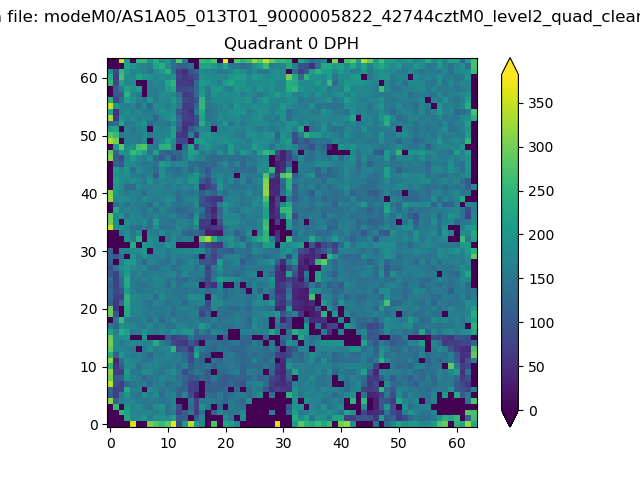 |
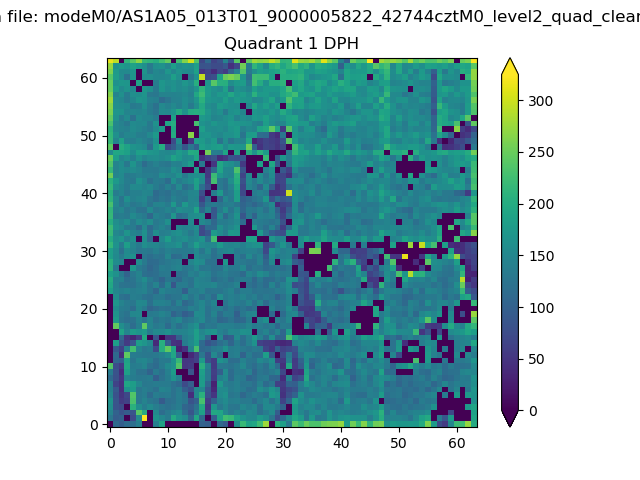 |
Quadrant B |
|---|---|---|---|
| Quadrant D | 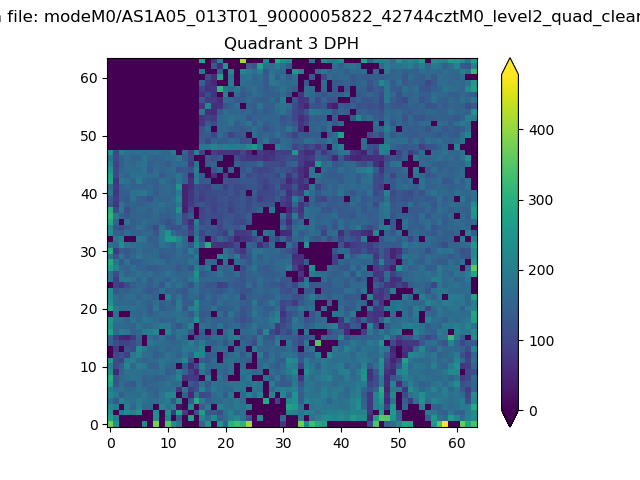 |
 |
Quadrant C |
| Plot type | Count rate plots | Images |
|---|---|---|
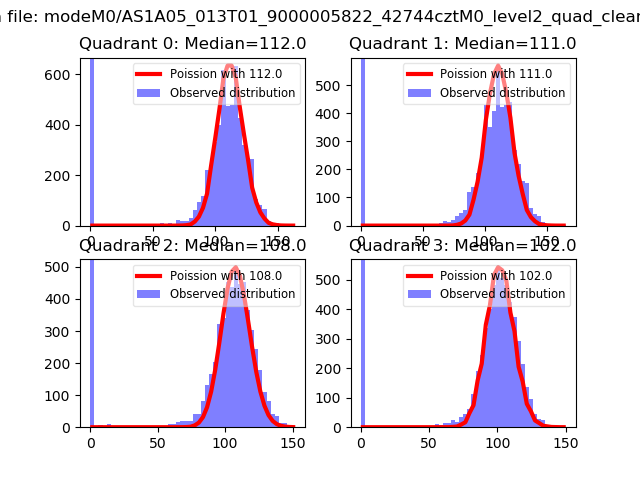
| Comparison with Poisson distribution Blue bars denote a histogram of data divided into 1 sec bins. Red curve is a Poisson curve with rate = median count rate of data. |
 |
 |
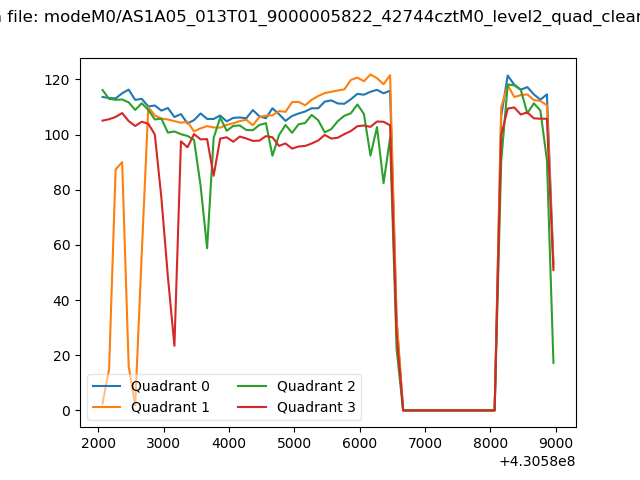
| Quadrant-wise count rates Data is divided into 100 sec bins |
 |
|
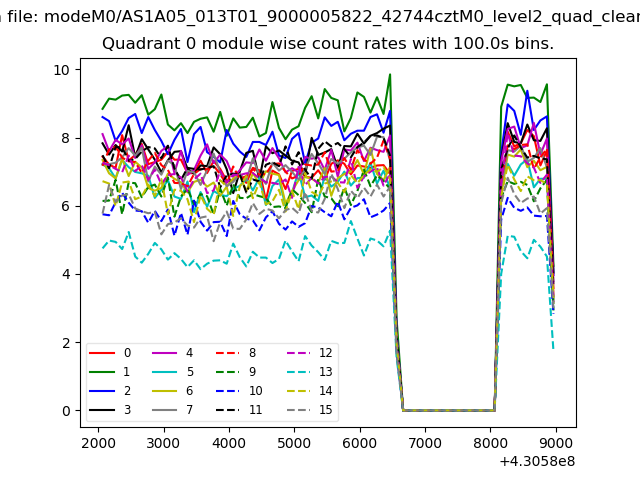
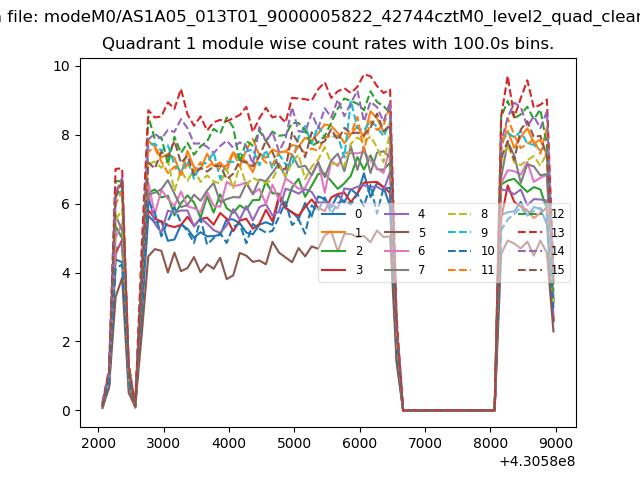
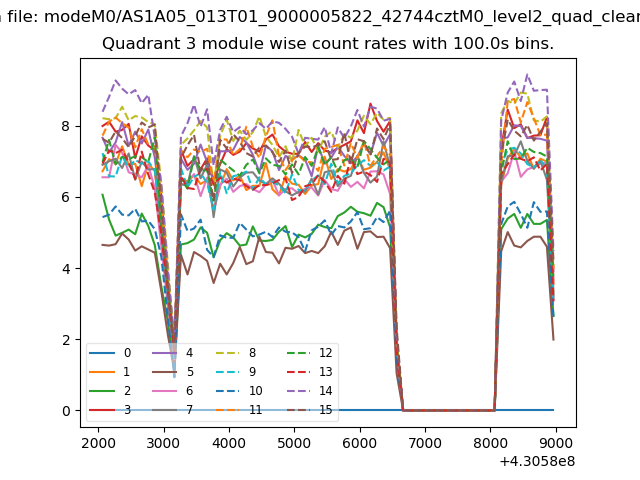
| Module-wise count rates for Quadrant A Data is divided into 100 sec bins |
 |
 |
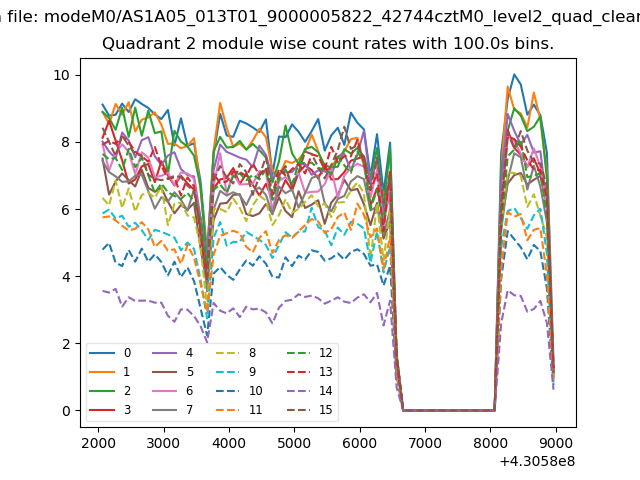
| Module-wise count rates for Quadrant B Data is divided into 100 sec bins |
 |
 |
| Module-wise count rates for Quadrant C Data is divided into 100 sec bins |
 |
 |
| Module-wise count rates for Quadrant D Data is divided into 100 sec bins |
 |
 |
| Parameter | Plot |
|---|---|
| CZT HV Monitor |  |
| D_VDD | 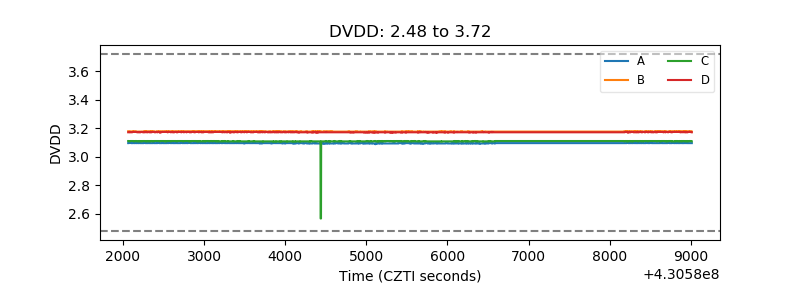 |
| Temperature 1 | 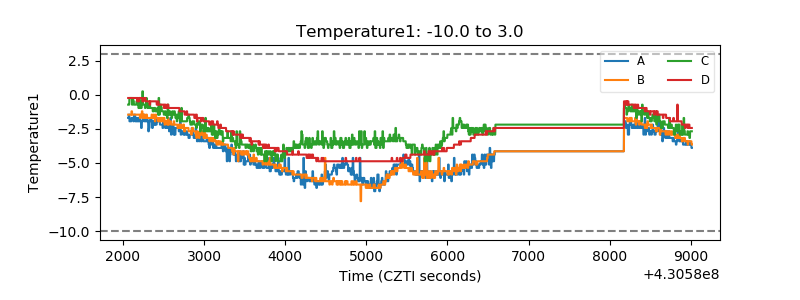 |
| Veto HV Monitor | 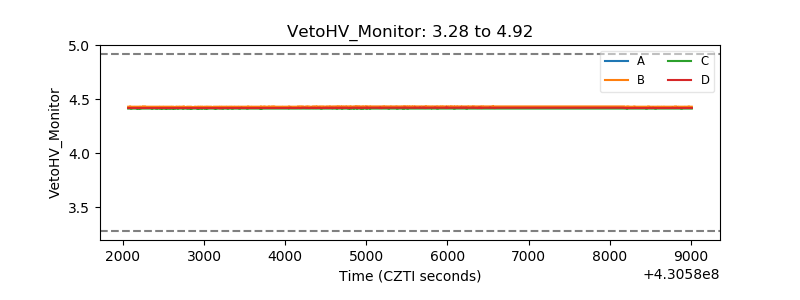 |
| Veto LLD | 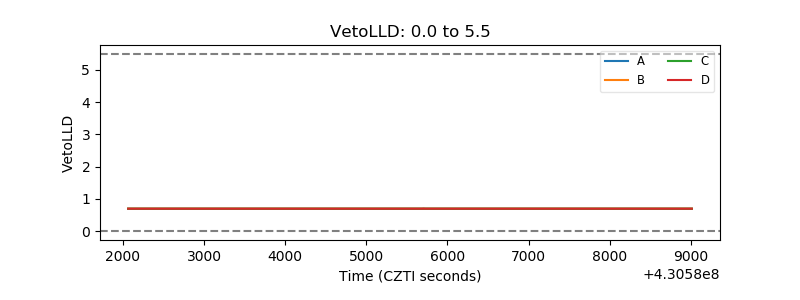 |
| Alpha Counter | 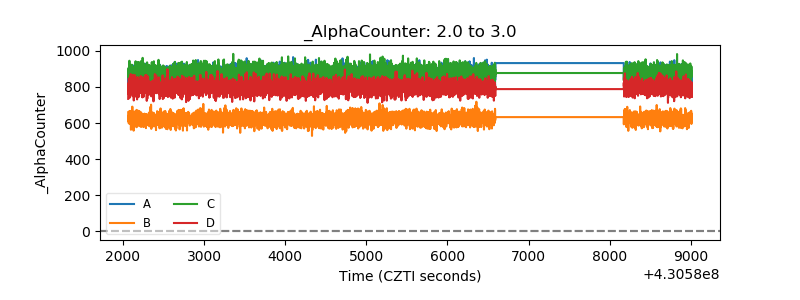 |
| _CPM_Rate | 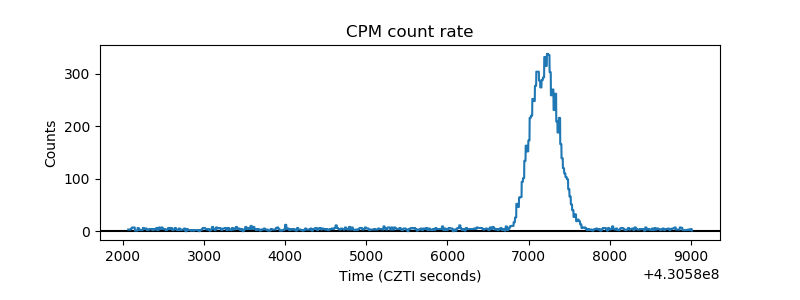 |
| CZT Counter | 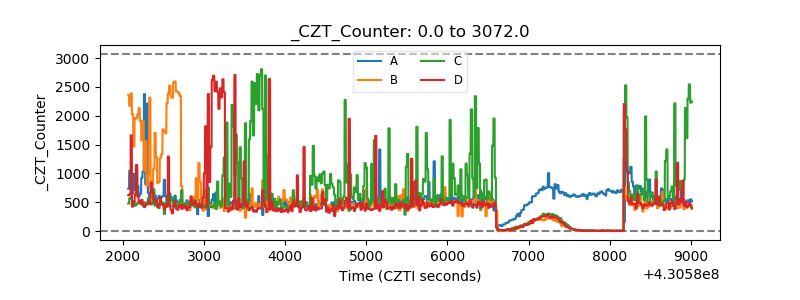 |
| +2.5 Volts monitor | 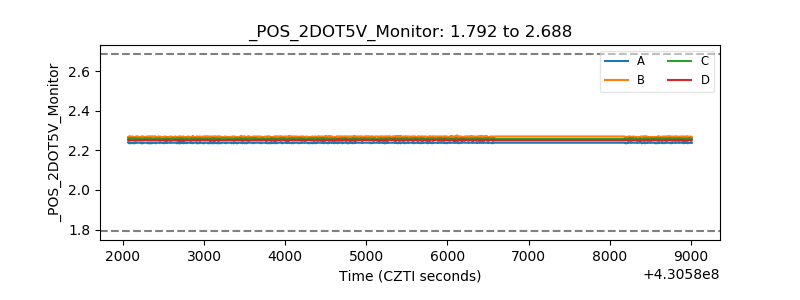 |
| +5 Volts monitor | 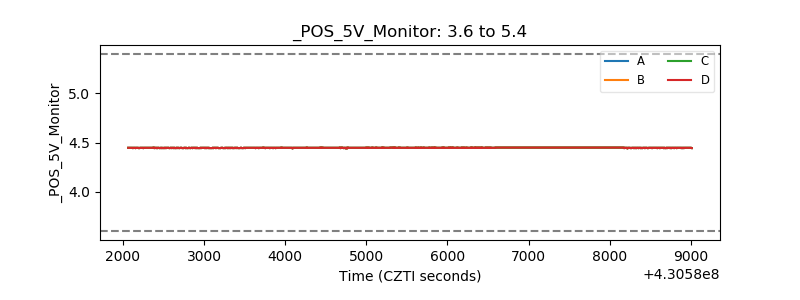 |
| _ROLL_ROT | 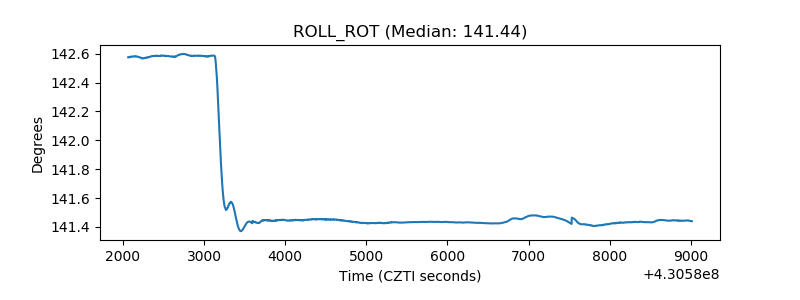 |
| _Roll_DEC | 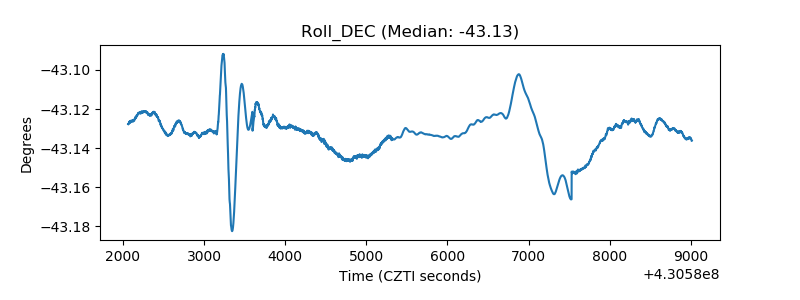 |
| _Roll_RA | 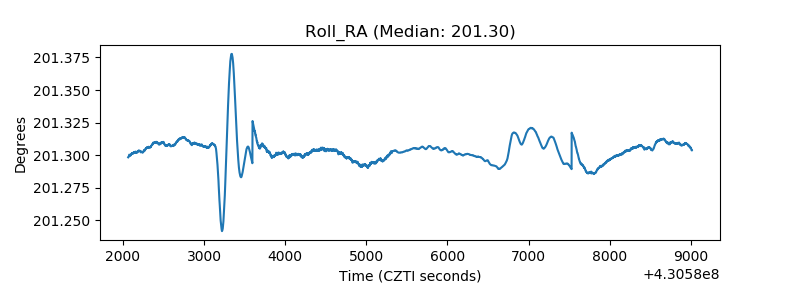 |
| Veto Counter | 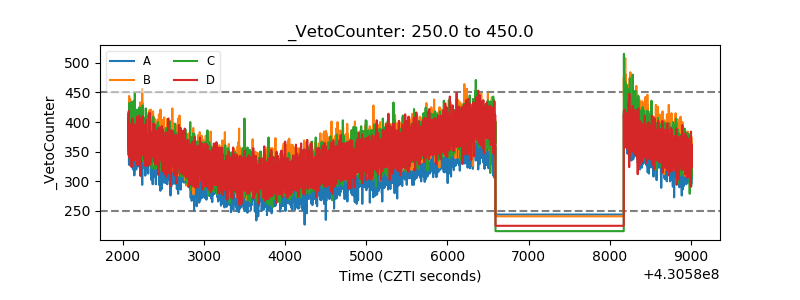 |